
Journal of Geographical Sciences >
Possible NPP changes and risky ecosystem region identification in China during the 21st century based on BCC-CSM2
|
Zhang Chi (1986-), PhD, specialized in moisture tracking and climate change. E-mail: zhangchi@igsnrr.ac.cn |
Received date: 2019-12-31
Accepted date: 2020-05-22
Online published: 2020-10-25
Supported by
National Key Research and Development Program of China(2018YFC1509003)
National Key Research and Development Program of China(2018YFC1508902)
National Natural Science Foundation of China(41701033)
Strategic Priority Research Program of Chinese Academy of Sciences(XDA19040304)
Copyright
Based on simulations by the Beijing Climate Center climate system model version 2 (BCC-CSM2), the possible changes in net primary productivity (NPP) of the terrestrial ecosystem in China during the 21st century are explored under the Shared Socioeconomic Pathway 2 (SSP2) 4.5 scenario. We found both the near-term and long-term terrestrial NPP basically shows a unanimously increasing trend, which indicates low ecosystem productivity risk in the future. However, the simple linear regression is insufficient to characterize the long-term variation of NPP. Using the piecewise linear regression approach, we identify a decreasing trend of NPP in large areas for the latter part of the 21st century. In the northeast region (NER) from east Inner Mongolia to west Heilongjiang province, NPP decreases significantly after 2059 at a rate of -0.9% dec-1. In the south region (SR) from Zhejiang to Guangxi provinces, a rapid decline of -2.4% dec-1 is detected after 2085. Further analysis reveals that the rapid decline in SR is primarily attributed to the decrease in precipitation, with temperature playing a secondary role, while the NPP decline in NER seems to have no evident relations with climate change. These findings are useful for making preparations for potential ecosystem crisis in China in the future.
Key words: climate change; NPP; ecosystem risk; turning point; SSP245
ZHANG Chi , WU Shaohong , LENG Guoyong . Possible NPP changes and risky ecosystem region identification in China during the 21st century based on BCC-CSM2[J]. Journal of Geographical Sciences, 2020 , 30(8) : 1219 -1232 . DOI: 10.1007/s11442-020-1778-8
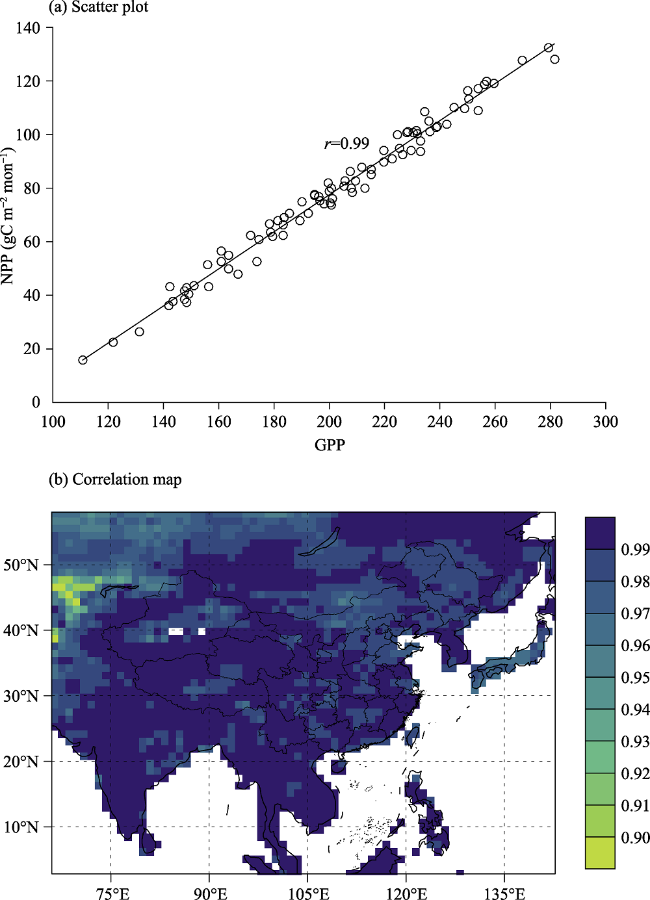
Figure 1 (a) Scatter plot between GPP and NPP from an example grid cell in June from 2015-2100 (The line is the linear fit. r represents the correlation coefficient.); (b) Correlation coefficient distribution between GPP and NPP in June from 2015-2100 (Grids shown are all significant at the 0.05 level.) |
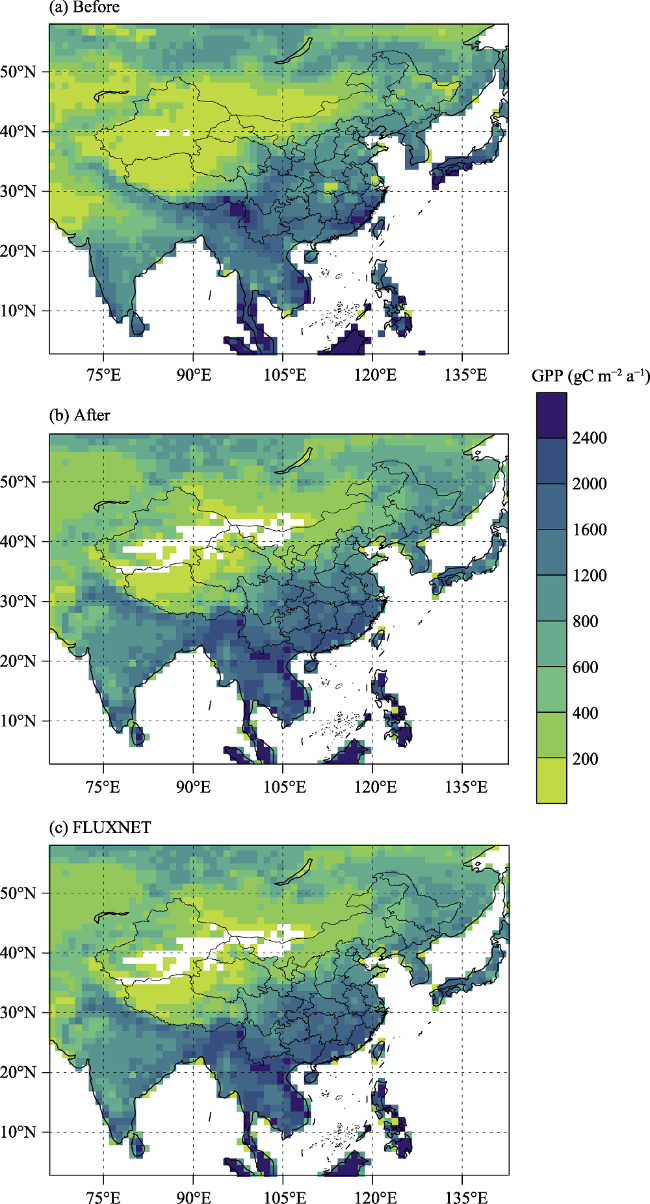
Figure 2 Annual mean GPP distribution (gC m-2 a-1) during 1980-2013 with BCC-CSM2 before (a) and after (b) quantile mapping, and with observational FLUXNET (c) |
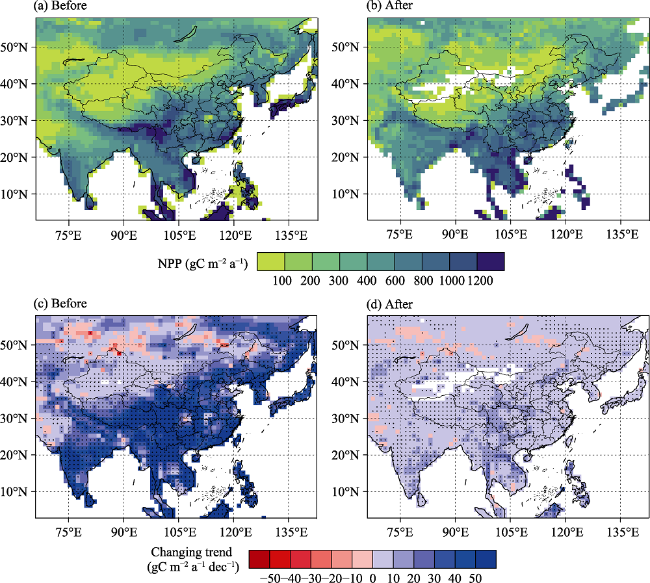
Figure 3 Annual mean NPP (a and b, gC m-2 a-1) and the changing trend (c and d, gC m-2 a-1 dec-1) from 2015-2050 (The left and right plots are for the results before and after the transformation from GPP, respectively. The dots indicate the areas with significant trends at the 0.05 level.) |
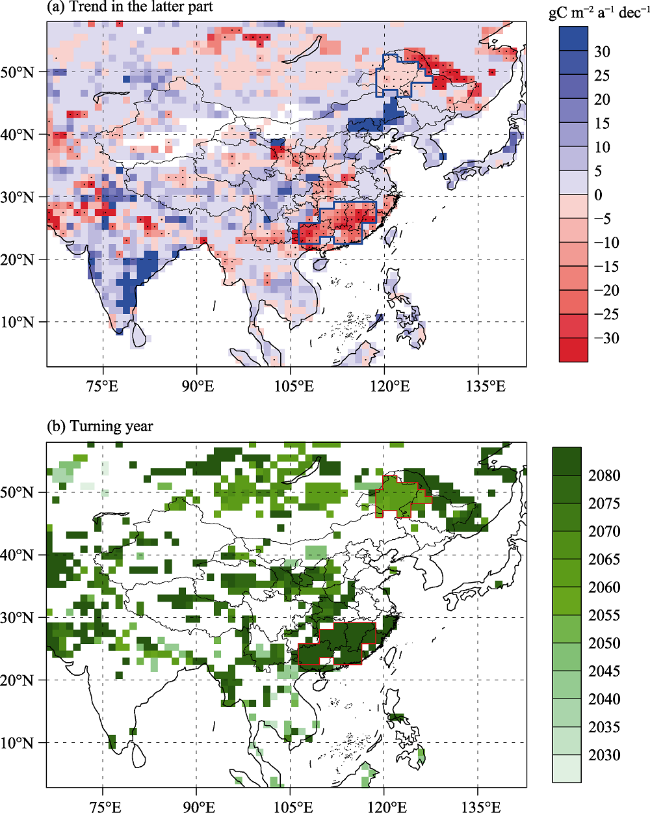
Figure 4 (a) The NPP changing trend in the latter part of the 21st century (gC m-2 a-1 dec-1) (The dots indicate the trends that are significant at the 0.05 level.); (b) The corresponding turning years (Only grids with negative trends in (a) are shown. The boxes represent the identified risky regions.) |
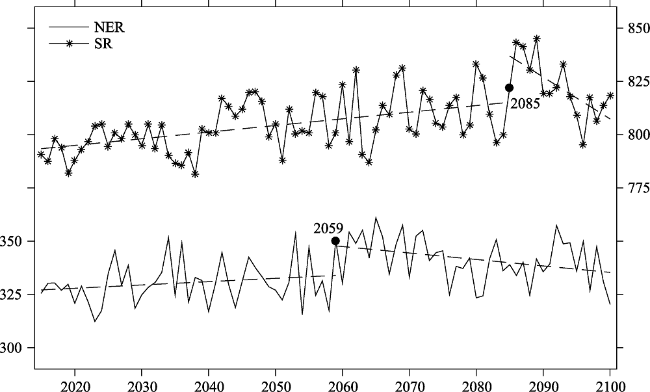
Figure 5 NPP series from 2015-2100 for NER and SR (The dashed lines are the linear fit before and after the turning years.) |
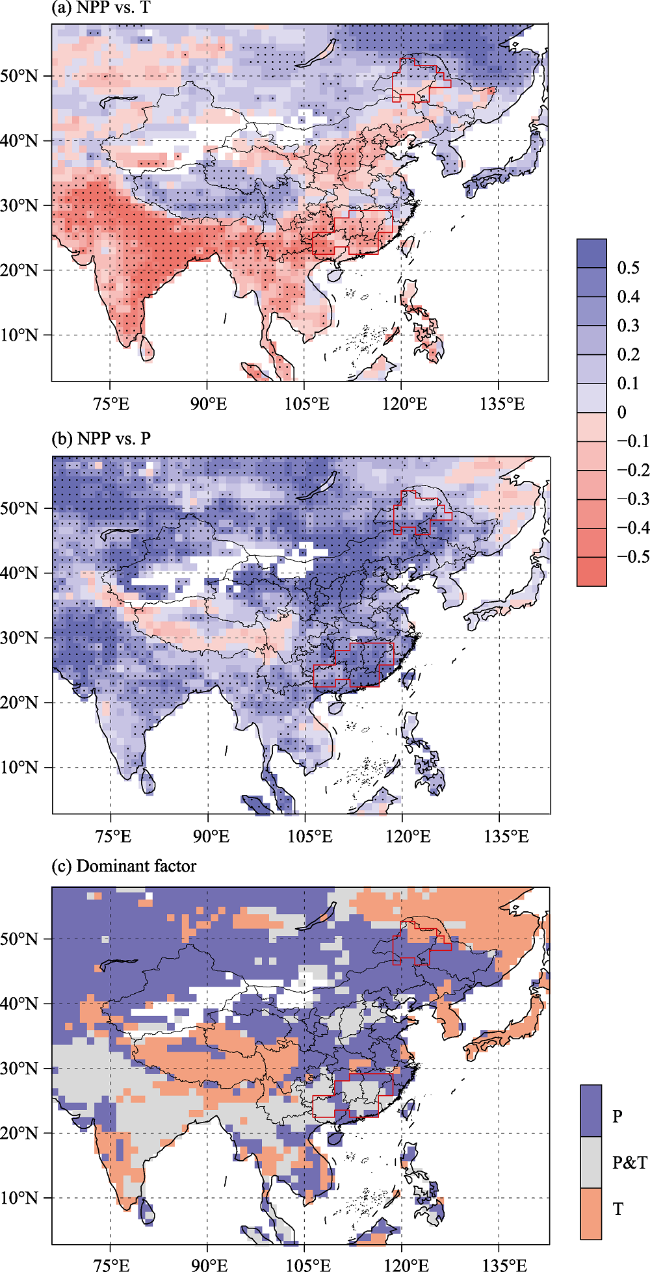
Figure 6 Temporal correlation coefficients from 2015-2100 between (a) temperature and NPP; (b) precipitation and NPP (The dots indicate the coefficients that are significant at the 0.05 level.); (c) The dominant climate factor that influences NPP (Yellow represents temperature. Blue represents precipitation. Gray represents both.) |
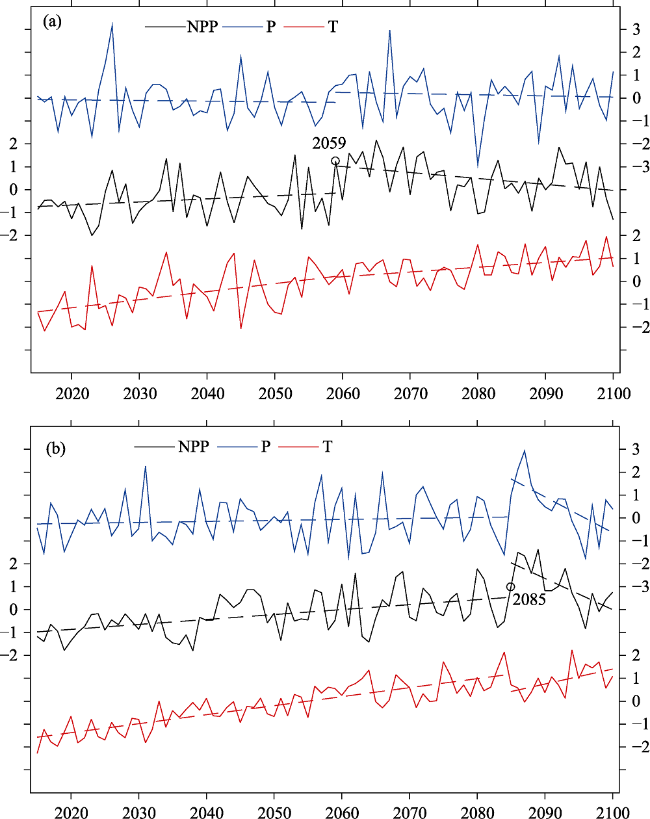
Figure 7 Comparison between NPP and climate variables for (a) NER and (b) SR (The series are standardized. The dashed lines are the linear fit before and after the turning years.) |
Table 1 The correlation parameter r between NPP and detrended climate factors in NER before and after bias correction (Values in blankets are significant levels.) |
| Before | After | |
|---|---|---|
| NPP-T | 0.06 (0.57) | 0.18 (0.10) |
| NPP-P | 0.38 (0.00) | 0.23 (0.03) |
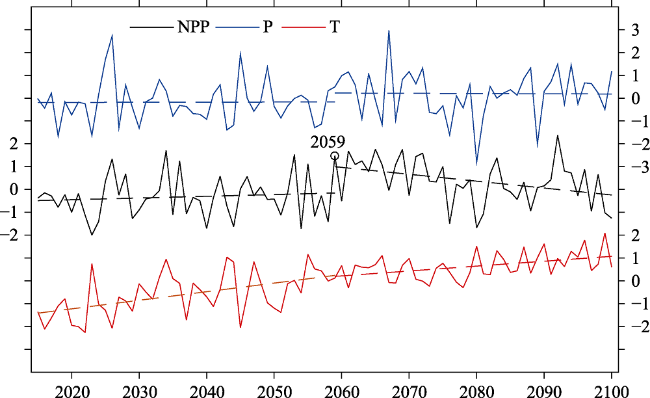
Figure 8 Same as Figure 7a but with non-corrected BCC-CSM2 data |
| [1] |
|
| [2] |
|
| [3] |
|
| [4] |
|
| [5] |
|
| [6] |
|
| [7] |
|
| [8] |
|
| [9] |
|
| [10] |
|
| [11] |
|
| [12] |
|
| [13] |
|
| [14] |
|
| [15] |
|
| [16] |
|
| [17] |
|
| [18] |
|
| [19] |
|
| [20] |
|
| [21] |
|
| [22] |
|
| [23] |
|
| [24] |
|
| [25] |
|
| [26] |
|
| [27] |
|
| [28] |
|
| [29] |
|
| [30] |
|
| [31] |
|
| [32] |
|
| [33] |
|
| [34] |
|
/
| 〈 |
|
〉 |