
Journal of Geographical Sciences >
Ecosystem service valuation of bays in East China Sea and its response to sea reclamation activities
|
Liu Ruiqing, Master Candidate, specialized in coastal ecology and land use change. E-mail: liuruiqingwh@163.com |
Received date: 2019-12-17
Accepted date: 2020-04-18
Online published: 2020-09-25
Supported by
NSFC-Zhejiang Joint Fund for the Integration of Industrialization and Informatization(U1609203)
National Natural Science Foundation of China(41976209)
National Natural Science Foundation of China(71874091)
Natural Science Foundation of Zhejiang Province(LQ15D020001)
Scientific Research Foundation of Graduate School of Ningbo University(G19077)
Copyright
Ecosystem service values (ESVs) of bays and their response to sea reclamation are of great practical importance for forming bay eco-compensation policy and extension of blue economic space. Based on land use information of bays collected during the period of 1990-2015, the spatiotemporal evolution of ESVs of 12 main bays in East China Sea and their response to sea reclamation activities over the past 25 years were quantitatively analyzed. The analysis results indicate that ESVs of bays in East China Sea showed a continuous downward trend and the whole ecosystem was continuously degraded, in which the degradation degree of ESV in the southern bays was higher than that in the northern bays. Spatial zoning of ESVs of bays in East China Sea was remarkable, showing a continuous downward trend from low-value to high-value zone. Spatial variation of ESVs of each bay was also significant, expanding from a city and from inland to the coast, which suggests that human activities, mainly reclamation, have become main agents for ESV evolution of bays in East China Sea. ESVs of bays have a significant response to sea reclamation, manifested as a significant negative correlation between ESV and reclamation intensity. The correlation in the southern bays was stronger than that in the northern bays, which was caused by different effects of sea reclamation modes on ESV evolution of muddy and bedrock bays. A negative effect of sea reclamation activities on bay ecosystem was hysteretic. Therefore, an attention should be paid to dynamic monitoring and early warning of development status in offshore areas, ecosystem-level reclamation control policy, and coastal wetland reserves planning. Moreover, the spatial coupling mechanism study between bay ecosystem service demand and its service supply capacity should be strengthened to realize systematic regulation of bay ecological security pattern.
Key words: reclamation; ecosystem service value; correlation analysis; bay; East China Sea
LIU Ruiqing , XU Hao , LI Jialin , PU Ruiliang , SUN Chao , CAO Luodan , JIANG Yimei , TIAN Peng , WANG Lijia , GONG Hongbo . Ecosystem service valuation of bays in East China Sea and its response to sea reclamation activities[J]. Journal of Geographical Sciences, 2020 , 30(7) : 1095 -1116 . DOI: 10.1007/s11442-020-1772-1
Figure 1 Geographic location of the study area (a) and distribution of land-use types in 2015 (b) |
Table 1 Ecosystem service value coefficient (104 RMB/km2/yr) |
| Ecosystem classification | Supply service | Regulating service | Supporting service | Cultural service | Total | ||||||
|---|---|---|---|---|---|---|---|---|---|---|---|
| Ecosystem types | Corresponding land types | Food production | Raw material production | Gas regulation | Climate regulation | Hydrological regulation | Environment purification | Soil conservation | Bio- diversity maintenance | Aesthetic landscape | |
| Forest | Woodland | 20.40 | 59.88 | 14.26 | 67.99 | 51.76 | 39.04 | 194.33 | 83.35 | 39.48 | 570.48 |
| Grassland | Grassland | 26.98 | 4.17 | 6.36 | 25.00 | 4.17 | 35.09 | 52.86 | 78.96 | 7.90 | 241.48 |
| Waters | Waters | 16.89 | 2.41 | 1.32 | 14.91 | 2697.32 | 2.19 | 4.83 | 19.08 | 87.07 | 2846.03 |
| Wetland | Marshes/ Tidal flat/ Mangrove forests | 6.58 | 1.54 | 39.48 | 375.05 | 339.96 | 398.74 | 37.51 | 54.83 | 121.73 | 1375.42 |
| Desert/ bare land | Unused land | 0.00 | 0.22 | 3.73 | 2.63 | 0.00 | 0.22 | 0.00 | 1.54 | 0.44 | 8.77 |
| Farmland | Cultivated land | 21.93 | 2.19 | 2.85 | 21.93 | 2.85 | 3.73 | 37.29 | 21.93 | 1.32 | 116.02 |
Table 2 Intensity grades of sea reclamation |
| PD value (hm2/km) | Strength grade | Meaning |
|---|---|---|
| 0≤PD<10 | Grade 1 | Sea reclamation pressure is light and development potential is great. |
| 10≤PD<20 | Grade 2 | Sea reclamation pressure is low with a certain development potential. |
| 20≤PD<50 | Grade 3 | Certain sea reclamation pressure exists with a certain effect on the subsequent development. |
| 50≤PD<100 | Grade 4 | Sea reclamation pressure is strong and attention should be paid to conservation and intensive use of sea reclamation areas. |
| PD≥100 | Grade 5 | Sea reclamation pressure is very strong. No new sea reclamation projects should be added, and when necessary, it can be conducted based on the existing sea reclamation projects. |
Table 3 Dynamic change of ESV of the northern / southern bays in East China Sea |
| ESV (108 RMB) | 1990 | 1995 | 2000 | 2005 | 2010 | 2015 | 1990-2000 | 2000-2010 | 1990-2015 | |||
|---|---|---|---|---|---|---|---|---|---|---|---|---|
| Variation (108 RMB) | Rate of change (%) | Variation (108 RMB) | Rate of change (%) | Variation (108 RMB) | Rate of change (%) | |||||||
| Northern bays in East China Sea | 781.83 | 790.23 | 817.79 | 822.74 | 834.80 | 724.35 | 35.96 | 4.60 | 17.01 | 2.08 | -57.49 | -7.35 |
| Southern bays in East China Sea | 488.21 | 488.16 | 464.62 | 456.44 | 429.47 | 389.50 | -23.59 | -4.83 | -35.15 | -7.57 | -98.71 | -20.22 |
| Total | 1270.04 | 1278.38 | 1282.41 | 1279.17 | 1264.27 | 1113.84 | 12.37 | 0.97 | -18.14 | -1.41 | -156.20 | -12.30 |
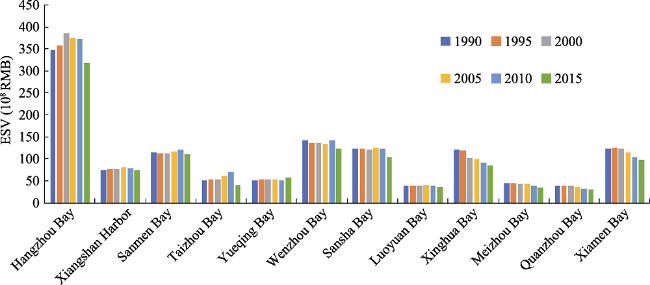
Figure 2 ESVs in the bays in East China Sea during the period 1990-2015 |
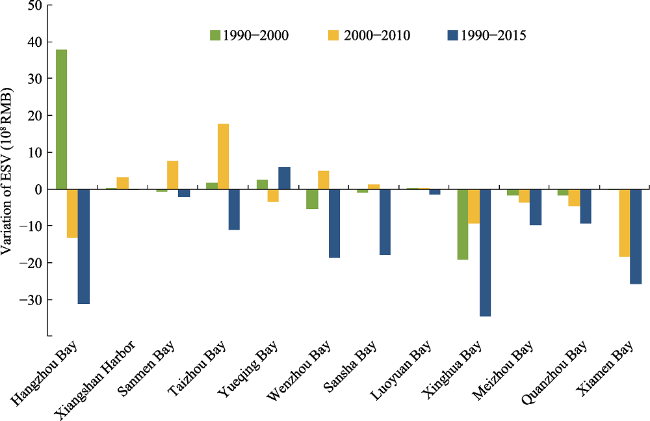
Figure 3 The variation of ESVs in the bays in East China Sea during the period 1990-2015 |
Table 4 Changes of ESV of various ecosystems in the bays in East China Sea |
| Ecosystem types | 1990 | 1995 | 2000 | 2005 | 2010 | 2015 | Variation (108 RMB) | Rate of change (%) | |
|---|---|---|---|---|---|---|---|---|---|
| Northern bays | Forest | 270.45 | 275.50 | 275.01 | 273.00 | 270.10 | 269.54 | -0.91 | -0.34 |
| Grassland | 8.94 | 8.73 | 9.28 | 9.18 | 9.30 | 9.84 | 0.90 | 10.07 | |
| Waters | 179.63 | 206.90 | 254.04 | 301.36 | 375.24 | 296.27 | 116.64 | 64.94 | |
| Wetland | 201.55 | 182.73 | 162.19 | 132.72 | 77.95 | 49.22 | -152.33 | -75.58 | |
| Desert/bare land | 0.00 | 0.01 | 0.00 | 0.00 | 0.00 | 0.00 | 0.00 | -54.53 | |
| Farmland | 121.25 | 116.35 | 117.27 | 106.47 | 102.19 | 99.47 | -21.78 | -17.96 | |
| Total | 781.83 | 790.23 | 817.78 | 822.74 | 834.80 | 724.35 | -57.48 | -7.35 | |
| Southern bays | Forest | 182.96 | 185.68 | 187.02 | 186.21 | 184.78 | 185.03 | 2.07 | 1.13 |
| Grassland | 22.30 | 21.63 | 21.78 | 20.66 | 20.65 | 20.64 | -1.66 | -7.44 | |
| Waters | 175.49 | 182.94 | 160.74 | 171.54 | 159.85 | 129.72 | -45.77 | -26.08 | |
| Wetland | 69.72 | 61.46 | 58.33 | 45.27 | 33.19 | 25.96 | -43.76 | -62.77 | |
| Desert/bare land | 0.01 | 0.01 | 0.01 | 0.01 | 0.01 | 0.01 | 0.00 | 0.00 | |
| Farmland | 37.71 | 36.44 | 36.75 | 32.76 | 30.99 | 28.14 | -9.57 | -25.38 | |
| Total | 488.21 | 488.15 | 464.61 | 456.44 | 429.46 | 389.48 | -98.73 | -20.22 | |
| Total | Forest | 453.41 | 461.18 | 462.03 | 459.21 | 454.88 | 454.57 | 1.16 | 0.26 |
| Grassland | 31.24 | 30.36 | 31.06 | 29.84 | 29.95 | 30.48 | -0.76 | -2.43 | |
| Waters | 355.12 | 389.84 | 414.78 | 472.90 | 535.09 | 425.99 | 70.87 | 19.96 | |
| Wetland | 271.27 | 244.19 | 220.52 | 177.99 | 111.14 | 75.18 | -196.09 | -72.29 | |
| Desert/bare land | 0.01 | 0.02 | 0.01 | 0.01 | 0.01 | 0.01 | 0.00 | -8.33 | |
| Farmland | 158.96 | 152.79 | 154.02 | 139.23 | 133.18 | 127.61 | -31.35 | -19.72 | |
| Total | 1270.04 | 1278.38 | 1282.39 | 1279.18 | 1264.26 | 1113.83 | -156.21 | -12.30 |
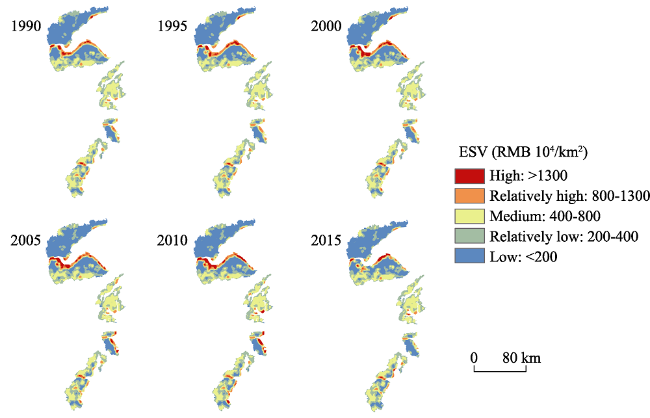
Figure 4 The spatial differentiation of ESV in the northern bays in East China Sea |
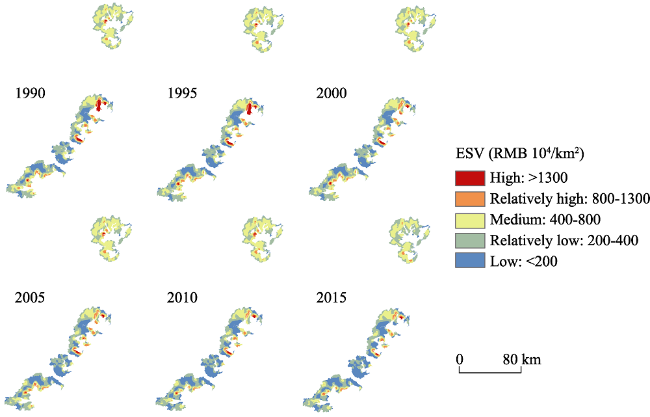
Figure 5 The spatial differentiation of ESV in the southern bays in East China Sea |
Table 5 The intensity grade of reclamation in the bays in East China Sea |
| Northern bays | Grade of reclamation intensity at early stage of study | Grade of reclamation intensity at late stage of study | Southern bays | Grade of reclamation intensity at early stage of study | Grade of reclamation intensity at late stage of study |
|---|---|---|---|---|---|
| Hangzhou Bay | Grade 3 | Grade 5 | Sansha Bay | Grade 2 | Grade 3 |
| Xiangshan Harbor | Grade 1 | Grade 2 | Luoyuan Bay | Grade 1 | Grade 3 |
| Sanmen Bay | Grade 1 | Grade 3 | Xinghua Bay | Grade 1 | Grade 3 |
| Taizhou Bay | Grade 1 | Grade 5 | Meizhou Bay | Grade 1 | Grade 3 |
| Yueqing Bay | Grade 1 | Grade 3 | Quanzhou Bay | Grade 1 | Grade 1 |
| Wenzhou Bay | Grade 1 | Grade 4 | Xiamen Bay | Grade 1 | Grade 3 |
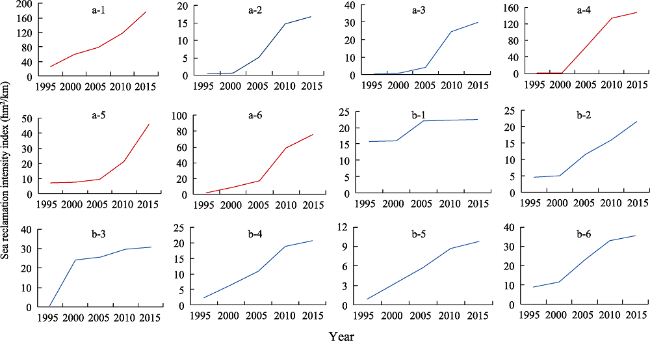
Figure 6 The change of the reclamation intensity in the bays in East China Sea (Note: a - Northern bays in East China Sea, and a - 1 to 6 are Hangzhou Bay, Xiangshan Harbor, Sanmen Bay, Taizhou Bay, Yueqing Bay and Wenzhou Bay in turn. b - Southern Bay in East China Sea, and b - 1 to 6 are Sansha Bay, Luoyuan Bay, Xinghua Bay, Meizhou Bay, Quanzhou Bay and Xiamen Bay in turn. The curves of the bays where sea reclamation intensity exceeded 40 hm2/km were marked in red.) |
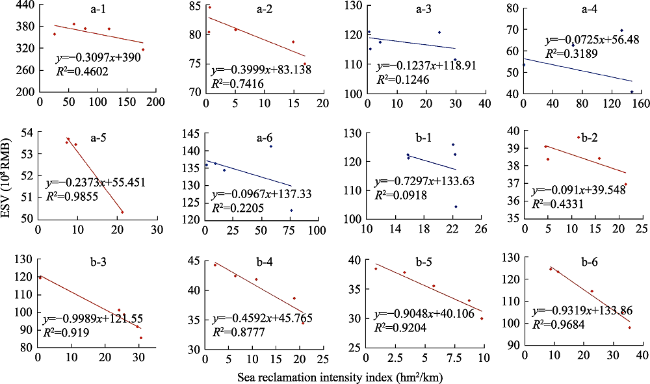
Figure 7 Relationship between sea reclamation intensity and ESV of the bays in East China Sea (Note: a - Northern bays in East China Sea, and a - 1 to 6 is Hangzhou Bay, Xiangshan Harbor, Sanmen Bay, Taizhou Bay, Yueqing Bay and Wenzhou Bay in turn. b - Southern bays of East China Sea, and b - 1 to 6 is Sansha Bay, Luoyuan Bay, Xinghua Bay, Meizhou Bay, Quanzhou Bay and Xiamen Bay in turn. Marked in red indicates high correlation.) |
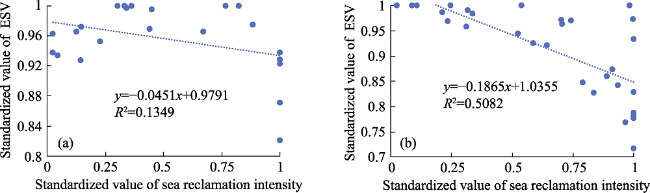
Figure 8 Correlations between sea reclamation intensity and ESV of the bays in East China Sea(Note: a - Northern bays in East China Sea, b - Southern bays in East China Sea) |
| [1] |
|
| [2] |
|
| [3] |
|
| [4] |
|
| [5] |
|
| [6] |
|
| [7] |
|
| [8] |
|
| [9] |
|
| [10] |
|
| [11] |
|
| [12] |
|
| [13] |
Editorial Board of China Bay Survey (EBCBS), 1993. Annals of Chinese Estuaries. Beijing: China Ocean Press. (in Chinese)
|
| [14] |
|
| [15] |
|
| [16] |
|
| [17] |
|
| [18] |
|
| [19] |
|
| [20] |
|
| [21] |
|
| [22] |
|
| [23] |
|
| [24] |
|
| [25] |
|
| [26] |
|
| [27] |
|
| [28] |
|
| [29] |
|
| [30] |
Millennium Ecosystem Assessment Board (MEAB), 2005. Ecosystem and Human Well-being: Synthesis. Washington, DC: Island Press.
|
| [31] |
|
| [32] |
|
| [33] |
|
| [34] |
|
| [35] |
|
| [36] |
|
| [37] |
|
| [38] |
|
| [39] |
|
| [40] |
|
| [41] |
|
| [42] |
|
| [43] |
|
| [44] |
|
| [45] |
|
| [46] |
|
| [47] |
|
| [48] |
|
| [49] |
|
| [50] |
|
| [51] |
|
| [52] |
|
| [53] |
|
| [54] |
|
/
| 〈 |
|
〉 |
