
Journal of Geographical Sciences >
Mega-towns in China: Their spatial distribution features and growth mechanisms
|
Wang Xueqin, PhD Candidate, specialized in urban geography and population geography. E-mail: wangxq.16b@igsnrr.ac.cn |
Received date: 2019-08-28
Accepted date: 2020-01-10
Online published: 2020-09-25
Supported by
Strategic Priority Research Program of the Chinese Academy of Sciences(XDA19040402)
National Natural Science Foundation of China(41771180)
National Natural Science Foundation of China(41661144023)
National Natural Science Foundation of China(41701165)
Copyright
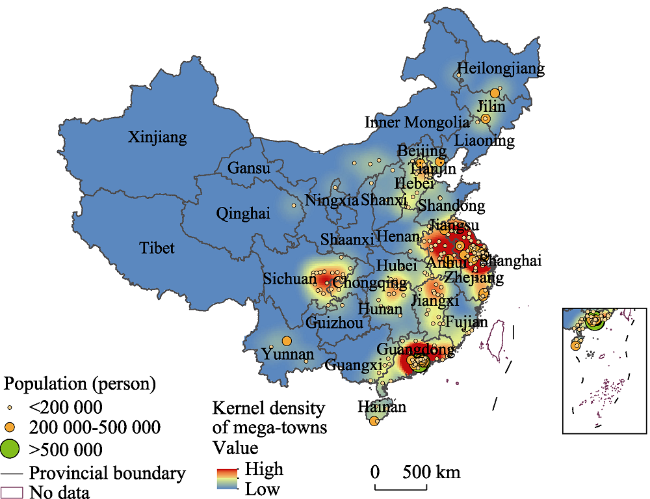
As a special outcome of urbanization, mega-towns not only play an important role in the process of socio-economic development, but also are important contributors to urbanization. Based on a spatial database of mega-towns in China, this paper explores the spatial distribution features and growth mechanisms of China’s 238 mega-towns using the nearest neighbour distance method, kernel density estimation, regression analysis, global autocorrelation, local autocorrelation and other spatial analysis methods. Results of spatial distribution features show that: (1) on the national scale, the existing 238 mega-towns mainly gathered in the southeast coastal areas of China; they formed two spatial core agglomerations, several secondary ones and a southeast coastal agglomeration belt; (2) on the regional scale, each economic region’s index was less than 1, indicating that mega-towns in each region tended to be spatially agglomerated due to the close relationship with regional development level and their number; (3) on the provincial scale, 68% of provincial-level units in China tended to be a spatial agglomeration of mega-towns; only one province had a random distribution; the number of mega-towns in those evenly-distributed provinces was generally small. The growth of mega-towns was determined by a combination of various natural and humanistic factors, including topography, location, economy, population, traffic, and national policy. This paper chose digital elevation model (DEM), location advantage, economic density, population density, and highway density distribution as corresponding indicators as quantitative factors. By combining their local autocorrelation analysis, these factors all showed certain influence on the spatial growth of mega-towns and together scheduled it. In the future, provinces and cities should make full use of the mega-town functions to promote their socioeconomic development, especially the central and western regions in China.
Key words: mega-town; features; spatial distribution; growth mechanism; China
WANG Xueqin , LIU Shenghe , QI Wei . Mega-towns in China: Their spatial distribution features and growth mechanisms[J]. Journal of Geographical Sciences, 2020 , 30(7) : 1060 -1082 . DOI: 10.1007/s11442-020-1770-3
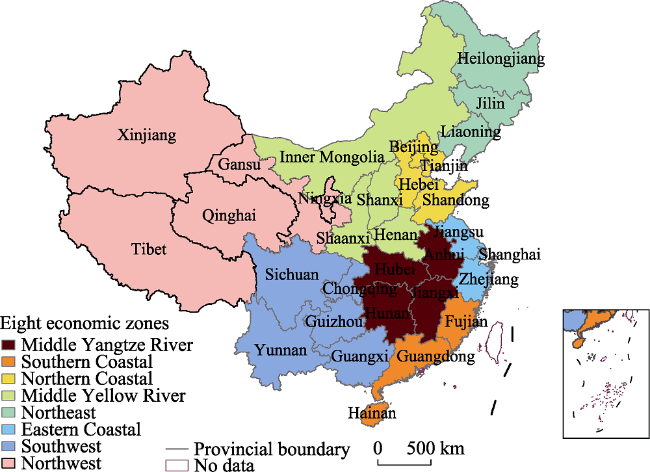
Figure 1 Divisions of administrative units and economic zones in China |
Table 1 China's mega-towns listed by scale hierarchies in 2015 |
| Mega-town | Inhabitants (person) | Number | List |
|---|---|---|---|
| Medium city level | ≥500,000 | 2 | Chang'an Omitted, Humen Town |
| Type-I small city level | 200,000-500,000 | 37 | Tangxia Town, Houjie Town, Liaobu Town, Changping Town, Dachang Town, Xiaolan Town, Fenggang Town, Dalang Town, Qingxi Town, Qibao Town, Xinzhuang Town, Xucheng Town, Taihu Lake New Town, Dalingshan Town, Longgang Town, Yangshe Town, Yushan Town, Beiqijia Town, Suicheng Town, Tianya Town, Zhili Town, Shijie Town, Nanqiao Town, Qian'an Town, Huangjiang Town, Gucun Town, Sanlin Town, Meilong Town, Wucheng Town, Wuchang Town, Gaobu Town, Jiuting Town, Tangxia Town, Hengli Town, Licheng Town, Shishan Town |
| Type-II small city level | 100,000-200,000 | 199 | Omitted |
Figure 2 Spatial distributions of China's mega-towns in 2015 |
Table 2 Socio-economic situation of eight comprehensive economic zones in 2015 |
| Regions | GDP (billion) | Urbanization rate (%) | Inhabitants (billion) |
|---|---|---|---|
| Eastern Coastal Area | 13812.6 | 73.3 | 159.3 |
| Northern Coastal Area | 13236.1 | 69.4 | 209.9 |
| Southern Coastal Area | 10249.5 | 62.1 | 156.0 |
| Middle Yangtze River | 9718.2 | 52.5 | 233.5 |
| Southwest Area | 8669.5 | 48.2 | 242.9 |
| Middle Yellow River | 8562.2 | 54.0 | 194.5 |
| Northeast Area | 5781.6 | 60.5 | 109.5 |
| Northwest Area | 2247.0 | 44.8 | 65.4 |
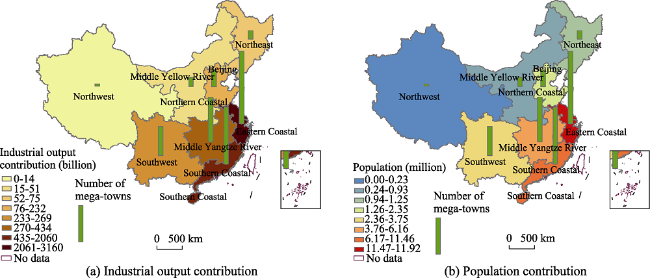
Figure 3 Mega-towns' contribution to eight economic zones of China in 2015 |
Table 3 Regional nearest neighbour distance index r of China's mega-towns in 2015 |
| Region | Number of mega-towns | r | Region | Number of mega-towns | r |
|---|---|---|---|---|---|
| Eastern Coastal Area | 72 | 0.83 | Southwest Area | 29 | 0.70 |
| Northern Coastal Area | 17 | 0.71 | Middle Yellow River | 9 | 0.70 |
| Southern Coastal Area | 57 | 0.82 | Northeast Area | 8 | 0.69 |
| Middle Yangtze River | 44 | 0.84 | Northwest Area | 2 | 0.64 |
Table 4 Provincial nearest neighbour distance index r of China's mega-towns in 2015 |
| Province-level region | Number of mega-towns | r | Distribution mode | Province-level region | Number of mega-towns | r | Distribution mode |
|---|---|---|---|---|---|---|---|
| Beijing | 1 | 0.00 | agglomeration | Guangdong | 48 | 0.83 | agglomeration |
| Guizhou | 1 | 0.00 | agglomeration | Jiangxi | 13 | 0.86 | agglomeration |
| Liaoning | 1 | 0.00 | agglomeration | Hunan | 9 | 0.87 | agglomeration |
| Ningxia | 1 | 0.00 | agglomeration | Tianjin | 3 | 0.89 | agglomeration |
| Qinghai | 1 | 0.00 | agglomeration | Heilongjiang | 3 | 0.95 | agglomeration |
| Shaanxi | 1 | 0.00 | agglomeration | Anhui | 15 | 1 | random |
| Shandong | 2 | 0.07 | agglomeration | Yunnan | 3 | 1.08 | uniform |
| Inner Mongolia | 3 | 0.38 | agglomeration | Jiangsu | 35 | 1.15 | uniform |
| Guangxi | 5 | 0.63 | agglomeration | Henan | 3 | 1.18 | uniform |
| Jilin | 4 | 0.64 | agglomeration | Hebei | 11 | 1.32 | uniform |
| Hubei | 7 | 0.70 | agglomeration | Hainan | 4 | 1.41 | uniform |
| Sichuan | 18 | 0.70 | agglomeration | Shanxi | 2 | 2.15 | uniform |
| Chongqing | 2 | 0.71 | agglomeration | Gansu | 0 | — | — |
| Zhejiang | 14 | 0.72 | agglomeration | Tibet | 0 | — | — |
| Shanghai | 23 | 0.75 | agglomeration | Xinjiang | 0 | — | — |
| Fujian | 5 | 0.81 | agglomeration | China | 238 | 0.48 | agglomeration |
Note: Hong Kong, Macao, and Taiwan were omitted due to a lack of data. |
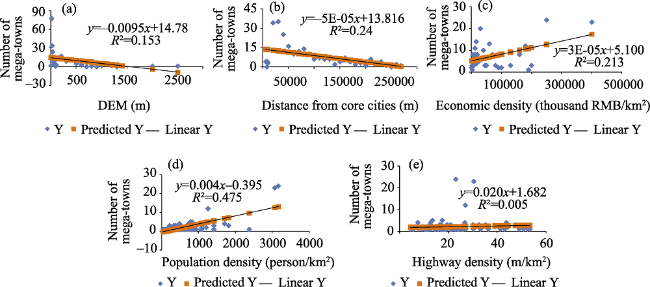
Figure 4 Line fit plot of various influencing factors on the number of mega-towns (Y) in 2015 |
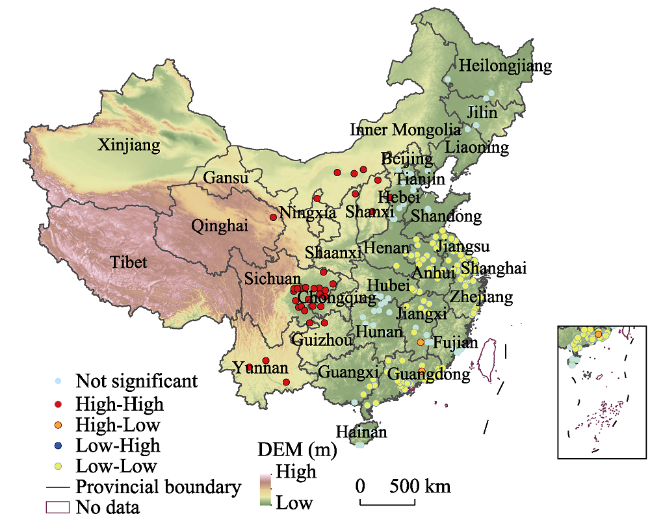
Figure 5 Local autocorrelation analysis of DEM in China in 2015 |
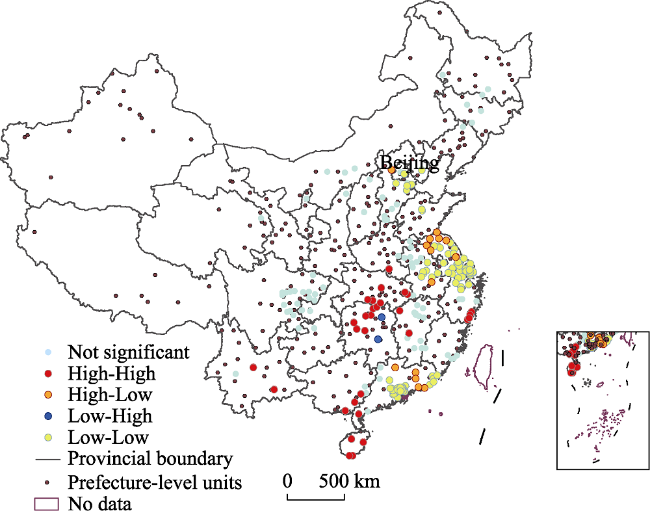
Figure 6 Local autocorrelation analysis of location in China in 2015 |
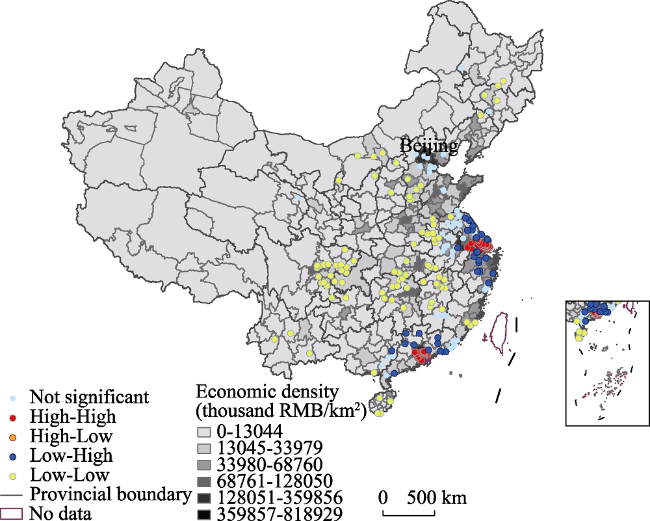
Figure 7 Local autocorrelation analysis of economic density in China in 2015 |
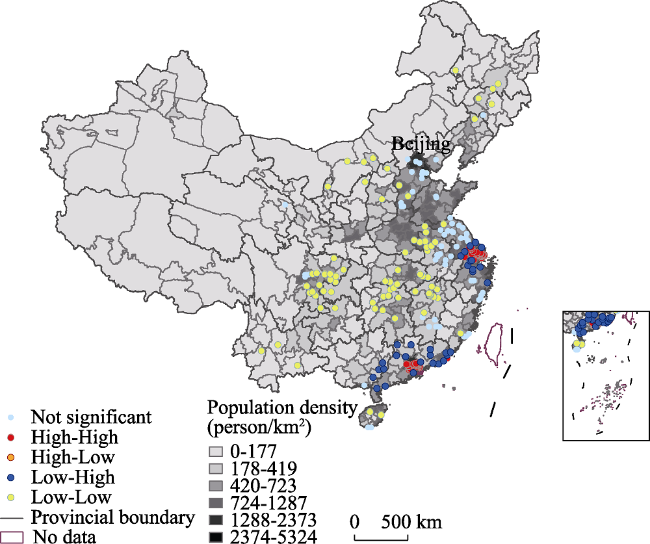
Figure 8 Local autocorrelation analysis of population density in China in 2015 |
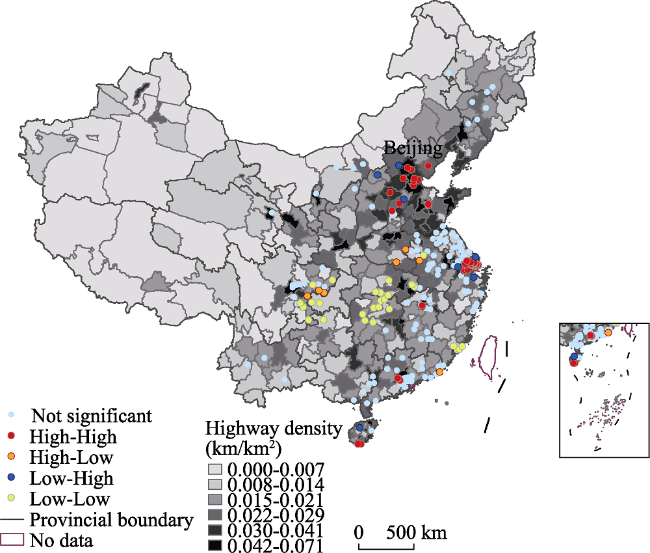
Figure 9 Local autocorrelation analysis of highway density in China in 2015 |
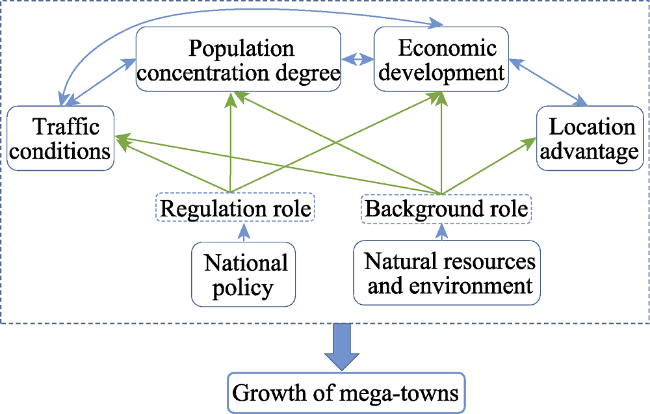
Figure 10 Growth mechanisms of China's mega-towns |
| [1] |
|
| [2] |
|
| [3] |
|
| [4] |
|
| [5] |
|
| [6] |
|
| [7] |
|
| [8] |
|
| [9] |
|
| [10] |
|
| [11] |
European Foundation, 1994. Visions and actions for medium-size cities: Reports from the European Workshops of Alicante, Volos and Oviedo. European foundation for the improvement of living and working conditions. Luxemburg.
|
| [12] |
|
| [13] |
|
| [14] |
|
| [15] |
|
| [16] |
|
| [17] |
|
| [18] |
|
| [19] |
|
| [20] |
|
| [21] |
|
| [22] |
National Development and Reform Commission (NDRC), 2015. National Report on the New Urbanization in 2015. (in Chinese)
|
| [23] |
|
| [24] |
|
| [25] |
|
| [26] |
|
| [27] |
|
| [28] |
|
| [29] |
|
| [30] |
|
| [31] |
|
| [32] |
|
| [33] |
United Nations (UN), 2018. World Urbanization Prospects: The 2018 Revision. New York: United Nations.
|
| [34] |
|
| [35] |
|
| [36] |
|
| [37] |
|
| [38] |
|
| [39] |
|
| [40] |
|
/
| 〈 |
|
〉 |