
Journal of Geographical Sciences >
Effects of land use and cultivation time on soil organic and inorganic carbon storage in deep soils
|
Yu Xia (1988–), PhD Candidate, specialized in environmental science. E-mail: yuxia@ieecas.cn |
Received date: 2019-09-20
Accepted date: 2020-03-05
Online published: 2020-08-25
Supported by
The Strategic Priority Research Program of the Chinese Academy of Sciences(No.XDB40000000)
National Natural Science Foundation of China(No.41730108)
National Natural Science Foundation of China(No.41773141)
National Natural Science Foundation of China(No.41573136)
National Natural Science Foundation of China(No.41991252)
National Research Program for Key Issues in Air Pollution Control(No.DQGG0105-02)
Copyright
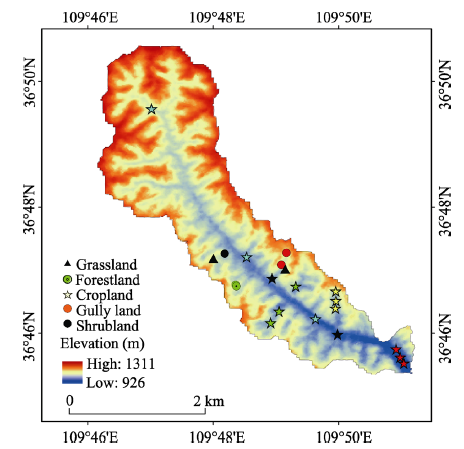
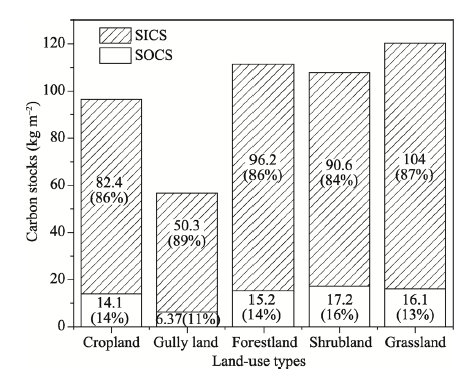
The vertical distribution and exchange mechanisms of soil organic and inorganic carbon (SOC, SIC) play an important role in assessing carbon (C) cycling and budgets. However, the impact of land use through time for deep soil C (below 100 cm) is not well known. To investigate deep C storage under different land uses and evaluate how it changes with time, we collected soil samples to a depth of 500 cm in a soil profile in the Gutun watershed on the Chinese Loess Plateau (CLP); and determined SOC, SIC, and bulk density. The magnitude of SOC stocks in the 0-500 cm depth range fell into the following ranking: shrubland (17.2 kg m-2) > grassland (16.3 kg m-2) > forestland (15.2 kg m-2) > cropland (14.1 kg m-2) > gully land (6.4 kg m-2). The ranking for SIC stocks were: grassland (104.1 kg m-2) > forestland (96.2 kg m-2) > shrubland (90.6 kg m-2) > cropland (82.4 kg m-2) > gully land (50.3 kg m-2). Respective SOC and SIC stocks were at least 1.6- and 2.1-fold higher within the 100-500 cm depth range, as compared to the 0-100 cm depth range. Overall SOC and SIC stocks decreased significantly from the 5th to the 15th year of cultivation in croplands, and generally increased up to the 70th year. Both SOC and SIC stocks showed a turning point at 15 years cultivation, which should be considered when evaluating soil C sequestration. Estimates of C stocks greatly depends on soil sampling depth, and understanding the influences of land use and time will improve soil productivity and conservation in regions with deep soils.
Key words: cultivation time; deep soil; Gutun watershed; land use; inorganic carbon; organic carbon
YU Xia , ZHOU Weijian , WANG Yunqiang , CHENG Peng , HOU Yaoyao , XIONG Xiaohu , DU Hua , YANG Ling , WANG Ya . Effects of land use and cultivation time on soil organic and inorganic carbon storage in deep soils[J]. Journal of Geographical Sciences, 2020 , 30(6) : 921 -934 . DOI: 10.1007/s11442-020-1762-3
Figure 1 Location of the study area and sampling points (n=21 profiles) under different land use types within the Gutun watershed. Cropland includes five restoration time frames: RC-5 (light blue star), RC-15 (light green star), RC-35 (yellow star), RC-60 (red star), RC-70 (black star). |
Table 1 Soil properties under five land-use types in the Gutun watershed on the Chinese Loess Plateau |
| Land-use type | Texture (%) | BD*(g cm-3) | SWC(g kg-1) | SOC(g kg-1) | SIC(g kg-1) | ||
|---|---|---|---|---|---|---|---|
| Sand | Silt | Clay | |||||
| Grassland | 19.2±3.8ab | 78.2±3.6a | 2.6±0.3bc | 1.3±0.1b | 126.0±20.3b | 2.96±2.22a | 16.77±3.00a |
| Shrubland | 19.7±3.0ab | 77.6±2.8a | 2.7±0.4bc | 1.3±0.1b | 92.8±47.5c | 2.76±1.75ab | 13.79±2.40bc |
| Forestland | 22.3±4.5a | 75.4±4.3a | 2.3±0.4c | 1.3±0.1b | 71.7±19.4c | 2.58±1.22ab | 14.82±1.81ab |
| Cropland | 22.1±5.4a | 75.1±5.0a | 2.8±0.7b | 1.5±0.2ab | 177.2±51.6a | 2.04±1.10ab | 12.38±3.18c |
| Gully land | 18.6±4.2b | 78.2±3.8a | 3.2±0.6a | 1.4±0.1a | 197.7±31.0a | 1.84±1.29b | 14.22±2.65bc |
*BD, bulk density; SWC, soil water content; SOC, soil organic carbon; SIC, soil inorganic carbon. Different lowercase letters within columns indicate significant differences among land-use types. |
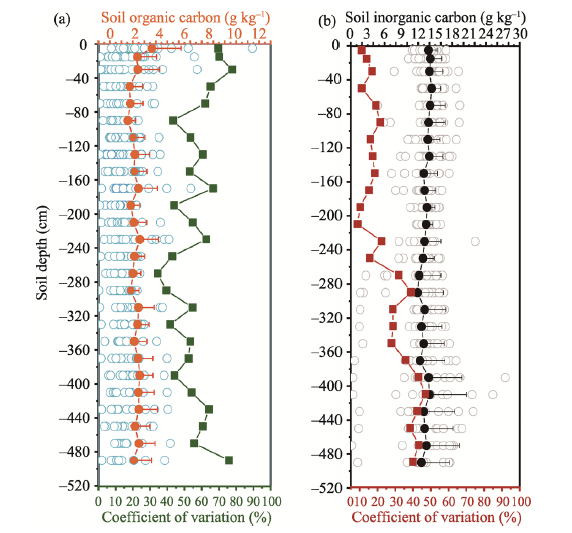
Figure 2 Vertical distribution of SOC and SIC along 500-cm deep soil profiles. (a) SOC content (open blue circles), means (closed red circles), and the coefficient of variations (green squares); (b) SIC content (open light grey circles), means (closed black circles), and the coefficient of variations (dark red squares) |
Table 2 Two-way ANOVA* F and p-values for land-use type, cultivation time, and soil depth effects on soil BD (g cm-3), SWC (g kg-1), SOC content (g kg-1), SIC content (g kg-1), SOC stocks (kg m-2), and SIC stocks (kg m-2) in Gutun watershed |
| Factor of variation | BD | SWC | SOC | SIC | SOCS | SICS | ||||||
|---|---|---|---|---|---|---|---|---|---|---|---|---|
| F | p | F | p | F | p | F | p | F | p | F | p | |
| Land-use types | 24.32 | 0.000 | 79.060 | 0.000 | 11.852 | 0.000 | 25.320 | 0.000 | 3.452 | 0.009 | 6.222 | 0.000 |
| Soil depth | 2.310 | 0.033 | 6.080 | 0.000 | 4.434 | 0.000 | 2.121 | 0.000 | 4.651 | 0.000 | 17.781 | 0.000 |
| Time | 112.59 | 0.000 | 36.283 | 0.000 | 18.082 | 0.000 | 31.666 | 0.000 | 21.867 | 0.000 | 13.365 | 0.000 |
Note: Analysis of variance; BD, bulk density; SWC, soil water content; SOC, soil organic carbon; SIC, soil inorganic carbon |
Table 3 Vertical distribution of SOC and SIC contents (g kg-1) under five land-use types |
| Depth (cm) | 0-20 | 20-60 | 60-100 | 100-200 | 200-300 | 300-400 | 400-500 | |
|---|---|---|---|---|---|---|---|---|
| SOC | Grassland | 7.26±4.56aA | 3.93±3.05aAB | 2.38±0.93aB | 2.51±1.12aB | 3.09±1.68aB | 2.27±0.61aB | 1.88±1.35bB |
| Shrubland | 3.79±1.52abA | 1.55±0.8aB | 1.07±0.2aB | 2.89±2.71aA | 2.71±1.25abA | 1.77±0.58aB | 4.40±1.33aA | |
| Forestland | 3.29±0.94abA | 2.90±1.57aA | 2.38±1.49aA | 2.08±0.89aA | 2.39±0.84abA | 3.19±1.61aA | 2.03±0.51bA | |
| Cropland | 2.52±1.25bA | 1.81±1.25aAB | 1.46±0.63aB | 1.99±1.05aAB | 1.89±0.86bAB | 2.34±1.07aAB | 2.22±1.30bAB | |
| Gully land | 1.68±1.27bA | 1.61±1.14aA | 2.03±1.57aA | 2.26±1.77aA | 1.42±0.39bA | |||
| SIC | Grassland | 14.97±1.39abB | 17.2±2.0abAB | 17.4±2.2abAB | 16.25±0.92aB | 14.18±1.86aB | 17.45±3.7aAB | 20.18±2.58aA |
| Shrubland | 16.91±0.01aA | 16.55±0.21aA | 16.45±0.07aA | 14.3±2.9abAB | 13.31±1.13aB | 13.21±1.01bB | 10.96±1.44bB | |
| Forestland | 14.27±1.37abA | 13.97±1.96abA | 14.42±1.61abA | 14.75±1.12abA | 14.57±1.20aA | 14.76±2.63aA | 17.01±0.53abA | |
| Cropland | 13.40±1.61bA | 13.39±1.44bA | 13.05±2.77bA | 12.68±1.69bA | 11.99±3.47aA | 11.52±4.16bA | 11.34±5.04bA | |
| Gully land | 15.10±1.40abA | 15.66±1.72abA | 14.91±1.07abA | 14.17±2.86abA | 11.88±3.68aA | |||
Note: different lowercase letters within columns indicate significant differences among land use types (p < 0.05); different uppercase letters within rows indicate significant differences among different soil layers in the same land-use type (p < 0.05). |
Table 4 Vertical distribution of SOC and SIC contents (g kg-1) from RC5 to RC70 croplands in Gutun watershed |
| Depth (cm) | 0-20 | 20-60 | 60-100 | 100-200 | 200-300 | 300-400 | 400-500 | |
|---|---|---|---|---|---|---|---|---|
| SOC | RC5 | 2.02±1aAB | 1.41±0.94bB | 1.63±0.78aAB | 2.35±0.96abAB | 1.87±0.35bcAB | 2.96±0.48abA | 2.6±0.77aAB |
| RC15 | 1.82±0.5bA | 1.51±1.82bA | 1.13±0.66aA | 1.45±0.88bA | 1.3±0.89cA | 1±0.76cA | 0.72±0.53bA | |
| RC35 | 3.3±0.83aA | 2.4±1.07aAB | 1.69±0.26aB | 2.12±0.43abAB | 2.34±0.53abAB | 2.49±0.43abAB | 2.9±1.5aAB | |
| RC60 | 2.61±1.96aA | 1.61±1.14bA | 1.4±0.75aA | 1.69±0.45bA | 1.79±0.6cA | 2.35±1.28bA | 2.03±1.31abA | |
| RC70 | 3.04±1.18aAB | 2.26±1.25aAB | 1.50±0.57aB | 2.66±1.90aAB | 3.03±1.02aAB | 3.45±0.77aA | ||
| SIC | RC5 | 11.95±1.41bA | 12.47±2.5aA | 12.66±2.9abA | 12.29±1.67bA | 13.56±1.45aA | 12.9±1.64aA | 12.75±2.99aA |
| RC15 | 14.07±2.21abA | 14.29±1.2aA | 14.31±1.11aA | 12.83±1bAB | 10.46±5.41aAB | 6.16±5.2bBC | 0.94±0.63bC | |
| RC35 | 13.64±0.37abA | 13.44±0.73aA | 14.39±1.09aA | 13.5±0.51bA | 13.12±1aA | 12.99±1.82aA | 14.13±3.16aA | |
| RC60 | 14.65±1.39aA | 13.52±0.93aAB | 13.32±0.83abAB | 13.17±0.94bAB | 12.33±0.9aB | 13.26±1.93aAB | 12.9±1.26aAB | |
| RC70 | 12.35±0.25abA | 13.13±0.82aA | 9.65±5.08bA | 16.43±3.24aA | 10.53±3.87aA | 13.09±1.48aA | ||
Note: different lowercase letters within columns indicate significant differences among five reclamation times (p < 0.05), while different uppercase letters indicate significant differences between different soil layers at the same reclamation time (p < 0.05). |
Figure 3 Percentage of SOC and SIC stocks in 0-500-cm soil profiles for five land-use types |
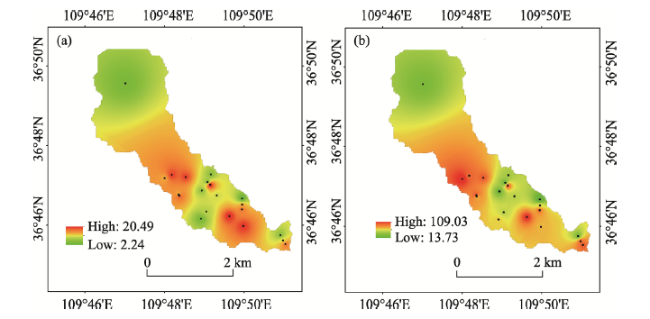
Figure 4 Spatial distribution of soil organic carbon stocks (a) and soil inorganic carbon stocks (b) in Gutun watershed |
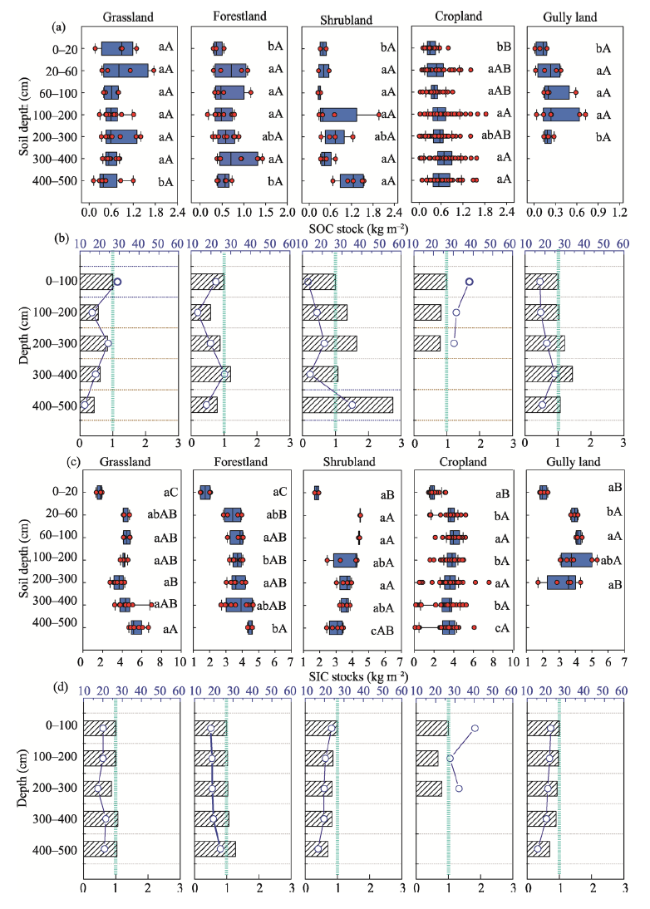
Figure 5 Soil carbon stocks. (a) SOC stock; (c) SIC stock. (b) and (d) showed the percentage within the bars are proportions of stocks in a 100-cm thick layer compared to the upper 100 cm. Blue circles represent the ratio of the carbon stocks in a given 100-cm layer to the 0-500 cm complete profile. Different lowercase letters indicate significant differences among land uses (p < 0.05), while uppercase letters indicate significant differences among different soil layers within the same land-use type (p < 0.05). |
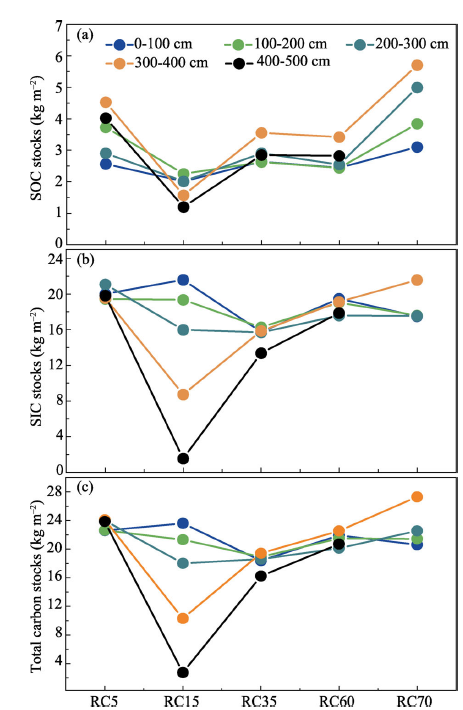
Figure 6 Changes in carbon stocks with time at different sub-layers: (a) SOC stocks, (b) SIC stocks, and (c) TC stocks at 100-cm intervals |
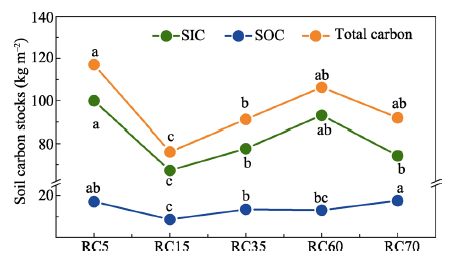
Figure 7 Changes in SOC, SIC, and TC stocks with time in 0-500 cm soil profiles |
| [1] |
|
| [2] |
|
| [3] |
|
| [4] |
|
| [5] |
|
| [6] |
|
| [7] |
|
| [8] |
|
| [9] |
|
| [10] |
|
| [11] |
|
| [12] |
|
| [13] |
|
| [14] |
|
| [15] |
|
| [16] |
|
| [17] |
|
| [18] |
|
| [19] |
|
| [20] |
|
| [21] |
|
| [22] |
|
| [23] |
|
| [24] |
|
| [25] |
|
| [26] |
|
| [27] |
|
| [28] |
|
| [29] |
|
| [30] |
|
| [31] |
|
| [32] |
|
| [33] |
|
| [34] |
|
| [35] |
|
| [36] |
|
| [37] |
|
| [38] |
|
| [39] |
|
| [40] |
|
| [41] |
|
| [42] |
|
| [43] |
|
| [44] |
|
| [45] |
|
| [46] |
|
| [47] |
|
| [48] |
|
/
| 〈 |
|
〉 |