
Journal of Geographical Sciences >
Accumulation phenomena in fluvial processes and the corresponding stochastic model
|
Jing Huan (1993–), PhD Candidate, specialized in river mechanics. E-mail: jingh16@mails.tsinghua.edu.cn |
Received date: 2019-12-03
Accepted date: 2020-02-08
Online published: 2020-08-25
Supported by
National Natural Science Foundation of China(No.91547204)
National Key Research and Development Program of China(No.2016YFC0402500)
National Key Research and Development Program of China(No.2017YFC0404303)
Copyright
Accumulation occurs widely in fluvial processes. Accurately accounting for the effects of previous water and sediment conditions on accumulation is essential for studying riverbed evolution. In this study, to reveal the physical mechanisms of accumulation, various geometric observations of both the upstream and downstream reaches of dams on several typical fluvial channels were analyzed. The changes in water and sediment conditions were defined as external disturbances. Assuming that the probability of an external disturbance conforms to a Poisson distribution, and that the response intensity induced by an individual disturbance decays exponentially over time, a mathematical description of the accumulation of internal responses to external disturbances is given. Furthermore, a corresponding theoretical model for simulating the spatiotemporal readjustments of characteristic river variables is proposed based on stochastic theory. The proposed models are then applied to investigate spatiotemporal readjustment in the upper and lower reaches of dams following their construction. The results indicate that temporally, the vertical, lateral, and overall readjustment rates of the reaches are relatively fast in the early period following dam construction but then decrease rapidly over time. Accumulated riverbed degradation, channel width, and sedimentation continuously increase until a new dynamic equilibrium is reached. These phenomena reflect the representative accumulation characteristics of fluvial processes. Spatially, the erosion intensities in downstream reaches decrease nonlinearly along the channel until eventually diminishing. The unbalanced spatial distribution of erosion intensity arises from the system response characterized by propagation in space but decay over time, which is characteristic of accumulation phenomena after disturbances. The results of the developed model show that the spatiotemporal readjustments of the studied cross-sections and channel reaches can be accurately described by the unified theoretical formula derived herein. The model predictions show good agreement with observed field data with determination coefficients of 0.92, 0.93, 0.76, and 0.95 for vertical, lateral, longitudinal, and overall readjustments, respectively. The proposed theoretical models account for both the accumulation characteristics of fluvial processes and their spatial distributions. In demonstrating the proposed approach, this study provides a theoretical basis and new calculation method for quantitatively describing the spatiotemporal readjustments of non-equilibrium fluvial channels following external disturbances.
JING Huan , ZHONG Deyu , ZHANG Hongwu , SHI Xufang , WANG Yanjun . Accumulation phenomena in fluvial processes and the corresponding stochastic model[J]. Journal of Geographical Sciences, 2020 , 30(6) : 1021 -1040 . DOI: 10.1007/s11442-020-1768-x
Table 1 Characteristic river parameters for the studied cross-sections and channel reaches (Williams and Wolman, 1987; Jia, 1992; Peng et al., 2016; Yang et al., 2017) |
| Project | River | Average pre- dam daily discharge (m3/s) | Average post- dam daily discharge (m3/s) | Studied cross-section or reach | Distance (km) | Variable | Survey period | Survey number |
|---|---|---|---|---|---|---|---|---|
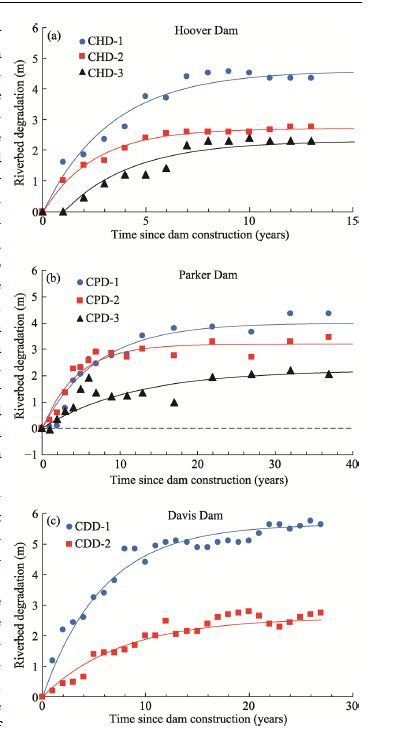
| Hoover | Colorado | 520 | 400 | CHD-1-CHD-3 | 10-36 | Riverbed degradation | 1935-1948 | 15 |
| Parker | 230 | 340 | CPD-1-CPD-3 | 39-95 | 1938-1975 | 16 | ||
| Davis | 400 | 340 | CDD-1-CDD-2 | 1-9 | 1948-1975 | 28 | ||
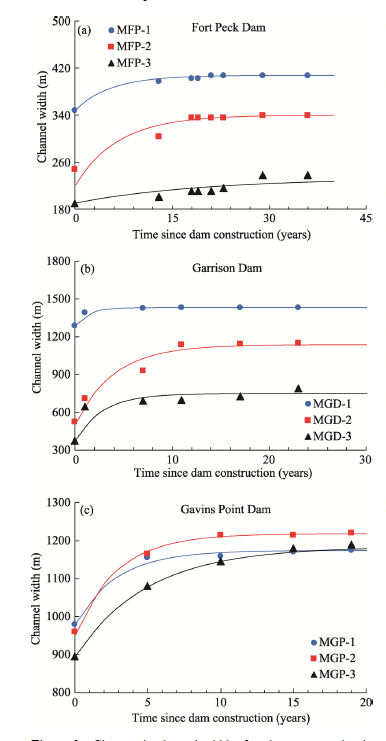
| Fort Peck | Missouri | 200 | 280 | MFP-1-MFP-3 | 9-75 | Channel width | 1936-1973 | 8 |
| Garrison | 600 | 660 | MGD-1-MGD-3 | 32-54 | 1949-1976 | 6 | ||
| Gavins Point | 930 | 740 | MGP-1-MGP-3 | 7-48 | 1955-1974 | 5 | ||
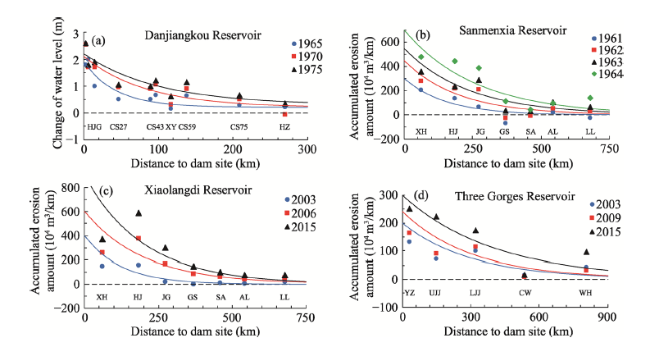
| Danjiangkou | Hanjiang | 1335 | 1091 | HJG-HZ | 3-270 | Water level | 1960-1976 | 6 |
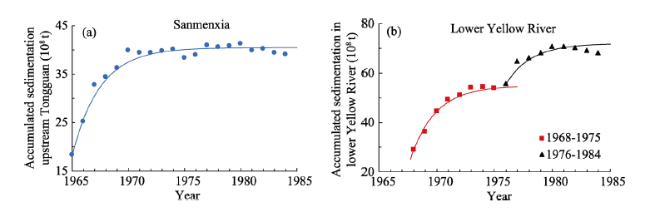
| Sanmenxia | Yellow | 1522 | 1412 | XLD-LJ | 61-678 | Accumulated erosion and deposition amount | 1961-1984 | 21 |
| SZ-TG | - | 1965-1984 | 20 | |||||
| Xiaolangdi | Yellow | 1266 | 807 | XLD-LJ | 61-678 | 2000-2015 | 16 | |
| Three Gorges | Yangtze | 14027 | 12873 | YC-HK | 30-807 | 2003-2016 | 14 |
The distance in the sixth column in Table 1 is the distance between each studied cross-section or the middle point of the studied channel reach and the dam site. |
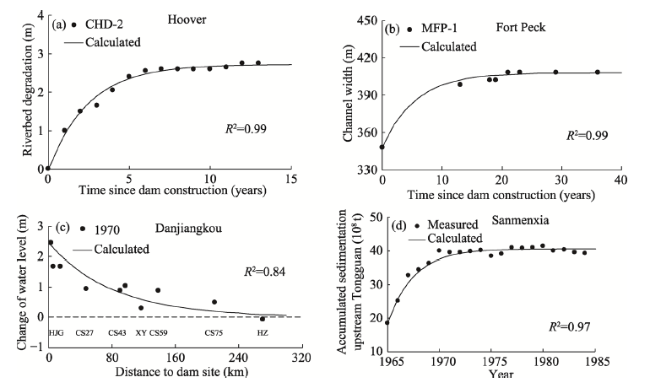
Figure 1 Accumulated riverbed degradation in the studied cross-sections downstream of dams on the Colorado River |
Figure 2 Changes in channel width after dam construction in the studied cross-sections downstream of dams on the Missouri River |
Figure 3 Longitudinal adjustment of the studied channel reaches downstream of dams |
Figure 4 Accumulated sedimentation in the Sanmenxia Reservoir area and lower reaches of the Yellow River |
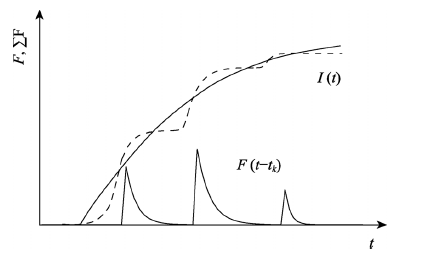
Figure 5 Diagram showing the accumulation effects of external disturbances in fluvial processes |
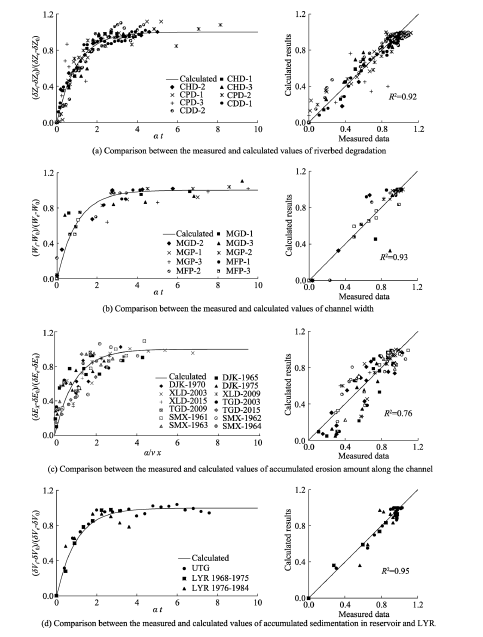
Figure 6 Comparison between the measured and calculated characteristic river variables in the studied cross-sections and channel reaches |
Table 2 Parameter values in equation (18) |
| Vertical readjustment | α | Lateral readjustment | α | Overall readjustment (entire reach) | α |
|---|---|---|---|---|---|
| CHD-1-CHD-3 | 0.30, 0.40, 0.30 | MGP-1-MGP-3 | 0.40, 0.45, 0.50 | SZ-TG | 0.40 |
| CPD-1-CPD-3 | 0.14, 0.22, 0.09 | MFP-1-MFP-3 | 0.18, 0.15, 0.05 | LYR (1968-1975) | 0.45 |
| CDD-1-CDD-2 | 0.17, 0.16 | MGD-1-MGD-3 | 0.60, 0.25, 0.40 | LYR (1976-1984) | 0.40 |
LYR in Table 2 represents all lower reaches of the Yellow River. |
Table 3 Parameter values in equation (19) |
| Longitudinal readjustment | α/v |
|---|---|
| HJG-HZ (1965-1975) | 0.0160, 0.0120, 0.0090 |
| XLD-LJ (1961-1964) | 0.0065, 0.0060, 0.0042, 0.0038 |
| XLD-LJ (2003-2015) | 0.0100, 0.0050, 0.0050 |
| YC-HK (2003-2015) | 0.0033, 0.0033, 0.0025 |
Figure 7 Changes in characteristic river variables following dam construction |
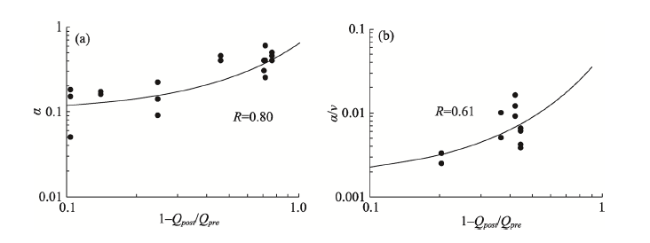
Figure 8 Relationships between α, α/vand relative variation in peak discharge before and after dam construction (1-Qpost /Qpre) |
| [1] |
|
| [2] |
|
| [3] |
|
| [4] |
|
| [5] |
|
| [6] |
|
| [7] |
|
| [8] |
|
| [9] |
|
| [10] |
|
| [11] |
|
| [12] |
|
| [13] |
|
| [14] |
|
| [15] |
|
| [16] |
|
| [17] |
|
| [18] |
|
| [19] |
|
| [20] |
|
| [21] |
|
| [22] |
|
| [23] |
|
| [24] |
|
| [25] |
|
| [26] |
|
| [27] |
|
| [28] |
|
| [29] |
|
| [30] |
|
| [31] |
|
| [32] |
|
| [33] |
|
| [34] |
|
| [35] |
|
| [36] |
|
| [37] |
|
| [38] |
|
/
| 〈 |
|
〉 |