
Journal of Geographical Sciences >
Urban vacant land in growing urbanization: An international review
|
Song Xiaoqing (1984-), PhD and Associate Professor, specialized in human-environment transition, spatial planning, and multifunctional land management. E-mail: sonniasxq@163.com |
Received date: 2019-11-14
Accepted date: 2019-12-30
Online published: 2020-06-25
Supported by
National Natural Science Foundation of China(41871094)
National Natural Science Foundation of China(41401191)
Fund from Humanities and Social Sciences of Ministry of Education Planning(18YJAZH078)
Key Research and Development Program of Hunan Province(2019SK2101)
The Scientific Research Program of Department of Natural Resources of Hunan Province(2017TP1029)
The Open Fund of Hunan Key Laboratory of Land Resources Evaluation and Utilization(SYS-MT-201902)
Copyright
Urban growth and shrinkage constitute the overall pattern of growing urbanization across the globe. Studies on urban vacant land (UVL) are few, and have proved to be mainly rudimentary and subjective. This paper first presents the definition of UVL based on bibliometric analysis. Typology, morphology, proximate causes, and the multiple functions of UVL are then analyzed at parcel, transect, city, and national levels based on an international review. Results show that UVL can be categorized by land cover, land usage, and land ownership. Worldwide, UVL has been widespread and extensive. For example, the occurrence probabilities of UVL in the cases of Guangzhou and New York are 8.46%-8.88% and 3.17%-5.08%, respectively. The average vacancy rate of residential land amounts to 11.48% in 65 U.S. cities. Generally, UVL shows fragmentation and irregular shape, and significant spatial differences exist at parcel, transect, city, and national levels. Proximate causes, such as excessive land division, irregularly shaped land parcels, decreases in resident population, deindustrialization, land speculation, insufficient investment, and environmental concerns, can all result in UVL. Currently, UVL has become a gray area of social, economic, and ecological space. However, it can also be considered a potential resource for enhancing urban sustainability. Policy implications to promote urban sustainability using monitoring, control, and differential revitalization of UVL are presented.
Key words: urban vacant land; urbanization; shrinking cities; land use; transition
SONG Xiaoqing , WEN Mengmeng , SHEN Yajing , FENG Qi , XIANG Jingwei , ZHANG Weina , ZHAO Guosong , WU Zhifeng . Urban vacant land in growing urbanization: An international review[J]. Journal of Geographical Sciences, 2020 , 30(4) : 669 -687 . DOI: 10.1007/s11442-020-1749-0
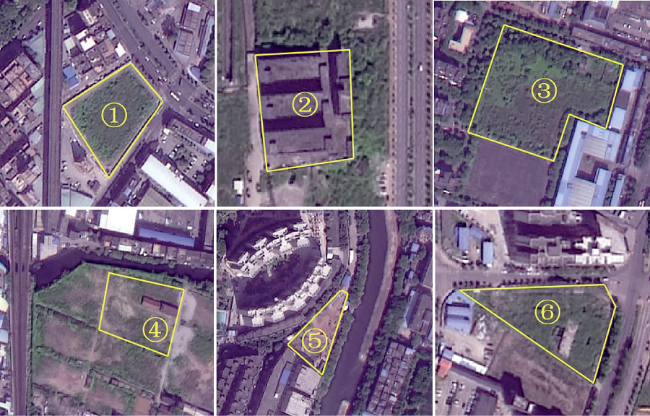
Figure 1 Images of urban vacant land in the case study area in Guangzhou City, China, 2016Note: The data were produced by the authors using a high-resolution remote sensing image, combining a street view and field survey (1. Wild grassland; 2. Abandoned building land; 3. Wild grass mixed with shrub and tree land; 4. Abandoned building mixed with bare land; 5. Bare land; 6. Abandoned building mixed with wild grassland). |
Table 1 Types of urban vacant land in the Guangzhou City case study, 2016 |
| Number of parcels | Area of UVL (ha) | Occurrence probability (%) | ||
|---|---|---|---|---|
| Share of the number of UVL parcels to that of land parcels | Share of the area of UVL to the total land area | |||
| Wild grassland | 831 | 845.88 | 4.03 | 3.66 |
| Wild grass mixed with shrub and tree land | 319 | 487.68 | 1.55 | 2.11 |
| Bare land | 341 | 279.35 | 1.65 | 1.21 |
| Abandoned building mixed with wild grassland | 207 | 201.06 | 1.00 | 0.87 |
| Abandoned building mixed with bare land | 122 | 131.13 | 0.59 | 0.57 |
| Abandoned building land | 12 | 10.93 | 0.06 | 0.05 |
| Sum | 1832 | 1956.02 | 8.88 | 8.46 |
Table 2 Types of urban vacant land in New York City, 2016 (Parcel, ha, %) |
| Number of UVL parcels | Area of UVL (ha) | Occurrence probability (%) | ||
|---|---|---|---|---|
| Share of the number of UVL parcels to that of land parcels | Share of the area of UVL to the total land area | |||
| Private ownership | 21108 | 1724.90 | 2.46 | 2.94 |
| City ownership | 4965 | 949.44 | 0.58 | 1.62 |
| Public authority, state or federal ownership | 140 | 38.90 | 0.02 | 0.07 |
| Mixed city and private ownership | 26 | 52.06 | 0.00 | 0.09 |
| Other ownership which excludes land with the above ownerships | 915 | 212.76 | 0.11 | 0.36 |
| Sum | 27154 | 2978.06 | 3.17 | 5.08 |
Note: The data were obtained from the NYC Department of City Planning (https://www1.nyc.gov/site/planning/data-maps/open-data.page). |
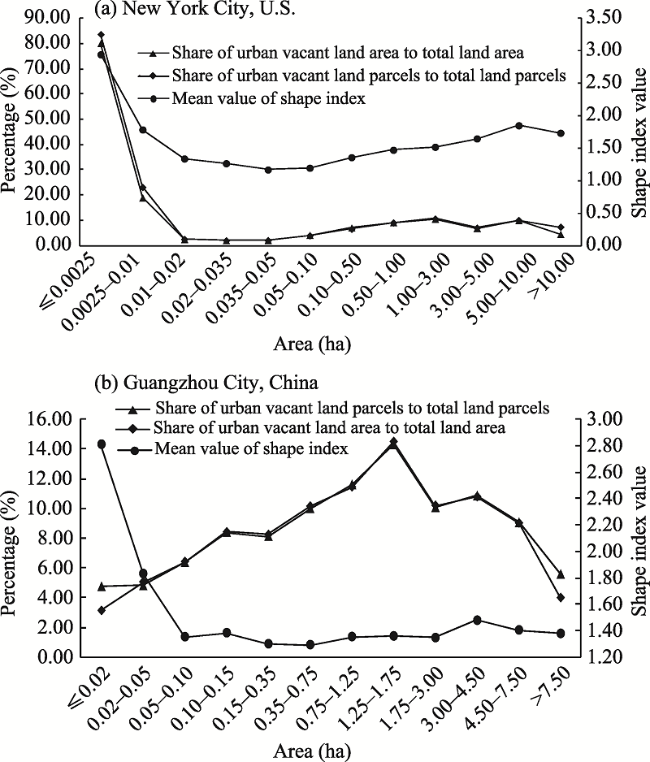
Figure 2 Comparison of the morphologies of urban vacant land in the case study area in Guangzhou and New York City, 2016Note: The vacant land data pertaining to New York City were obtained from the NYC Department of City Planning (https://www1.nyc.gov/site/planning/data-maps/open-data.page); the vacant land data pertaining to Guangzhou City in southern China were produced by the authors using a high-resolution remote sensing image, combining a street view and field survey. |
Table 3 Morphologic characteristics of urban vacant land parcels in New York City, 2016 |
| Districts | New York City | Manhattan | Bronx | Brooklyn | Queens | Staten Island | |
|---|---|---|---|---|---|---|---|
| Occurrence probability | Share of the number of the vacant parcels to that of the whole city (%) | 3.17 | 2.72 | 4.48 | 2.45 | 2.53 | 5.65 |
| Share of the area of the vacant parcels to that of the whole city (%) | 5.08 | 2.06 | 2.97 | 2.48 | 2.53 | 14.40 | |
| Mean area of UVL (ha) | 0.11 | 0.075 | 0.060 | 0.048 | 0.073 | 0.247 | |
| Average shape index value of UVL | 1.46 | 1.50 | 1.46 | 1.46 | 1.49 | 1.38 | |
Note: The data were obtained from the NYC Department of City Planning (https://www1.nyc.gov/site/planning/data-maps/open-data.page). |
Table 4 Morphologic characteristics of urban vacant land parcels in the typical transect area of Guangzhou City, China, 2016 |
| District | Number of UVL parcels | Area of UVL (ha) | Mean area of UVL parcel (ha) | Occurrence probability (%) | Average shape index value | |
|---|---|---|---|---|---|---|
| Share of the number of the vacant parcels to that of the whole city | Share of the area of the vacant parcels to that of the whole city | |||||
| Transect 1 | 83 | 54.17 | 0.65 | 3.75 | 2.49 | 1.45 |
| Transect 2 | 144 | 176.11 | 1.22 | 3.88 | 4.90 | 1.46 |
| Transect 3 | 484 | 597.40 | 1.23 | 11.03 | 9.94 | 1.48 |
| Transect 4 | 456 | 536.47 | 1.18 | 12.09 | 10.84 | 1.37 |
| Transect 5 | 413 | 361.31 | 0.87 | 10.19 | 9.49 | 1.31 |
| Transect 6 | 252 | 230.55 | 0.91 | 10.06 | 8.89 | 1.27 |
| Total | 1832 | 1956.02 | 1.07 | 8.88 | 8.46 | 1.39 |
Note: The data were produced by the authors using a high-resolution remote sensing image, combining a street view and field survey. |
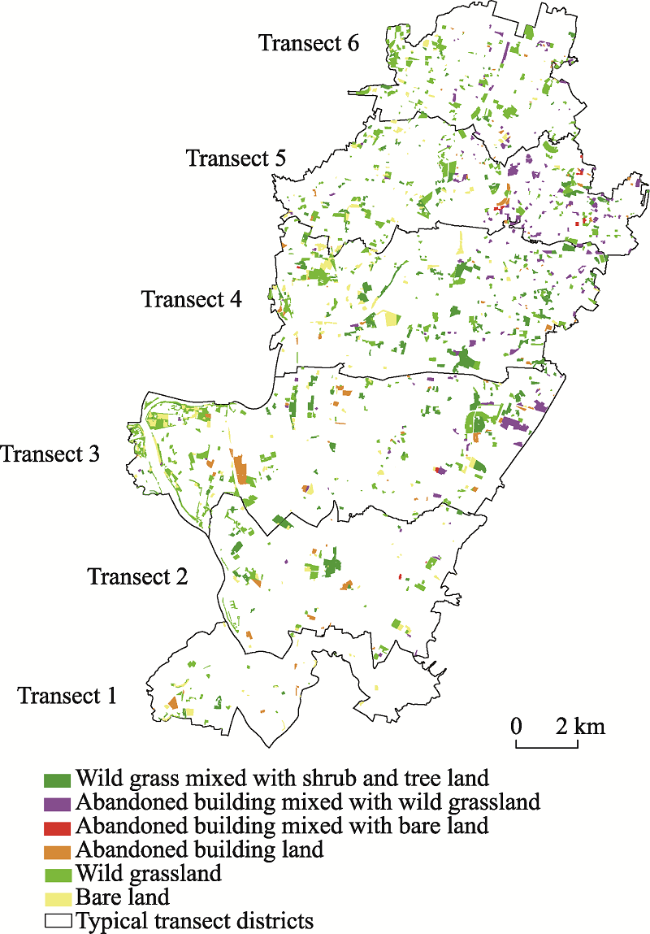
Figure 3 Distribution pattern of urban vacant land in typical transects in Guangzhou, 2016Note: The data were produced by the authors using a high- resolution remote sensing image, combining a street view and field survey |
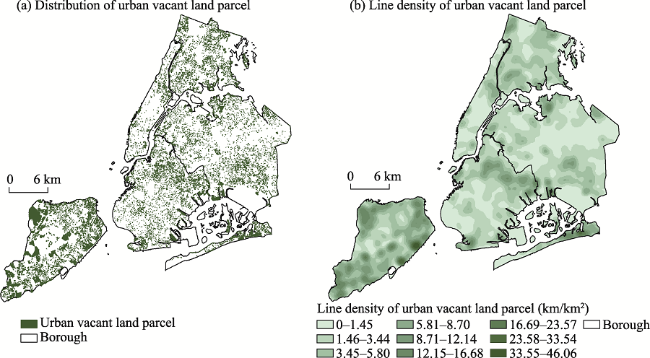
Figure 4 Distribution pattern of urban vacant land in New York City, 2016.Note: The data were obtained from the NYC Department of City Planning (https://www1.nyc.gov/site/planning/data-maps/open-data.page). |
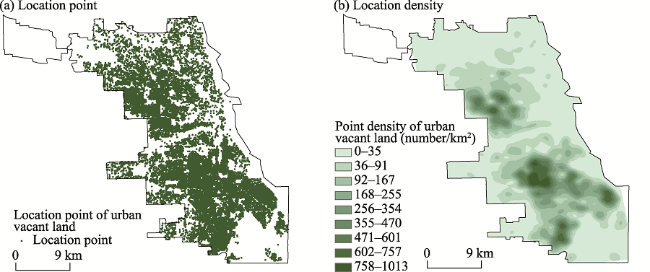
Figure 5 Distribution pattern of urban vacant land in Chicago, 2017Note: The space coordinates of vacant land parcels were from the City of Chicago (https://www.cityofchicago.org/city/en.html). |
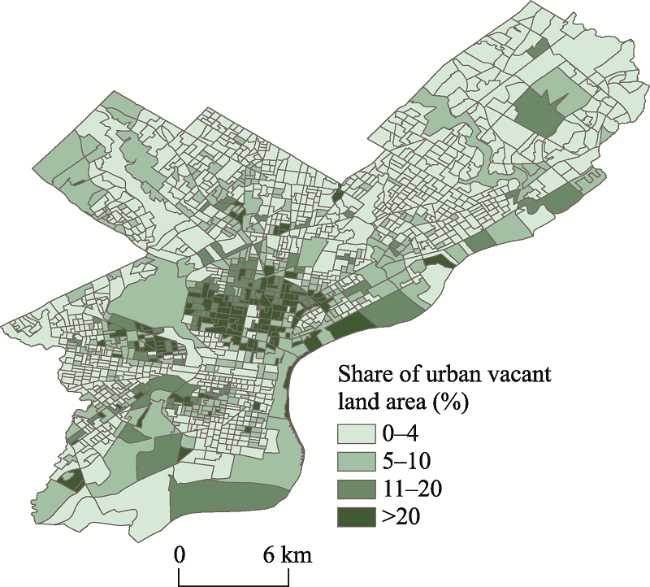
Figure 6 Distribution pattern of share of urban vacant land area in Philadelphia, 2010Note: The data were obtained from ATACANGROUP (https://www.centercityrealestate.com/philadelphia-real-estate-blog/philadelphias-vacant-landissuses/). |
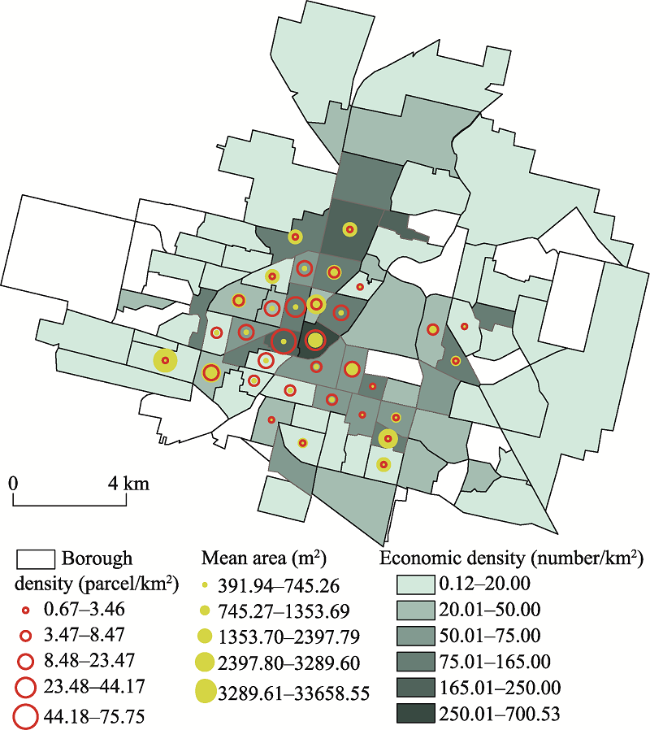
Figure 7 Distribution pattern of urban vacant land in Saskatoon, Canada, 2016Note: “Density” denotes the density of urban vacant land parcel; “economic density” denotes the density of commercial and industrial businesses at the neighborhood level. Vacant land data and data of commercial and industrial businesses were taken from the Vacant Lot Inventory and the Annual Report of Businesses Information for the City of Saskatoon, which were released by the city hall (https://www.saskatoon.ca/). |
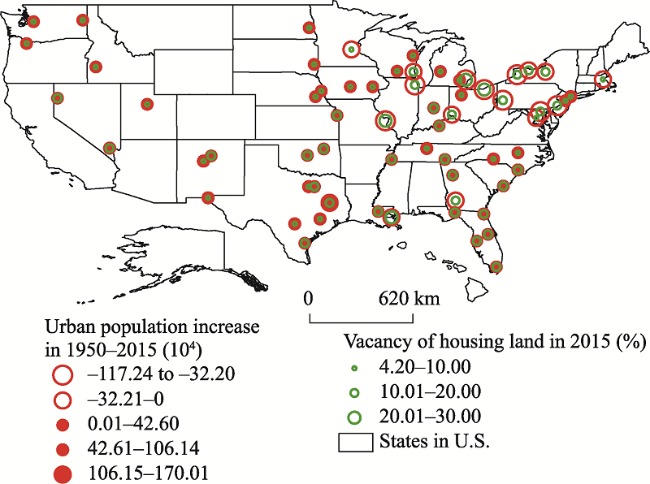
Figure 8 Distribution pattern of urban vacant housing land in 65 cities, U.S., 2015 |
| [1] |
|
| [2] |
|
| [3] |
|
| [4] |
|
| [5] |
ATACANGROUP, 2019. , 2019-10-31.
|
| [6] |
|
| [7] |
|
| [8] |
|
| [9] |
|
| [10] |
City of Chicago. https://www.cityofchicago.org/city/en.html, 2019-10-31.
|
| [11] |
City of Ottawa. http://ottawa.ca/en/city-hall, 2019-10-31.
|
| [12] |
City of Saskatoon. https://www.saskatoon.ca/, 2019-10-31.
|
| [13] |
|
| [14] |
|
| [15] |
|
| [16] |
|
| [17] |
|
| [18] |
Econsult Corporation (EC), 2010. Vacant Land Management in Philadelphia: The Costs of the Current System and the Benefits of Reform.
|
| [19] |
|
| [20] |
IBRD-IDA. http://data.worldbank.org.cn/indicator, 2019-10-31.
|
| [21] |
|
| [22] |
|
| [23] |
|
| [24] |
|
| [25] |
|
| [26] |
|
| [27] |
|
| [28] |
|
| [29] |
|
| [30] |
|
| [31] |
|
| [32] |
|
| [33] |
|
| [34] |
|
| [35] |
|
| [36] |
|
| [37] |
|
| [38] |
Ministry of Land and Resources of the People’s Republic of China (MLRPRC), 2012. Regulation on Idle Land Disposal, 2012-06-01.
|
| [39] |
National Bureau of Statistics of China (NBSC), 2019. China Statistical Yearbook 2018. Beijing: China Statistics Press.
|
| [40] |
|
| [41] |
|
| [42] |
|
| [43] |
|
| [44] |
NYC OpenData. https://opendata.cityofnewyork.us/data/, 2019-10-31.
|
| [45] |
|
| [46] |
|
| [47] |
Philadelphia Association of Community Development Corporations(PACDC), 2010. Vacant Land Management in Philadelphia: The Costs of the Current System and the Benefits of Reform.
|
| [48] |
|
| [49] |
|
| [50] |
Standardization Administration of the People’s Republic of China (SAPRC), 2017. Current Land Use Classification. GBT 21010-2017.
|
| [51] |
|
| [52] |
|
| [53] |
United Nations, Department of Economic and Social Affairs, Population Division (UN), 2014. World Urbanization Prospects: The 2014 Revision, Highlights.
|
| [54] |
United Nations, Department of Economic and Social Affairs, Population Division (UN), 2019. World Urbanization Prospects: The 2018 Revision, Highlights.
|
| [55] |
|
| [56] |
|
| [57] |
World Population Review (WPR), 2019. http://worldpopulationreview.com/us-cities/, 2019-10-31.
|
| [58] |
|
| [59] |
|
| [60] |
|
| [61] |
|
/
| 〈 |
|
〉 |