
Journal of Geographical Sciences >
The changes in the geographical patterns of China’s tourism in 1978-2018: Characteristics and underlying factors
|
Zhang Chengming (1989–), PhD Candidate, specialized in elite landscape and tourism destination evolution. E-mail: zhangchm@qq.com; zhangchm5@mail2.sysu.edu.cn |
Received date: 2019-08-10
Accepted date: 2019-09-30
Online published: 2020-05-25
Supported by
National Natural Science Foundation of China(No.41571137)
Copyright
Since the reform and opening-up policy launched in 1978, the number of inbound tourists increased from 1.8 million in 1978 to 139.5 million in 2017, and that of domestic tourists increased from 344 million in 1991 to 5 billion in 2017. This article conducts research on how the geographical pattern of China’s tourism has evolved in the last four decades on the national-scale and regional-scale, for rare studies before could focus on such an extended date and utilize inbound and domestic tourism data simultaneously. Grounded on viable datasets and multiple vibrant data analysis approaches (including the Gini coefficient, primacy index analysis, hot spot analysis and Pearson correlation analysis), this article unpacks triple vital realities. (1) The overall geographical pattern of China’s tourism development can arguably summarize as “high in the eastern and low in the western part, high in the southern and low in the northern part.” Meanwhile, China’s inbound tourism has long shown a pattern of polarized distribution; While, domestic tourism has experienced a shift from the polarized distribution to the equilibrium distribution. (2) According to the features and characteristics, China's tourism development can be divided into four stages. They are precisely the initial modern tourism stage (1978-1988), the domestic tourism cultivating stage (1989-1996), the rapid development stage (1997-2007) and the new normal stage (2008-present). (3) This article also identified multiple factors underlying the inbound and domestic tourism development in China, including policies, management systems, tourism demand, tourist attractions, economic level, consumption level, industrial development, investment status, traffic conditions, accommodation services, intermediary services and degree of openness.
ZHANG Chengming , WENG Shixiu , BAO Jigang . The changes in the geographical patterns of China’s tourism in 1978-2018: Characteristics and underlying factors[J]. Journal of Geographical Sciences, 2020 , 30(3) : 487 -507 . DOI: 10.1007/s11442-020-1739-2
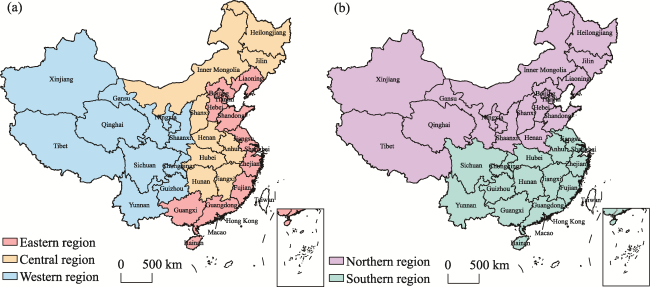
Figure 1 The division of regions in China |
Table 1 Correlation analysis of factors influencing tourism at national scale in China |
| Factors | Variables | Domestic tourists | Inbound tourists |
|---|---|---|---|
| Economic level | GDP | 0.996** | 0.809** |
| Consumption level | Per capita GDP | 0.995** | 0.815** |
| Total retail sales of social commodities | 0.998** | 0.769** | |
| Industrial development | Third industry proportion | 0.922** | 0.880** |
| Third industry output value | 0.998** | 0.775** | |
| Investment status | Investment in fixed assets | 0.996** | 0.738** |
| Traffic conditions | Railway mileage | 0.991** | 0.810** |
| Road mileage | 0.909** | 0.928** | |
| Civil aviation domestic routes | 0.985** | 0.752** | |
| Civil aviation international routes | 0.967* | 0.783** | |
| Civilian passenger vehicle | 0.994** | 0.722** | |
| Accommodation services | Number of rooms in star hotels | 0.754** | 0.984** |
| Intermediary services | Travel agency scale | 0.918** | 0.959** |
| Degree of openness | Use of foreign capital | 0.515** | 0.817** |
| Import and export volume | 0.938** | 0.903** |
Note: * indicates significant at the 5% level, ** indicates significant at the 1% level. |
Table 2 Correlation analysis of factors influencing tourism at provincial-scale in China |
| Factors | Variables | Domestic tourists | Inbound tourists |
|---|---|---|---|
| Tourist attractions | Scenic spots | 0.621** | 0.573** |
| High-grade scenic spots | 0.721** | 0.201 | |
| Economic level | Provincial GDP | 0.693** | 0.594** |
| Consumption level | Per capita GDP | 0.080 | 0.232 |
| Industrial development | Tertiary industry income | 0.627** | 0.637** |
| Investment status | Investment in fixed assets | 0.832** | 0.263 |
| Accommodation services | Number of accommodations | 0.650** | 0.730** |
| Number of restaurants | 0.676** | 0.635** | |
| Intermediary services | Total number of travel agents | 0.637** | 0.461** |
| Traffic conditions | Number of private cars | 0.707** | 0.507** |
| Railway passenger volume | 0.650** | 0.645** | |
| Highway passenger volume | 0.638** | 0.321 | |
| Civil aviation passenger volume | 0.136 | 0.808** | |
| Degree of openness | Use of foreign capital | 0.516** | 0.529** |
| Import and export volume | 0.279 | 0.871** |
Note: * indicates significant at the 5% level, ** indicates significant at the 1% level. |
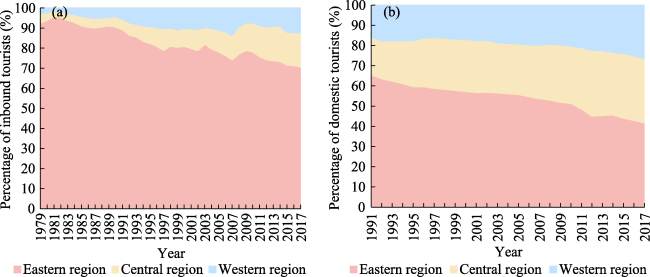
Figure 2 The proportion of inbound tourists (a) and domestic tourists (b) in eastern, central and western regions in China |
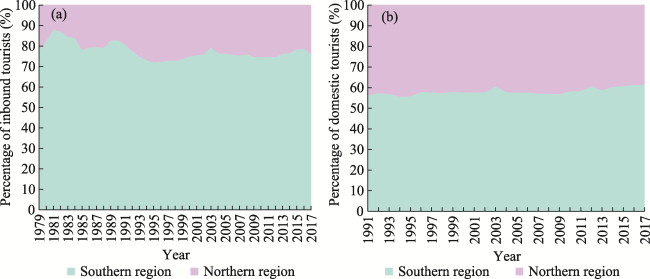
Figure 3 Proportion of inbound tourists (a) and domestic tourists (b) in southern and northern regions in China |
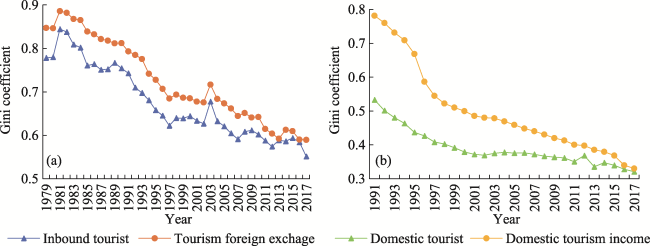
Figure 4 Inbound tourism Gini coefficient (a) and domestic tourism Gini coefficient (b) in China |
Figure 5 Provincial primacy index for inbound and domestic tourists in China |
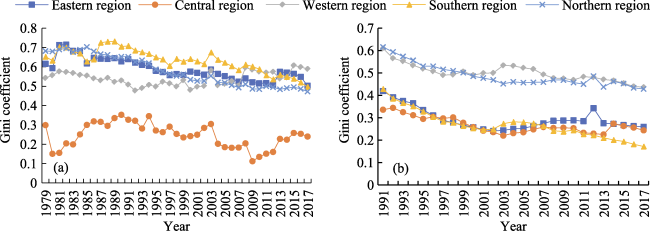
Figure 6 Gini coefficients of inbound tourists (a) and domestic tourists (b) in different regions in China |
Figure 7 Provincial primacy index of inbound tourists (a) and domestic tourists (b) in different regions in China |
Table 3 Top 5 provinces of IT, TFE, DT and DTI in 2017 in China |
| Province | IT/million | Province | TFE/$billion | Province | DT/million | Province | DTI/¥billion |
|---|---|---|---|---|---|---|---|
| Guangdong | 36.48 | Guangdong | 19.65 | Shandong | 763.74 | Jiangsu | 1130.75 |
| Shanghai | 8.73 | Zhejiang | 8.28 | Jiangsu | 742.87 | Guangdong | 1066.70 |
| Fujian | 6.92 | Fujian | 7.59 | Guizhou | 740.00 | Sichuan | 882.54 |
| Yunnan | 6.68 | Shanghai | 6.81 | Sichuan | 670.00 | Zhejiang | 871.72 |
| Zhejiang | 5.89 | Beijing | 5.12 | Henan | 662.04 | Shandong | 842.07 |
Table 4 Top 5 provinces of growth ratio of IT, TFE, DT and DTI from 2008 to 2017 in China |
| Inbound tourists | Tourism foreign exchange | Domestic tourists | Domestic tourism income | ||||
|---|---|---|---|---|---|---|---|
| Province | Growth ratio | Province | Growth ratio | Province | Growth ratio | Province | Growth ratio |
| Tianjin | 600% | Ningxia | 1396% | Xizang | 1060% | Xizang | 1697% |
| Tibet | 405% | Xinjiang | 676% | Gansu | 863% | Jiangxi | 1088% |
| Sichuan | 381% | Sichuan | 574% | Guizhou | 808% | Gansu | 1057% |
| Hunan | 354% | Xizang | 536% | Jiangxi | 614% | Hebei | 1037% |
| Ningxia | 353% | Anhui | 431% | Anhui | 530% | Yunnan | 1024% |
Figure 8 Division of tourism development stages in China |
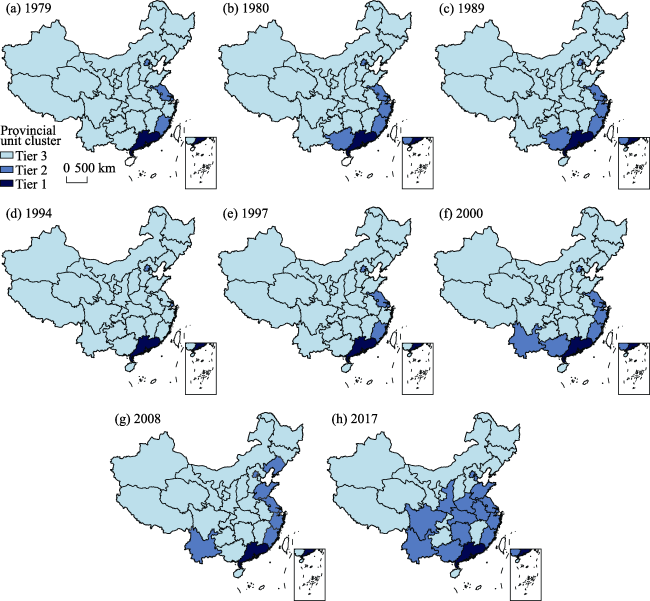
Figure 9 Hot spot analysis clustering of inbound tourist in provincial level districts of China |
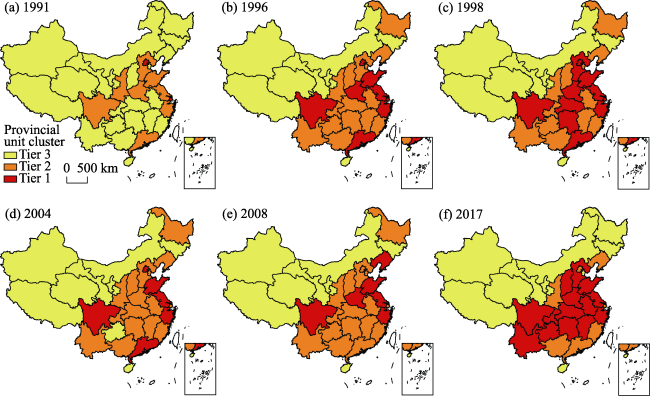
Figure 10 Hot spot analysis clustering of domestic tourist in provincial level districts of China |
| [1] |
ArcGIS, 2018. How hot spot analysis (Getis-Ord Gi*) works. .
|
| [2] |
|
| [3] |
|
| [4] |
|
| [5] |
|
| [6] |
|
| [7] |
China Tourism Administration (CTA), Ctrip T G, 2018. China outbound tourism big data report2017. .
|
| [8] |
|
| [9] |
|
| [10] |
|
| [11] |
|
| [12] |
|
| [13] |
|
| [14] |
|
| [15] |
|
| [16] |
|
| [17] |
|
| [18] |
|
| [19] |
|
| [20] |
|
| [21] |
|
| [22] |
|
| [23] |
|
| [24] |
|
| [25] |
UNWTO, 2001. Tourism 2020 Vision. Madrid: World Tourism Organization.
|
| [26] |
|
| [27] |
|
| [28] |
|
| [29] |
|
| [30] |
Wikipedia, 2018. Gini coefficient. .
|
| [31] |
|
| [32] |
|
| [33] |
|
| [34] |
|
/
| 〈 |
|
〉 |


