
Journal of Geographical Sciences >
Effects of rainfall intensity on the sediment concentration in the Loess Plateau, China
|
Liu Xiaoyan (1964–), PhD and Professor of Engineering, specialized in the study of runoff and sediment changes in the Yellow River. E-mail: liuxiaoyan@yrcc.gov.cn |
Received date: 2019-03-22
Accepted date: 2019-06-08
Online published: 2020-05-25
Supported by
National Key R&D Program of China(No.2016YFC0402400)
National Natural Science Foundation of China(No.51779099)
Copyright
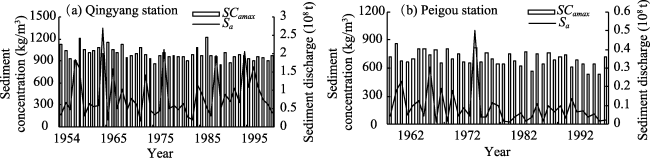
To study the effects of changes in the rainfall intensity on sediment concentrations in the Loess Plateau, the observed rainfall intensities and sediment concentrations from three typical small watersheds were used to analyze the relationship between these parameters. The results showed that the sediment concentration generally increased with the increasing rainfall intensity on slope scale. However, at watershed scale, a significant threshold phenomenon was observed for the effects of the rainfall intensity on the sediment concentration. When the rainfall intensity exceeds the threshold, the flood sediment concentration will no longer increase with the increase in the rainfall intensity. The rainfall intensity threshold increased with increasing vegetation coverage. The rainfall intensity threshold was 10-15 mm/h during 1956-1969, reached 20 mm/h from 1990 to 1997 and is approximately 40 mm/h at present. Due to a rainfall intensity of 10-15 mm/h almost happened every year, the vegetation did not change much from the 1950s to 1980s. Sediment yield mainly depends on soil erosion caused by surface flow, but the surface flow speed does not increase indefinitely with the increase in the flow discharge. Thus, the annual maximum sediment concentration of the tributaries in the loess area has been basically stable before the 1990s.
LIU Xiaoyan , DANG Suzhen , LIU Changming , DONG Guotao . Effects of rainfall intensity on the sediment concentration in the Loess Plateau, China[J]. Journal of Geographical Sciences, 2020 , 30(3) : 455 -467 . DOI: 10.1007/s11442-020-1737-4
Figure 1 Changes in the annual maximum sediment concentration (SCamax) and the annual sediment discharge (Sa) of typical tributaries in the Loess Plateau (a. Qingyang station on the Malian River; b. Peigou station on the Quchan River) |
Table 1 The characteristic values of the selected watersheds |
| Subwatershed | Small watershed | |||||||||
|---|---|---|---|---|---|---|---|---|---|---|
| Tuanshangou | Shuiwanggou | Tuan- yuangou | Qiaogou | Peijiamao | Liujiagou | Shejiagou | ||||
| Area (km2) | 0.18 | 0.107 | 0.491 | 0.44 | 39.5 | 21.0 | 4.72 | |||
| Period (years) | 1961-1969 | 1959-1967 | 1958-1961 | 1990-1997 | 2007-2018 | 1990-1997 | 2007-2018 | 1960-1969 | 1963-1969 | |
| Vegetation coverage (%) | 10-30 | 36-47 | 55-75 | 36-47 | 55-75 | 10-30 | ||||
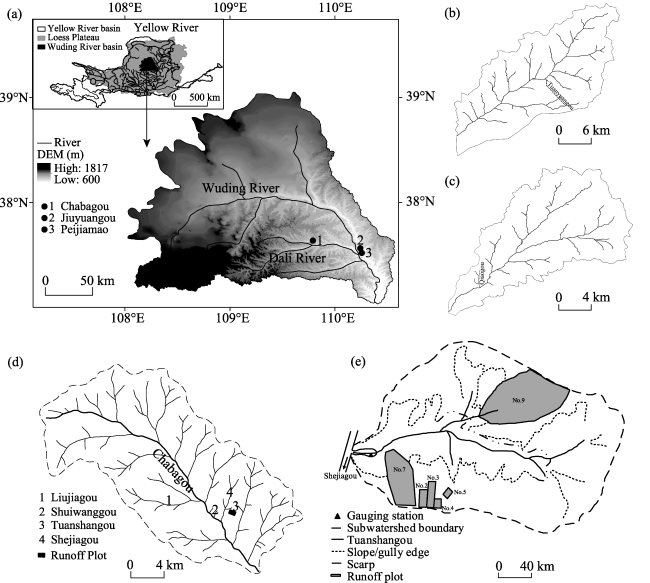
Figure 2 Location of the study area (a. Wuding River basin; b. Jiuyuangou watershed; c. Peijiamao watershed; d. Chabagou watershed; e. runoff plots in the Tuanshangou subwaershed) |
Table 2 Overview of the runoff plots |
| Runoff plots located at an upper hillslope | Runoff plots composed of hillslope and valley side slope (entire slope) | |||||||
|---|---|---|---|---|---|---|---|---|
| No. 2 | No. 3 | No. 4 | No. 5 | Duanchuan 1 | Duanchuan 2 | No. 7 | No. 9 | |
| Slope length (m) | 40 | 60 | 20 | 20 | 7.57 | 20.1 | ||
| Area (m2) | 647 | 970 | 324 | 350 | 31.5 | 208 | 17200 | 4580 |
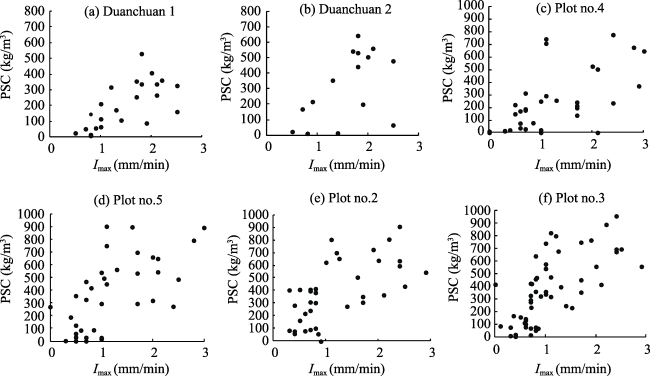
Figure 3 The relationships between the maximum rainfall intensity (Imax) and the peak sediment concentration (PSC) of the runoff plots located at the upper hillslope |
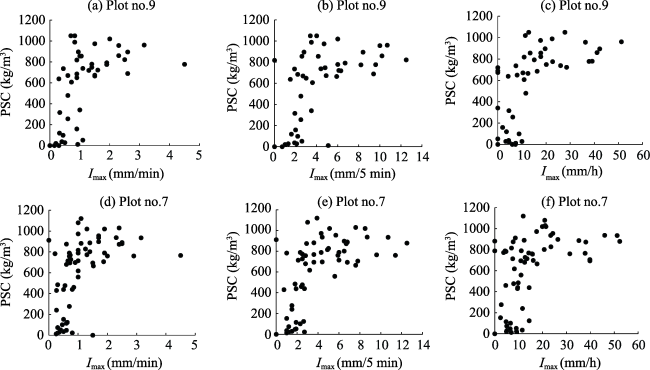
Figure 4 The relationships between Imax and PSC at natural slope gully plots |
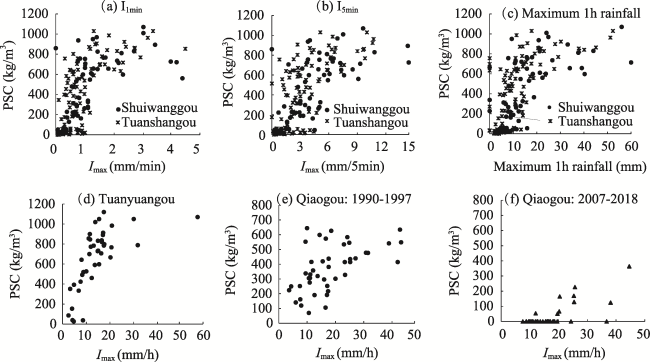
Figure 5 The relationships between Imax and PSC in the subwatersheds |
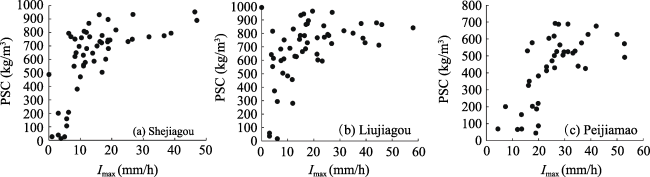
Figure 6 The relationships between Imax and PSC in small watersheds |
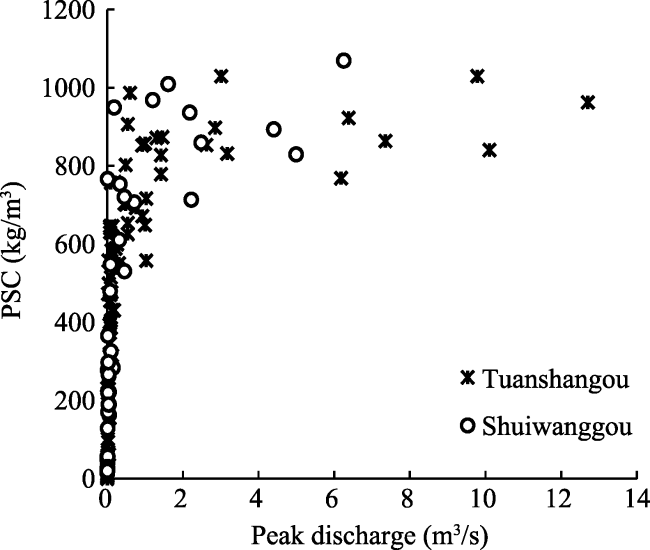
Figure 7 The relationship between the peak discharge and PSC in the subwatersheds |
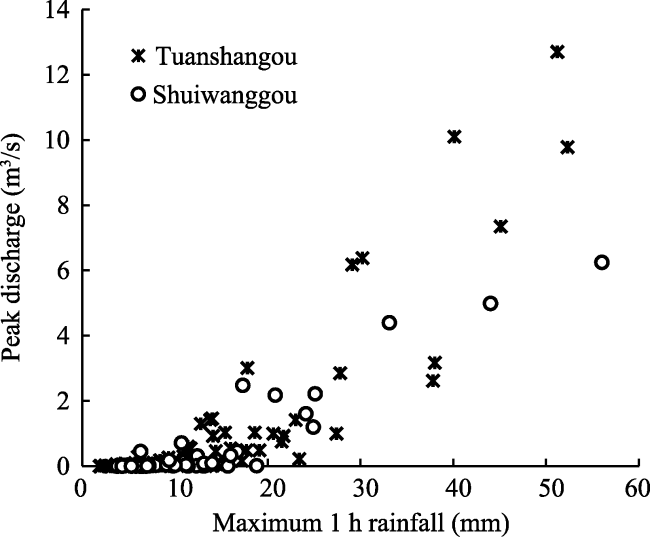
Figure 8 The relationship between the peak discharge and maximum 1 h rainfall in the subwatersheds |
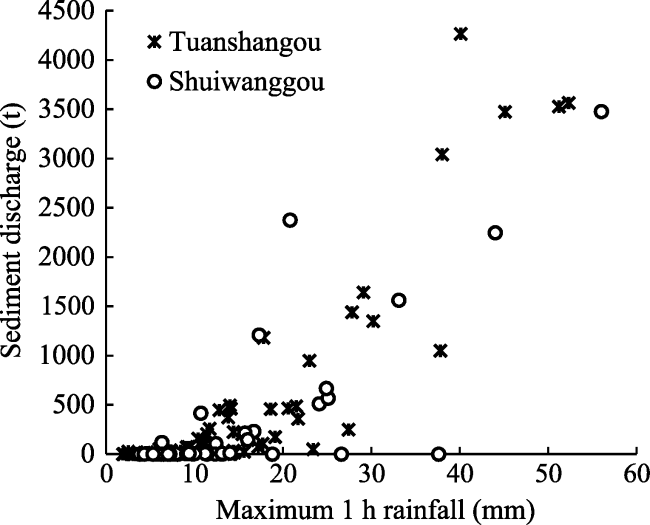
Figure 9 The relationship between the maximum 1 h rainfall and sediment discharge in the subwatersheds |
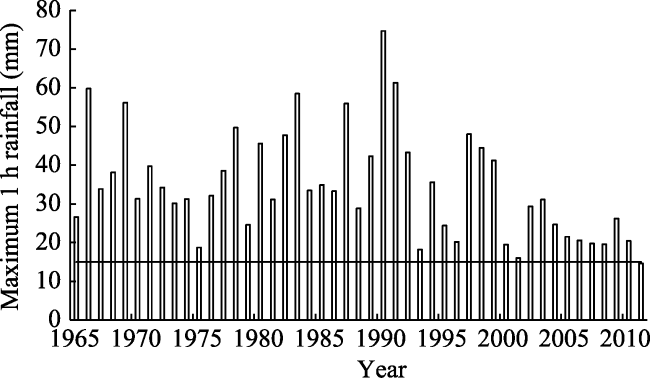
Figure 10 The change of annual maximum 1 h rainfall in Chabagou Creek |
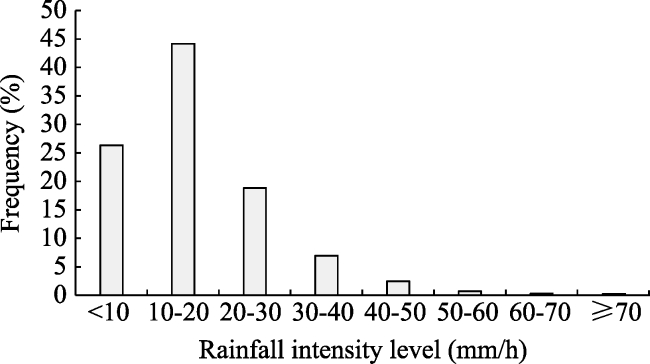
Figure 11 The distribution of the annual maximum rainfall intensity in the loess hilly region from Hekouzhen to Longmen in the middle reaches of the Yellow River Basin |
| [1] |
|
| [2] |
|
| [3] |
|
| [4] |
|
| [5] |
|
| [6] |
|
| [7] |
|
| [8] |
|
| [9] |
|
| [10] |
|
| [11] |
|
| [12] |
|
| [13] |
|
| [14] |
|
| [15] |
|
| [16] |
|
| [17] |
|
| [18] |
|
| [19] |
|
| [20] |
|
| [21] |
|
| [22] |
|
| [23] |
|
| [24] |
|
| [25] |
|
| [26] |
|
| [27] |
|
/
| 〈 |
|
〉 |