
Journal of Geographical Sciences >
Analysis of critical river discharge for saltwater intrusion control in the upper South Branch of the Yangtze River Estuary
|
Sun Zhaohua (1976–), Associate Professor, E-mail: zhsun@whu.edu.cn |
Received date: 2019-12-02
Accepted date: 2020-01-22
Online published: 2020-07-25
Supported by
National Key Research and Development Program of China(2018YFC0407802)
National Major Scientific and Technological Program for Water Pollution Control and Treatment(2014ZX07104-005)
Copyright
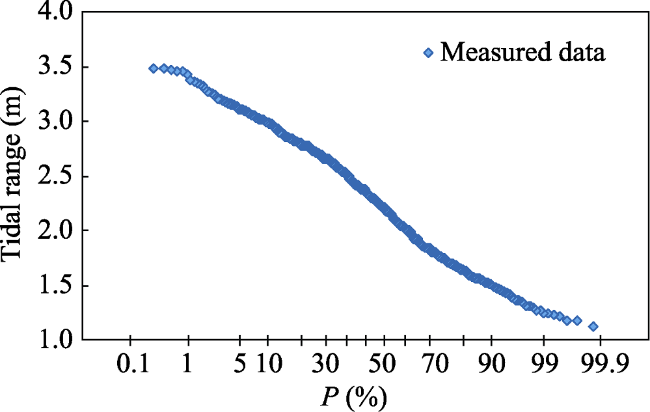
Saltwater intrusion in the estuary area threatens the use of freshwater resources. If river discharge increases to a critical value, then saltwater intrusion frequency and salinity level decreases. In this study, long-term river discharge and tidal range data in the Yangtze River Estuary (YRE) and salinity data obtained in the upper South Branch of the YRE were used to analyze the characteristics of different variables and the basic law of their interactions. Two methods, namely, the material analysis method and empirical models, were applied to determine the critical river discharge for saltwater intrusion control. Results are as follows: (1) the salinity might exceed the drinking water standard of China when the river discharge was less than 30,000 m³/s. Approximately 69% of salinity excessive days occurred when the river discharge was less than 15,000 m³/s; (2) the tidal range in the YRE roughly varied in sinusoidal pattern with a 15-day cycle length. Exponential relationship existed between daily salinity (chlorinity) and daily mean tidal range. Combining these two features with the cumulative frequency statistics of tidal ranges, it was showed that notable saltwater intrusion occurred when the tidal range was more than 2.7 m at Qinglonggang station. Moreover, the critical discharge was found to be slightly higher than 11,000 m³/s; (3) various of empirical models for salinity prediction could be chosen to calculate the critical discharge. The values obtained by different models were in the range of 11,000-12,000 m³/s; (4) the proposed critical discharge to reduce notable saltwater intrusion was 11,500 m³/s. After the Three Gorges Reservoir operation, the minimum river discharge into the YRE in 2008-2017 was below the critical discharge, thereby suggesting an increase in the minimum river discharge by reservoir regulation in drought periods.
SUN Zhaohua , FAN Jiewei , YAN Xin , XIE Cuisong . Analysis of critical river discharge for saltwater intrusion control in the upper South Branch of the Yangtze River Estuary[J]. Journal of Geographical Sciences, 2020 , 30(5) : 823 -842 . DOI: 10.1007/s11442-020-1757-0
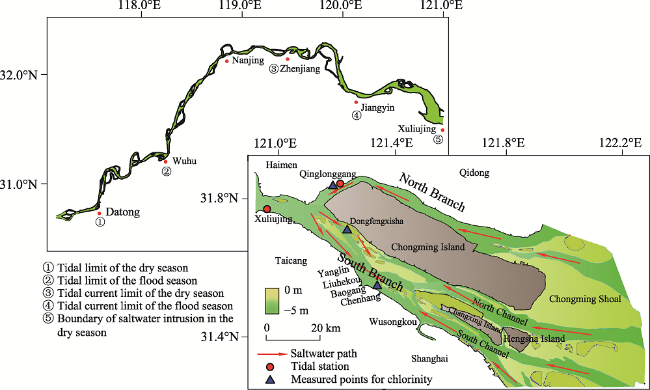
Figure 1 Sketch of the Yangtze River Estuary displaying the location of measuring stations |
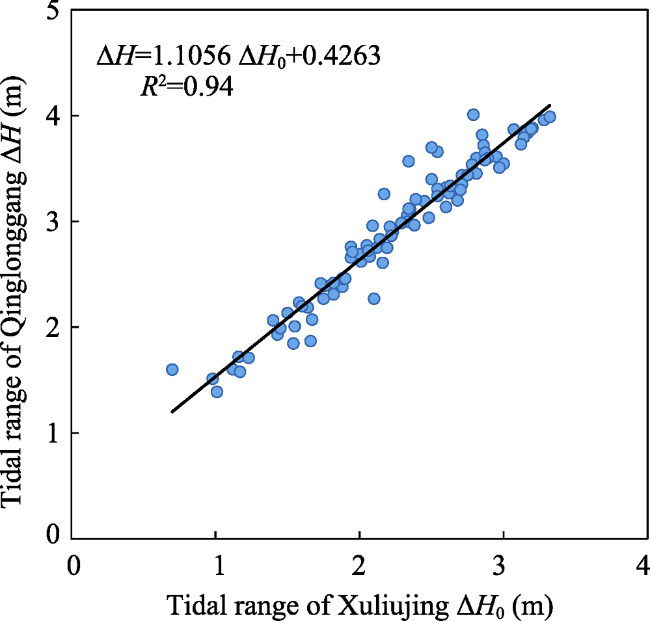
Figure 2 Correlation between the daily mean tidal ranges of Xuliujing and Qinglonggang stations |
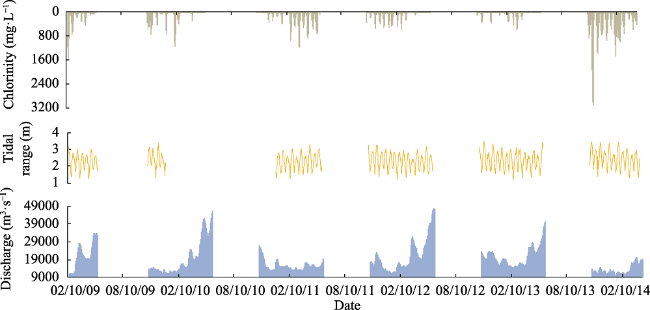
Figure 3 Chlorinity of Dongfengxisha observation point, discharge at Datong station and tidal ranges at Xuliujing station in the dry seasons of 2009-2014 |
Table 1 Data sources |
| Data type | Station | Period | Source |
|---|---|---|---|
| Daily discharge | Datong | 1950-2017 | Yangtze River Hydrographic Yearbook |
| Daily mean tidal range | Xuliujing | 2009, 2011-2014 | Yangtze River Hydrographic Yearbook |
| Daily mean tidal range | Qinglonggang | Certain months in 2005, 2009, 2011, 2014 and 2017 | Jiangsu Provincial Hydrology and Water Resources Bureau, Zheng et al. (2014) |
| Daily mean chlorinity | Dongfengxisha | 2009-2014 | Shanghai Water Affairs Bureau |
Table 2 Selected empirical models for salinity prediction in the upper South Branch of the Yangtze River Estuary |
| Source | Relationship | Variable explanation |
|---|---|---|
| Mao et al.(1993) | S~exp(ΔHα/Qβ) | S is the salinity of Baogang; ∆H is the tidal range of Qinglonggang; Q is the discharge at Datong station. |
| Zheng et al.(2014) | S=aebΔH+ aebΔH(c1Q3+ c2Q2+c3Q+c4) | S is the salinity of Qinglonggang station; ∆H is the tidal range of Qinglonggang station; Q is the discharge at Datong station. |
| Chen et al.(2013b) | S=(4.16×10‒9Q2‒2.745Q+4.317)×0.02404×e0.009085ΔH | S is the salinity of Chenhang; ∆H is the tidal range of Qinglonggang station; Q is the discharge at Datong station. |
| Sun et al.(2017) | C=Aexp(aΔH0‒bQ) | ΔH0 is the tidal range of Xuliujing station; Q is the discharge at Datong station; C is the chlorinity of Dongfengxisha. |
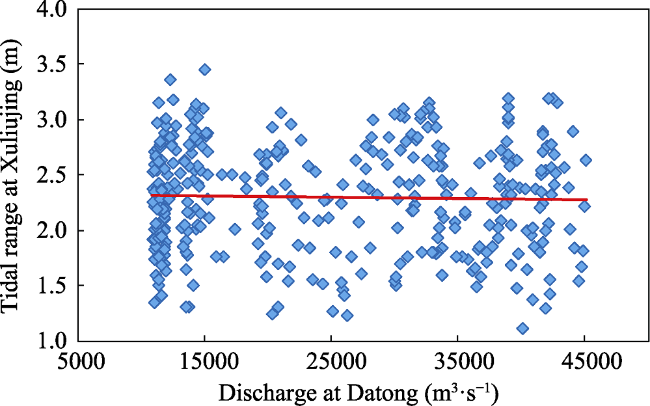
Figure 4 Relationship between the discharge at Datong station and the tidal range at Xuliujing station (Red line across the data points represents the trend line between the two variables.) |
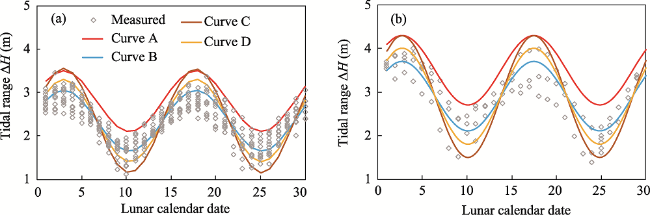
Figure 5 Relationship between lunar calendar date and daily mean tidal range at (a) Xuliujing station and (b) Qinglonggang station (Curves of different colors represent different tidal range estimation modes.) |
Table 3 Frequency of daily discharge at Datong station in different periods |
| Measured time | Cumulative frequency of less than a certain value of discharge (%) | |||
|---|---|---|---|---|
| < 25000 m3/s | < 15000 m3/s | < 12000 m3/s | < 10000 m3/s | |
| 1950-2002 | 45.71 | 25.71 | 16.9 | 10.06 |
| 2003-2007 | 55.83 | 24.85 | 14.29 | 2.74 |
| 2008-2017 | 50.33 | 21.59 | 7.73 | 0.1 |
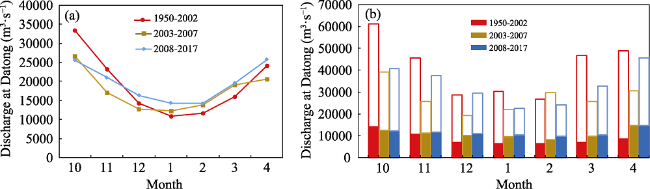
Figure 6 Characteristics of river discharge at Datong station in dry seasons of three different periods: (a) multi-year average monthly discharge; (b) the maximum and the minimum discharge in every month (Total height represents the maximum value of each month. Colored fill portion represents the minimum value of each month. Red represents the period of 1950-2002, brown represents the period of 2003-2007, blue represents the period of 2008-2017) |
Table 4 Statistical features of certain saltwater intrusion events in the upper South Branch of the Yangtze River Estuary in recent decades |
| Measured time | Observation point | Salinity excessive days (d) | Average discharge at Datong station during the salinity excessive periods (m³/s) | Data source |
|---|---|---|---|---|
| Winter of 1978-Spring of 1979 | Wusong | 64 | 7256 | Shen et al.(2002) |
| February-March 1987 | Chenhang | 13 | 8467 | Gu et al.(2003), Chen et al.(2011), Xu and Yuan(1994) |
| February-March 1999 | 25 | 9487 | Shen et al.(2002), Gu et al.(2003) | |
| February 2004 | 9.8 | 9479 | He et al.(2006) | |
| October 2006 | 9 | 14,300 | Zhu et al.(2010) | |
| February 2014 | 19 | 10,900 | Wang (2016) | |
| November 3-12, 2009 | Dongfengxisha | 10 | 14,030 | Shanghai Water Affairs Bureau |
| November 15-24, 2013 | 10 | 12,240 | ||
| December 3-11, 2013 | 9 | 12,500 | ||
| December 17-25, 2013 | 9 | 11,365 | ||
| January 2-10, 2014 | 9 | 12,144 | ||
| January 30-February 22, 2014 | 24 | 11,138 |
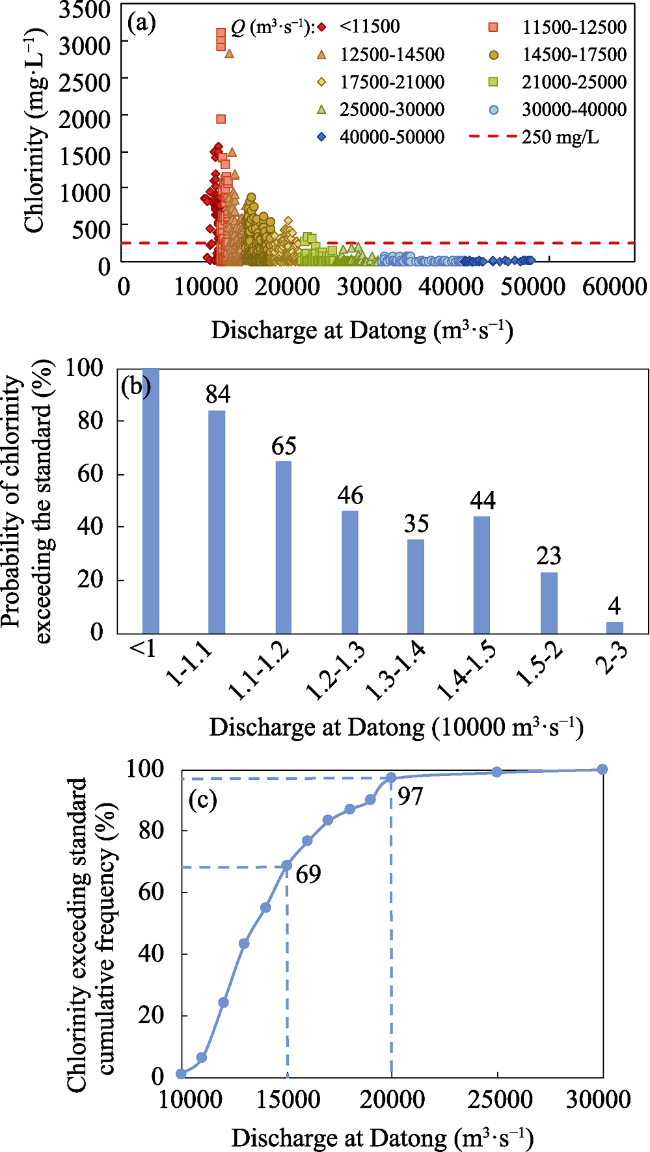
Figure 7 Characteristics of saltwater intrusion under different river discharges: (a) relationship between daily discharge at Datong station and daily chlorinity at the Dongfengxisha observation point, (b) probability of chlorinity exceeding the drinking water standard in each discharge interval, and (c) the discharge at Datong station vs the cumulative probability of excessive chlorinity |
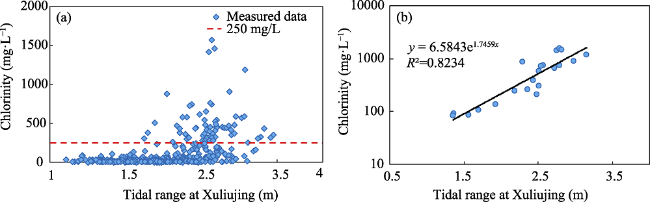
Figure 8 Tidal range of Xuliujing station vs chlorinity of Dongfengxisha observation point: (a) data of all discharges, and (b) data corresponding to the river discharge of approximately 11,000 m3/s |
Table 5 Corresponding tidal ranges of Xuliujing station (∆Hc) and discharges of Datong station (Qc) to maintain the drinking water standard |
| Chlorinity of Dongfengxisha observation point (mg/L) | Discharge at Datong station Qc (m³/s) | Daily tidal range of Xuliujing station ∆Hc (m) |
|---|---|---|
| 250 | 11,000 | 2.05 |
| 250 | 12,000 | 2.24 |
| 250 | 13,000 | 2.42 |
| 250 | 15,000 | 2.61 |
Figure 9 Accumulative frequency of the tidal range of Xuliujing station |
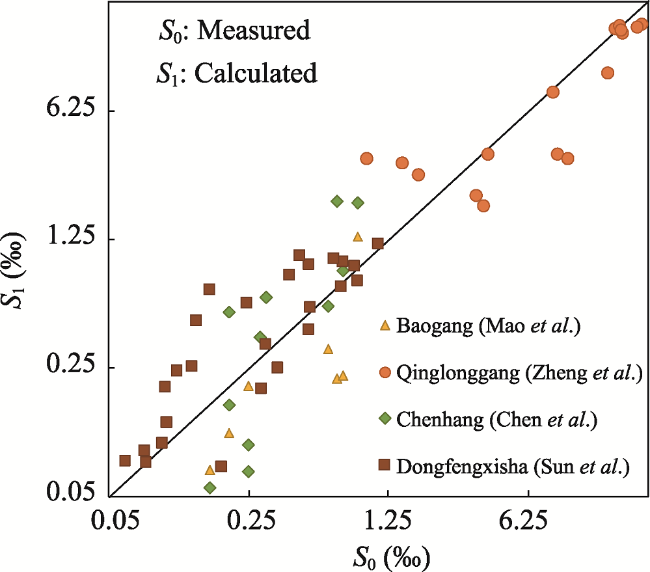
Table 6 Determination coefficient between measured and calculated salinity using different tidal range estimation modes and different empirical salinity prediction models |
| Empirical salinity prediction model | Tidal range estimation mode | Determination coefficient R2 | Tidal range estimation mode | Determination coefficient R2 |
|---|---|---|---|---|
| Mao et al. (1993) | Qinglonggang station, curve B | 0.45 | Qinglonggang station, curve C | 0.51 |
| Zheng et al. (2014) | Qinglonggang station, curve B | 0.85 | Qinglonggang station, curve C | 0.88 |
| Chen et al. (2013b) | Qinglonggang station, curve B | 0.7 | Qinglonggang station, curve C | 0.74 |
| Sun et al. (2017) | Xuliujing station, curve B | 0.8 | Xuliujing station, curve C | 0.81 |
Figure 10 Comparison of the measured and calculated salinity values using different empirical models |
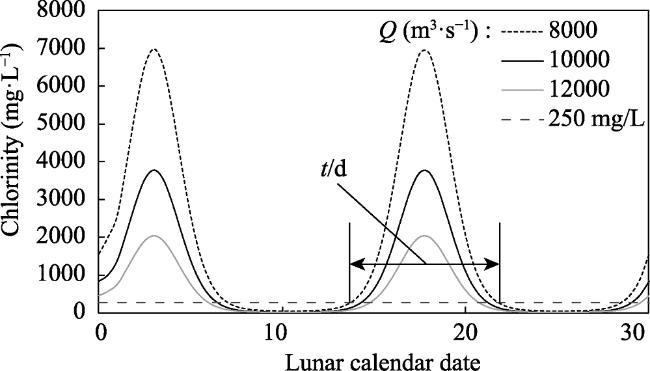
Figure 11 Calculated chlorinity processes of the Dongfengxisha observation point under different river discharges (t denotes the duration when chlorinity exceeds the required drinking water standard) |
Table 7 Critical discharges calculated using different empirical models |
| Empirical model | Location of chlorinity prediction | Tidal range estimation mode | Calculated critical discharge (m3/s) |
|---|---|---|---|
| Mao et al. (1993) | Baogang | Curve C | 12,000 |
| Chen et al. (2013b) | Chenhang | Curve C | 11,000 |
| Sun et al. (2017) | Dongfengxisha | Curve C | 11,500 |
| [1] |
|
| [2] |
|
| [3] |
|
| [4] |
Changjiang Water Resources Commission (CWRC), 2005. Technical Report on Comprehensive Improvement and Development Planning of the Yangtze River Estuary. Wuhan: Changjiang Water Resources Commission. (in Chinese)
|
| [5] |
|
| [6] |
|
| [7] |
|
| [8] |
|
| [9] |
|
| [10] |
|
| [11] |
|
| [12] |
|
| [13] |
|
| [14] |
|
| [15] |
|
| [16] |
|
| [17] |
|
| [18] |
|
| [19] |
|
| [20] |
|
| [21] |
|
| [22] |
|
| [23] |
|
| [24] |
|
| [25] |
|
| [26] |
|
| [27] |
|
| [28] |
|
| [29] |
|
| [30] |
|
| [31] |
|
| [32] |
|
| [33] |
|
| [34] |
State Environmental Protection Administration of China, 2002. Standard of Surface Water Environment Quality (GB3838-2002). Beijing: China Environmental Science Press. (in Chinese)
|
| [35] |
|
| [36] |
|
| [37] |
|
| [38] |
|
| [39] |
|
| [40] |
|
| [41] |
|
| [42] |
|
| [43] |
|
| [44] |
|
| [45] |
|
| [46] |
|
/
| 〈 |
|
〉 |