
Journal of Geographical Sciences >
Spatio-temporal pattern and driving forces of urbanization in China’s border areas
|
Song Zhouying (1982–), PhD and Associate Professor, specialized in economic geography and regional studies. E-mail: songzy@igsnrr.ac.cn |
Received date: 2020-01-02
Accepted date: 2020-02-20
Online published: 2020-07-25
Supported by
National Natural Science Foundation of China(41871120)
Priority Research Program of Chinese Academy of Sciences(XDA20010102)
Copyright
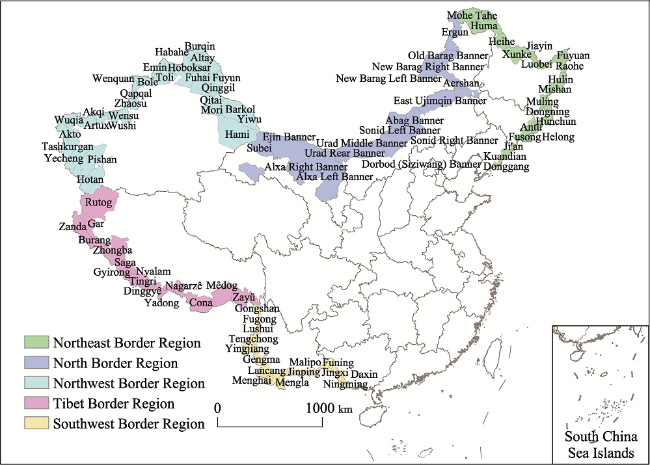
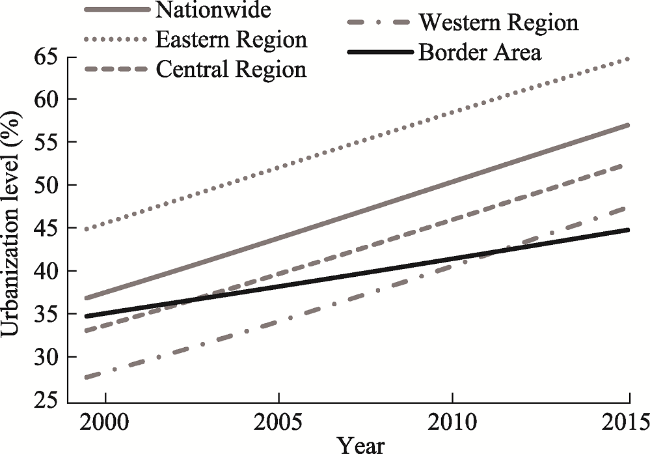
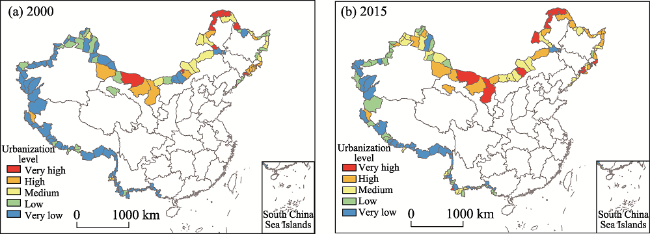
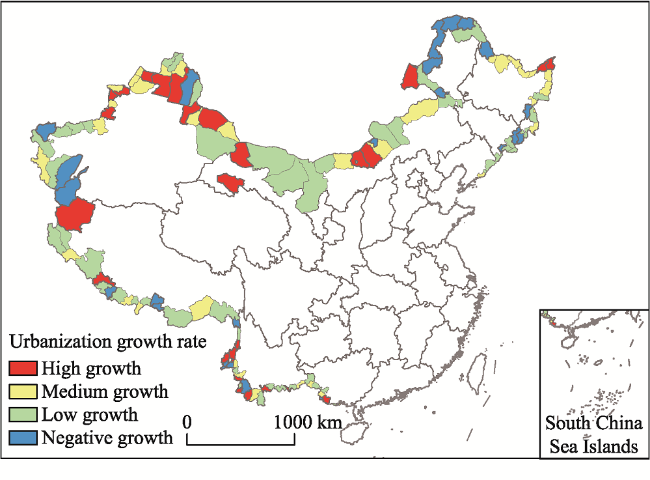
Border area is not only an important gateway for inland opening-up, but also an important part of completing the building of a moderately prosperous society and optimizing national urban spatial pattern in China. Due to the location, natural resources endowment, and traffic accessibility, the urbanization speed is relatively slow in border areas. Therefore, it is a special area that needs to pay close attention to, especially under the background of the Belt and Road Initiative and China’s regional coordinated development program. Based on the county-level data from 2000 to 2015, this paper tries to analyze the spatio-temporal pattern of urbanization in 134 border counties, and applies geographical detector method to study the driving forces of urbanization in border areas. Conclusions are as follows: (1) From 2000 to 2015, urbanization rate in border areas has been lower than the national average, and the gap has been widening. Some border counties in southern Xinjiang, Tibet, northeast of Inner Mongolia, and Yunnan, are even facing the problem of population loss. (2) In the same period, urbanization rate in the northwestern and southwestern border is low, while their urbanization rate grows relatively faster comparing with other border counties; urbanization rate in Tibet border is the lowest and grows relatively slowly; urbanization rate in the northeastern and northern border is slightly higher, but it grows slowly or even stagnates. (3) Transportation and industry are the important driving forces of urbanization in border areas, while the driving forces of market is relatively weak. And there are obvious mutual reinforcements among the driving forces, while the effort and explanatory power of resource force increases obviously after interaction. (4) Urbanization rate in the northwestern and southwestern border areas grows relatively fast, with industrial force and transportation force, market force and administrative force as the main driving forces respectively. Tibet border area has the lowest urbanization rate and growth rate, as the driving force of urbanization with strong contribution has not yet formed in Tibet. In the northeastern and northern border areas, the contribution of transportation force to urbanization is greater than other forces, and its interaction with market and industry has obvious effects.
Key words: border area; urbanization; spatio-temporal pattern; driving force; China
SONG Zhouying , ZHU Qiaoling . Spatio-temporal pattern and driving forces of urbanization in China’s border areas[J]. Journal of Geographical Sciences, 2020 , 30(5) : 775 -793 . DOI: 10.1007/s11442-020-1755-2
Table 1 Drivers of urban development in China’s border areas and their weights |
| Indicator | Units | Description | Data source | Weight | |||||
|---|---|---|---|---|---|---|---|---|---|
| Natural force | Average annual precipitation | mm | Measures the livability of climatic conditions via the average annual precipitation of county-level units | China Meteorological Data Service Center (CMDC) | 0.25 | ||||
| Average annual temperature | ℃ | Measures the livability of climatic conditions via the average annual temperature of county-level units | China Meteorological Data Service Center (CMDC) | 0.25 | |||||
| Average altitude | km | Measures the topographic conditions in border areas via average elevation of county-level units | Geospatial Data Cloud | 0.25 | |||||
| Arable land area | ha | Measures the scale of arable land in border areas | China Economic and Social Development Statistics Database | 0.25 | |||||
| Administrative force | Local fiscal expenditure | 10,000 RMB | Measures the administrative and regulatory capacity of local governments | China Statistical Yearbook (County-Level) | 0.3 | ||||
| Public and private fixed-asset investment | 10,000 RMB | Measures the economic capacity of local governments | China Statistical Yearbook (County-Level) | 0.3 | |||||
| Preferential policy index | / | Measures national policy support (at a scale of 0-5 based on the following five policy conditions) 1 = West China Development and Northeast Revitalization programs 2 = Pilot for supporting reforms along borders and pilot for supporting reform of modern agriculture 3 = Border economic cooperation zone, comprehensive free trade zone or “prosperity to border areas and their residents” pilots 4 = Key experimental zones for development and opening up 5 = Cross-border economic cooperation zones | Websites of Ministry of Commerce and National Development and Reform Commission | 0.4 | |||||
| Market force | Total retail sales of consumer goods | 10,000 RMB | Measures the size of domestic markets in border areas | China Statistical Yearbook (County-level) | 0.4 | ||||
| Bilateral trade | 10,000 USD | Measures the level of trade development in border areas | International Trade Centre databases | 0.2 | |||||
| Bilateral economic integration | / | Measures the bilateral trade environment (with integration scores of 0-3) 0 = The two countries have no trade agreement 1 = Both countries have joined economic organizations or agreements, such as WTO, CAFTA, BRI, etc. 2 = Countries are in bilateral trade negotiations 3 = Countries have signed a bilateral free trade agreement | Websites of Ministry of Commerce and National Development and Reform Commission | 0.2 | |||||
| Market opportunities | / | Measures market size, market expectations, etc., of neighboring countries in border areas (expressed as per capita GDP of neighboring country/per capita GDP of border area) | China Statistical Yearbook (County-level) & World Bank databases | 0.2 | |||||
| Industrial force | Industrial output | 10,000 RMB | Measures the level of industrialization | China Statistical Yearbook (County-level) | 0.4 | ||||
| Tourism revenue | Million USD | Measures the level of development of tourism | China Statistical Yearbook | 0.3 | |||||
| GRP | 100 million RMB | Measures overall industrial development | China Statistical Yearbook (County-level) | 0.3 | |||||
| Transportation force | Transport route density | km/km2 | Measures level of transportation access to China’s hinterland (the ratio of the length of transport routes to the administrative area, including road and rail routes) | China Statistical Yearbook | 0.4 | ||||
| Transport status | / | Determines whether a county is an important transportation node in China’s opening up drive | Websites of Ministry of Commerce and National Development and Reform Commission | 0.3 | |||||
| Air transport development | / | Measures the level of aviation development (0-3 assigned based on airport construction) 0 = No airport of category 3C or higher 1 = has a 3C airport 2 = has a 4C airport 3 = has a 4D airport | General Aviation Resource Net of China | 0.3 | |||||
| Social force | Proportion of population made up of ethnic minorities | / | Measures social and cultural integration with neighboring countries | Census | 0.4 | ||||
| Education level | People | Number of primary and secondary school students and ordinary middle school students per 10,000 people | China Statistical Yearbook (County-level) | 0.3 | |||||
| Medical care level | Beds | Number of beds in medical institutions per 10,000 people | China Statistical Yearbook (County-level) | 0.3 | |||||
Figure 1 Study area (China’s border areas) |
Figure 2 Changes in average urbanization level by region, 2000-2015 |
Figure 3 Spatial characteristics of urbanization in China’s border areas, 2000-2015 |
Figure 4 Urbanization growth rate in China’s border areas, 2000-2015 |
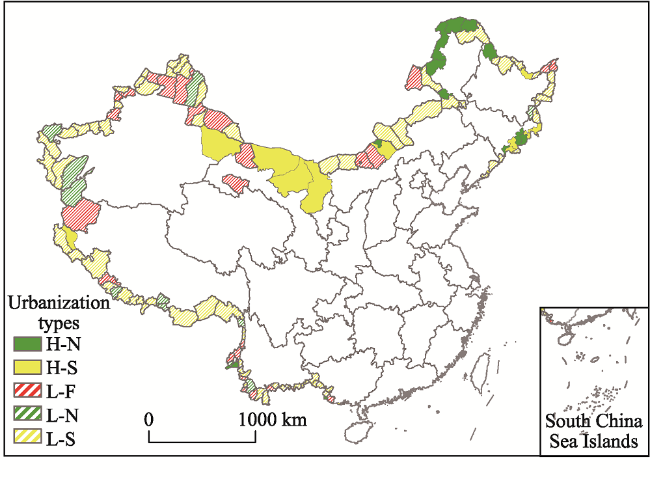
Figure 5 Spatial characteristics of development types for China’s border areas’ urbanization |
Table 2 Factor detection results of urbanization drivers in China’s border areas |
| Natural | Admin. | Market | Indust. | Transp. | Social | |
|---|---|---|---|---|---|---|
| All border areas | 0.103*** | 0.096*** | 0.058*** | 0.204*** | 0.224*** | 0.166*** |
| (0.000) | (0.000) | (0.000) | (0.000) | (0.000) | (0.000) | |
| Northeast | 0.248*** | 0.073*** | 0.018* | 0.014 | 0.133*** | 0.069*** |
| (0.000) | (0.000) | (0.068) | (0.135) | (0.000) | (0.000) | |
| North | 0.092*** | 0.132*** | 0.199*** | 0.039** | 0.190*** | 0.151*** |
| (0.000) | (0.000) | (0.000) | (0.017) | (0.000) | (0.000) | |
| Northwest | 0.063*** | 0.099*** | 0.048*** | 0.232*** | 0.228*** | 0.016* |
| (0.000) | (0.000) | (0.000) | (0.000) | (0.000) | (0.084) | |
| Tibet | 0.114*** | 0.036** | 0.052*** | 0.017 | 0.040 | 0.072*** |
| (0.000) | (0.042) | (0.007) | (0.324) | (0.256) | (0.000) | |
| Southwest | 0.037*** | 0.173*** | 0.198*** | 0.064*** | 0.138*** | 0.108*** |
| (0.000) | (0.000) | (0.000) | (0.000) | (0.000) | (0.000) |
Note: The p value corresponding to each q statistic above is in parentheses. ***, **, * indicate significance at 1%, 5% and 10%, respectively. |
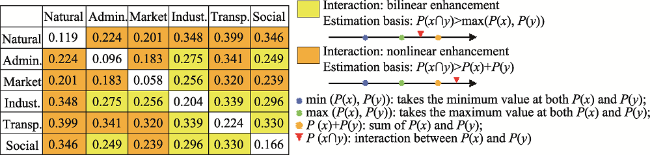
Figure 6 Interaction detection results of urbanization drivers in China’s border areasNote: The diagonal values in the table (in white boxes) are the individual explanatory powers (q statistics) of each driver, and the non-diagonal values are the explanatory power (q statistics) of interactions between two driving forces. |
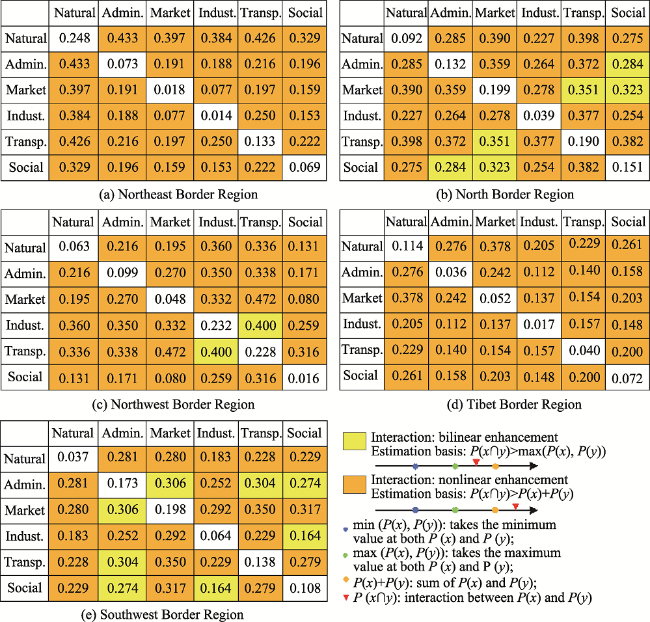
Figure 7 Interaction detection results of urbanization drivers in China’s border areasNote: The diagonal values in the table (in white boxes) are the individual explanatory powers (q statistics) of each driver, and the non-diagonal values are the explanatory power (q statistics) of interactions between two driving forces. |
| [1] |
|
| [2] |
|
| [3] |
|
| [4] |
|
| [5] |
|
| [6] |
|
| [7] |
|
| [8] |
|
| [9] |
|
| [10] |
|
| [11] |
|
| [12] |
|
| [13] |
|
| [14] |
|
| [15] |
|
| [16] |
|
| [17] |
|
| [18] |
|
| [19] |
|
| [20] |
|
| [21] |
|
| [22] |
|
| [23] |
|
| [24] |
|
| [25] |
|
| [26] |
|
| [27] |
|
| [28] |
|
| [29] |
|
| [30] |
|
| [31] |
|
| [32] |
|
| [33] |
|
| [34] |
|
| [35] |
|
| [36] |
|
| [37] |
|
| [38] |
|
| [39] |
|
/
| 〈 |
|
〉 |