
Journal of Geographical Sciences >
Population, urbanization and economic scenarios over the Belt and Road region under the Shared Socioeconomic Pathways
|
Jing Cheng (1992–), PhD Candidate, specialized in climate risk assessment. E-mail: jingc1992@163.com |
Received date: 2018-12-20
Accepted date: 2019-03-26
Online published: 2020-03-25
Supported by
National Key Research and Development Program of China MOST, No(2017YFA0603701)
Chinese-Pakistan cooperative project jointly funded by NSFC and PSF, No(41661144027)
The CMA Climate Change Science Fund(201722)
The CMA Climate Change Science Fund(201810)
Copyright
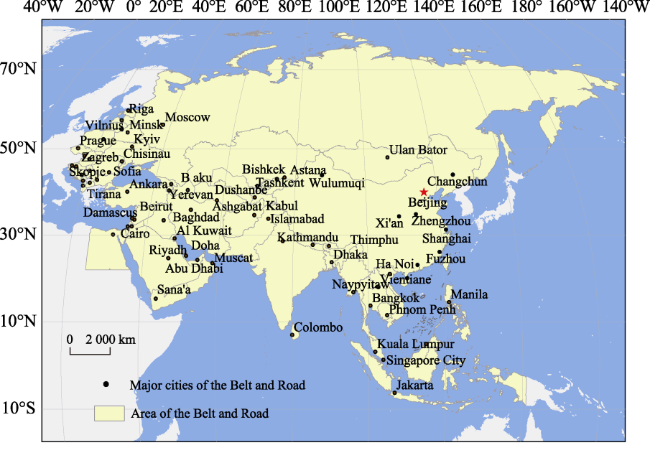
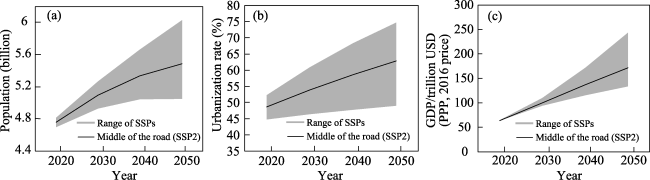
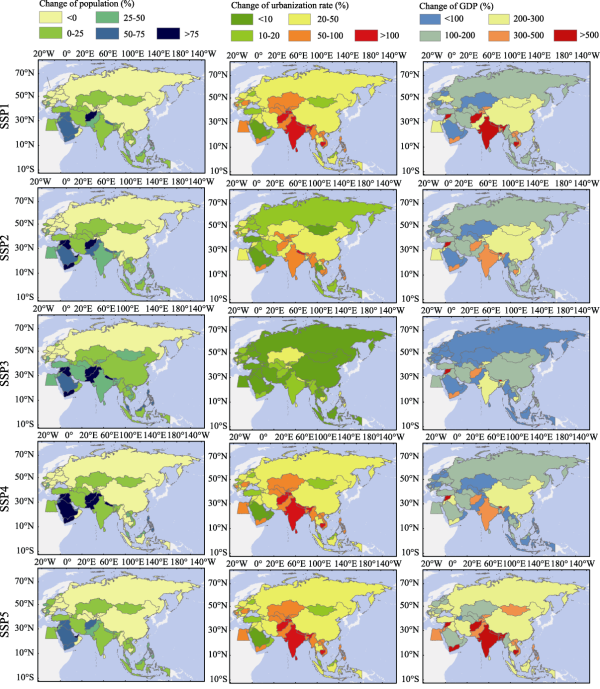
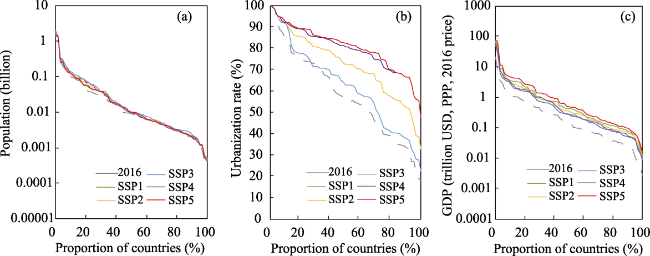
The countries throughout the Belt and Road region account for more than 60% of the world’s population and half of the global economy. Future changes in this area will have significant influences on the global economic growth, industrial structure and resource allocation. In this study, the proportion of the urban population to the total population and the gross domestic product were used to represent the levels of urbanization and economic development, respectively. The population, urbanization and economic levels of the Belt and Road countries for 2020-2050 were projected under the framework of the IPCC's shared socioeconomic pathways (SSPs), and the following conclusions are drawn. (1) The population, urbanization and economic levels in the Belt and Road region will likely increase under all five pathways. The population will increase by 2%-8%/10a during 2020-2050 and reach 5.0-6.0 billion in 2050. Meanwhile, the urbanization rate will increase by 1.4%-7.5%/10a and reach 49%-75%. The GDP will increase by 17%-34%/10a and reach 134-243 trillion USD. (2) Large differences will appear under different scenarios. The SSP1 and SSP5 pathways demonstrate relatively high urbanization and economic levels, but the population size is comparatively smaller; SSP3 shows the opposite trend. Meanwhile, the economy develops slowly under SSP4, but it has a relatively high urbanization level, while SSP2 exhibits an intermediate trend. (3) In 2050, the population will increase relative to 2016 in most countries, and population size in the fastest growing country in Central Asia and the Middle East countries will be more than double. Urbanization will develop rapidly in South Asia, West Asia and Central Asia, and will increase by more than 150% in the fastest growing countries. The economy will grow fastest in South Asia, Southeast Asia and West Asia, and increase by more than 10 times in some counties with rapid economic development.
JING Cheng , TAO Hui , JIANG Tong , WANG Yanjun , ZHAI Jianqing , CAO Lige , SU Buda . Population, urbanization and economic scenarios over the Belt and Road region under the Shared Socioeconomic Pathways[J]. Journal of Geographical Sciences, 2020 , 30(1) : 68 -84 . DOI: 10.1007/s11442-020-1715-x
Figure 1 Location of the Belt and Road region |
Table 1 Assumptions of the key influencing factors on the population and economy for the SSPs |
| SSP1 | SSP2 | SSP3 | SSP4 | SSP5 | |
|---|---|---|---|---|---|
| Fertility | Low | Medium | High | Low | Low |
| Mortality | Low | Medium | High | Medium | Low |
| Migration | Medium | Medium | Low | Medium | High |
| Education | High (FT) | Medium (GET) | Low (CER) | Low (CER) | High (FT) |
| TFP growth | Medium | Medium | Low | Medium | High |
(FT: fast track, GET: global education trend, CER: constant enrolment rate, TFP: total factor productivity) |
Table 2 Assumptions of total fertility rate for the urban and rural populations in China |
| Year | 2010 | 2020 | 2030 | 2040 | 2050 | |
|---|---|---|---|---|---|---|
| Urban | Low | 1.19 | 1.24 | 1.29 | 1.25 | 1.21 |
| Medium | 1.19 | 1.61 | 1.61 | 1.61 | 1.61 | |
| High | 1.19 | 1.56 | 1.93 | 1.97 | 2.01 | |
| Rural | Low | 1.19 | 1.35 | 1.51 | 1.46 | 1.42 |
| Medium | 1.64 | 1.89 | 1.89 | 1.89 | 1.89 | |
| High | 1.19 | 1.61 | 1.61 | 1.61 | 1.61 | |
| Total | Low | 1.19 | 1.28 | 1.37 | 1.31 | 1.25 |
| Medium | 1.45 | 1.72 | 1.71 | 1.68 | 1.66 | |
| High | 1.19 | 1.61 | 1.61 | 1.61 | 1.61 |
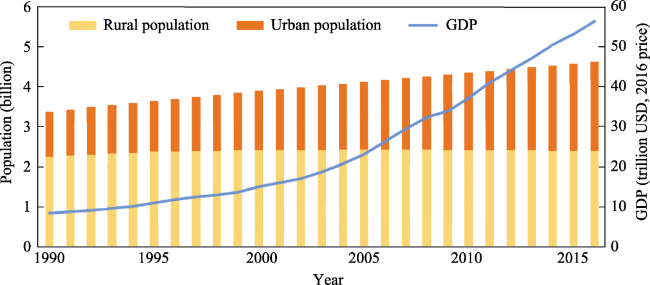
Figure 2 Changes in the population, urbanization level and GDP in the Belt and Road region for 1990-2016 |
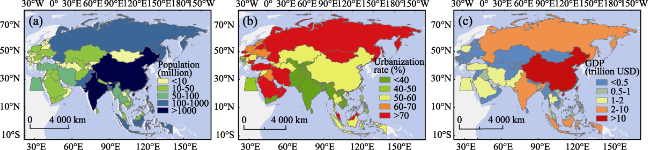
Figure 3 Distribution of the population (a), urbanization (b) and economy (c) in the Belt and Road countries in 2016 |
Figure 4 Projections of the population (a), urbanization (b) and economy (c) in the Belt and Road region for 2020-2050 |
Figure 5 Changes in the population, urbanization and GDP throughout the Belt and Road region in 2050 compared with 2016 |
Table 3 Three countries with the fastest and slowest growth in 2050 with relative to 2016 |
| Countries (Rate of changes) | Population | Urbanization | GDP | |||
|---|---|---|---|---|---|---|
| Top three | Last three | Top three | Last three | Top three | Last three | |
| SSP1 | Bahrain (108%) | Moldova (-40%) | Nepal (195%) | Israel (1%) | TLS (1594%) | Azerbaijan (26%) |
| Afghanistan (75%) | Lebanon (-22%) | Cambodia (167%) | Kuwait (2%) | Syria (1505%) | Singapore (62%) | |
| ARE (72%) | Tajikistan (-19) | Sri Lanka (160%) | Lebanon (5%) | Bhutan (949%) | Kazakhstan (67%) | |
| SSP2 | Bahrain (125%) | Moldova (-39%) | Nepal (103%) | Israel (1%) | Syria (1235%) | Azerbaijan (7%) |
| Afghanistan (117%) | Lebanon (-17%) | Cambodia (87%) | Kuwait (2%) | TLS (977%) | Myanmar (40%) | |
| Yemen (105%) | Belarus (-14) | Tajikistan (82%) | Lebanon (5%) | Bhutan (845%) | Kazakhstan (47%) | |
| SSP3 | Afghanistan (164%) | Moldova (-24%) | Nepal (46%) | Thailand (-21%) | Syria (1235%) | Azerbaijan (-11%) |
| Yemen (152%) | Hungary (-22%) | BIH (41%) | Indonesia (-9%) | TLS (977%) | Myanmar (3%) | |
| TLS (143%) | Poland (-18%) | Cambodia (33%) | Mongolia (-7%) | Bhutan (845%) | Romania (18%) | |
| SSP4 | Afghanistan (153%) | Moldova (-42%) | Nepal (195%) | Israel (1%) | Syria (857%) | Myanmar (-28%) |
| Yemen (149%) | Lebanon (-23%) | Cambodia (167%) | Kuwait (2%) | Bhutan (670%) | Azerbaijan (7%) | |
| Iraq (127%) | Belarus (-20%) | Sri Lanka (160%) | Lebanon (5%) | TLS (442%) | Romania (47%) | |
| SSP5 | Bahrain (144%) | Moldova (-50%) | Nepal (195%) | Israel (1%) | Syria (1888%) | Azerbaijan (63%) |
| Israel (103%) | Tajikistan (-38%) | Cambodia (167%) | Kuwait (2%) | TLS (1621%) | Singapore (99%) | |
| ARE (101%) | Georgia (-27%) | Sri Lanka (160%) | Lebanon (5%) | Bhutan (1265%) | Lithuania (102%) | |
ARE: United Arab Emirates, TLS: Timor-Leste, BIH: Bosnia and Herzegovina |
Figure 6 Comparisons of the annual population (a), urbanization (b) and GDP (c) in the Belt and Road region in 2050 with the 2016 levels |
| 1 |
|
| 2 |
|
| 3 |
|
| 4 |
|
| 5 |
|
| 6 |
|
| 7 |
|
| 8 |
|
| 9 |
|
| 10 |
|
| 11 |
|
| 12 |
|
| 13 |
|
| 14 |
|
| 15 |
|
| 16 |
|
| 17 |
|
| 18 |
|
| 19 |
|
| 20 |
IPCC, 2013. Climate Change 2013: The Physical Science Basis. Contribution of Working Group I to the Fifth Assessment Report of the Intergovernmental Panel on Climate Change. Cambridge, United Kingdom and New York, USA: Cambridge University Press, pp: 1535.
|
| 21 |
|
| 22 |
|
| 23 |
|
| 24 |
|
| 25 |
|
| 26 |
|
| 27 |
|
| 28 |
|
| 29 |
|
| 30 |
|
| 31 |
|
| 32 |
|
| 33 |
|
| 34 |
|
| 35 |
|
| 36 |
|
| 37 |
|
| 38 |
|
| 39 |
National Bureau of Statistics of China(NBSC), 2010. China Statistical Yearbook 2010. Beijing: China Statistics Press. (in Chinese)
|
| 40 |
|
| 41 |
|
| 42 |
|
| 43 |
|
| 44 |
|
| 45 |
|
| 46 |
|
| 47 |
|
| 48 |
|
| 49 |
|
| 50 |
|
| 51 |
|
| 52 |
United Nations (UN), 2011. World Population Prospects The 2010 Revision. New York: Department of Economic and Social Affairs, Population Division.
|
| 53 |
|
| 54 |
|
| 55 |
|
| 56 |
|
| 57 |
|
| 58 |
World Bank (WB>), 2017. World Development Indicators. Washington: World Bank.
|
| 59 |
|
| 60 |
|
| 61 |
|
/
| 〈 |
|
〉 |