
Journal of Geographical Sciences >
Evaluation of Tropical Rainfall Measuring Mission (TRMM) satellite precipitation products for drought monitoring over the middle and lower reaches of the Yangtze River Basin, China
Received date: 2018-12-20
Accepted date: 2019-03-26
Online published: 2020-03-25
Supported by
National Key Research and Development Program of China, No(2017YFA0603704)
National Natural Science Foundation of China, No(51339004)
Copyright
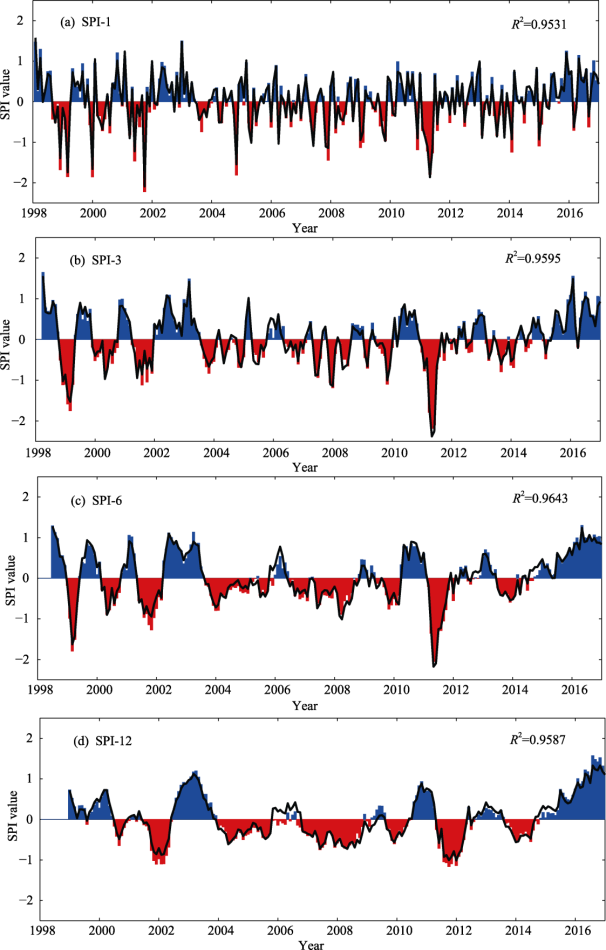
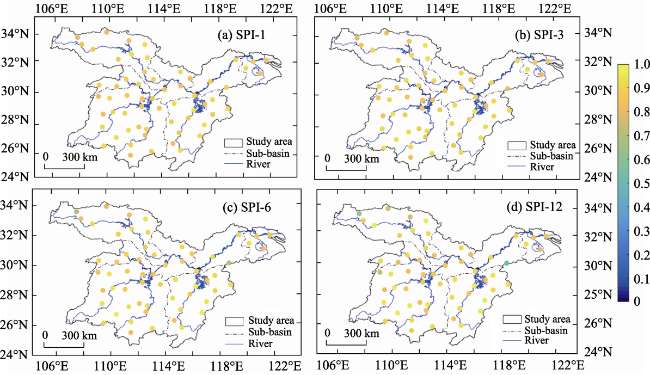
Drought is one of the most frequent and widespread natural disasters and has tremendous agricultural, ecological, societal, and economic impacts. Among the many drought indices, the standardized precipitation index (SPI) based on monthly precipitation data is simple to calculate and has multiscale characteristics. To evaluate the applicability of high spatiotemporal resolution satellite precipitation products for drought monitoring, based on the Tropical Rainfall Measuring Mission (TRMM) products and station-based meteorological data, the SPI values at different time scales (1, 3, 6, and 12 months) were calculated for the period of 1998-2016 in the middle and lower reaches of the Yangtze River Basin (MLRYRB). The temporal correlations show that there is a high degree of consistency between calculations at the different time scales (1, 3, 6 and 12 months) based on the two data sources and that the amplitude of fluctuations decreases with increasing time scale. In addition, the Mann-Kendall (MK) test method was applied to analyze the trends from 1998 to 2016, and the results suggest that wetting trends clearly prevailed over drying trends. Moreover, a correlation analysis of the two data sources based on 60 meteorological stations was performed with the SPI values at different time scales. The correlation coefficients at the short time scales (1, 3, and 6 months) are all greater than 0.7, and the correlation coefficient at the long time scale (12 months) is greater than 0.5. In summary, the results demonstrate that the TRMM 3B43 precipitation product provides a new data source that can be used for reliable drought monitoring in the MLRYRB.
Key words: drought; remote sensing; precipitation; TRMM 3B43; SPI
CHEN Shaodan , ZHANG Liping , ZHANG Yanjun , GUO Mengyao , LIU Xin . Evaluation of Tropical Rainfall Measuring Mission (TRMM) satellite precipitation products for drought monitoring over the middle and lower reaches of the Yangtze River Basin, China[J]. Journal of Geographical Sciences, 2020 , 30(1) : 53 -67 . DOI: 10.1007/s11442-020-1714-y
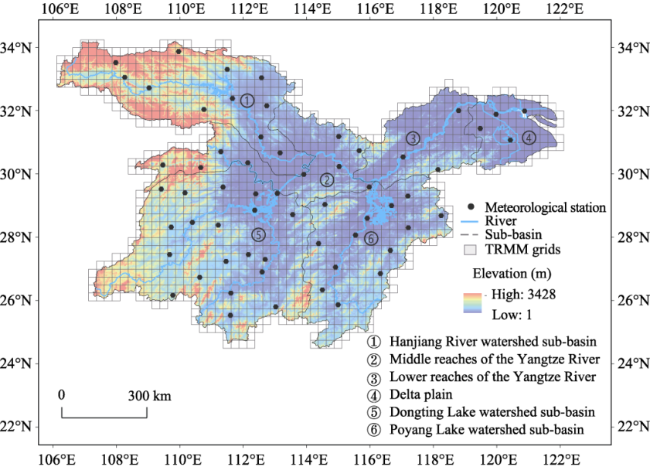
Figure 1 Location of the MLRYRB and distribution of meteorological stations |
Table 1 Drought classification based on SPI values |
| SPI value | Drought category |
|---|---|
| (2.0, +∞) | Extreme wet |
| (1.5, 2.0] | Severe wet |
| (1.0, 1.5] | Moderate wet |
| (-1.0, 1.0] | Normal |
| (-1.5, -1.0] | Moderate drought |
| (-2.0, -1.5] | Severe drought |
| (-∞, -2.0] | Extreme drought |
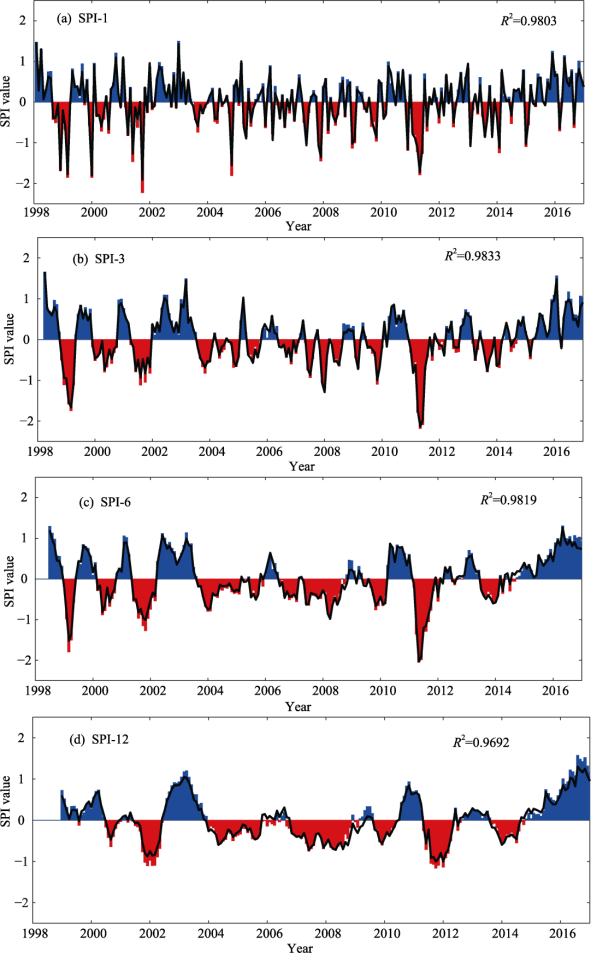
Figure 2 SPI time series calculated from the TRMM 3B43 data (blue and red shaded bars) and station data (solid line) at different time scales: (a) 1 month; (b) 3 months; (c) 6 months; and (d) 12 months |
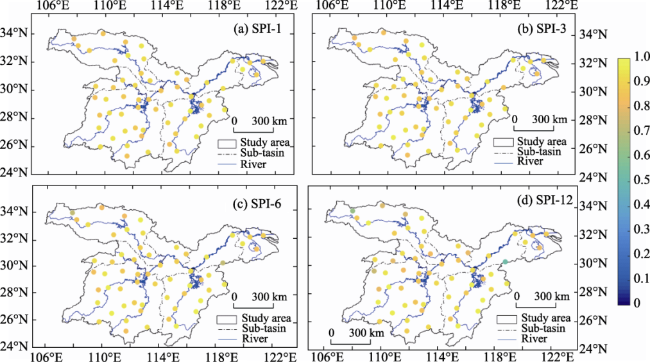
Figure 3 Correlation coefficients of the SPI values calculated with the TRMM 3B43 products and the weather station data |
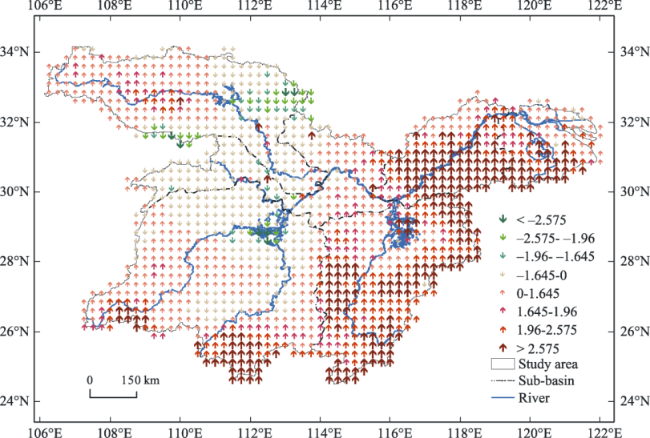
Figure 4 Spatial distribution of the SPI value trends at the 3-month time scale in the MLRYRB |
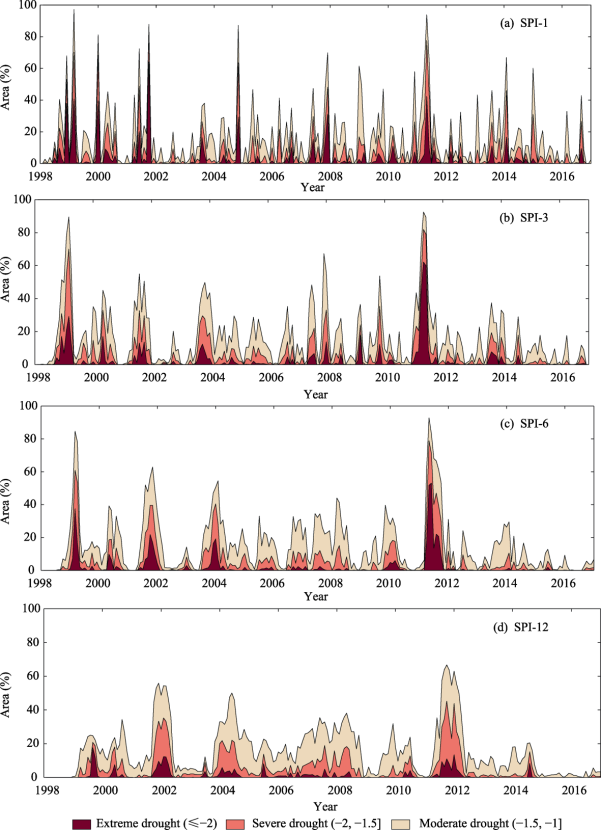
Figure 5 Temporal variability in the SPI values and the drought events of different severity grades from 1998-2016 |
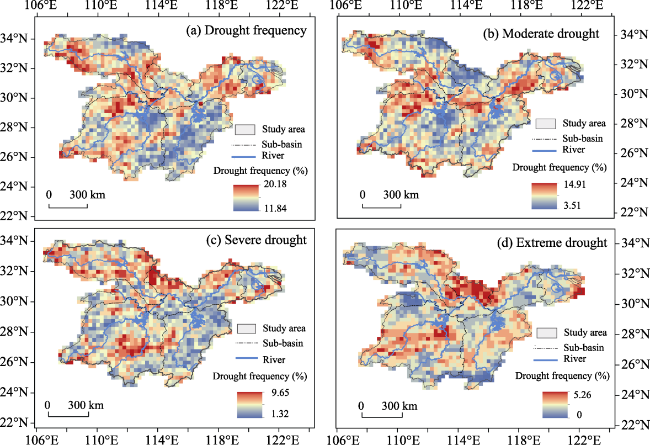
Figure 6 Frequency of drought events and different drought levels (moderate drought, severe drought and extreme drought) based on the SPI values at the 3-month time scale in the MLRYRB from 1998 to 2016 |
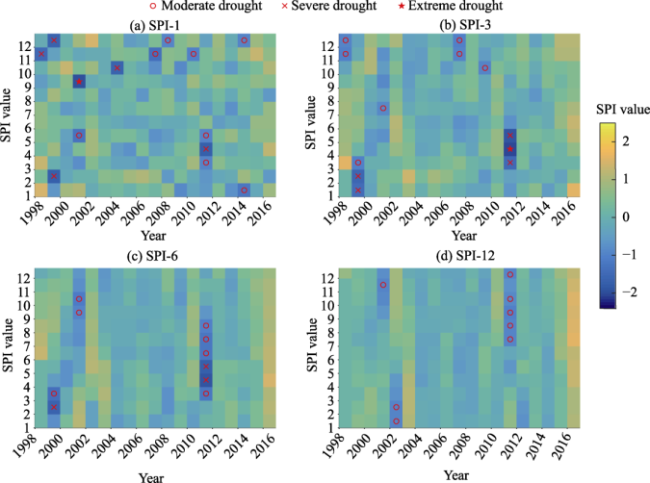
Figure 7 Temporal evolution based on the TRMM 3B43-derived SPI values for different drought conditions (moderate, severe and extreme) at different time scales (1, 3, 6 and 12 months) |
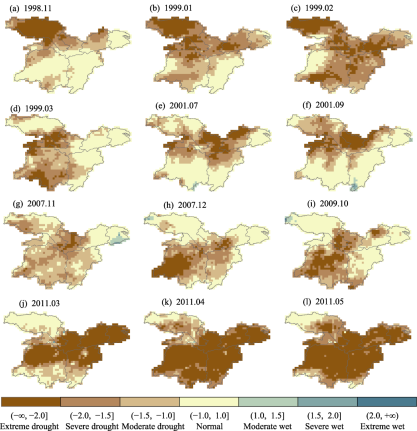
Figure 8 Spatial pattern of typical drought events based on the SPI values during the period of 1998-2016 |
Figure 9 SPI time series calculated from the TRMM 3B43 data (blue and red shaded bars) and station data (solid line) based on the 56-year time series at different time scales |
Figure 10 Correlation coefficients for SPI values calculated with the TRMM 3B43 product and station data based on the 56-year time series |
| 1 |
|
| 2 |
|
| 3 |
|
| 4 |
|
| 5 |
|
| 6 |
|
| 7 |
|
| 8 |
|
| 9 |
|
| 10 |
|
| 11 |
|
| 12 |
|
| 13 |
|
| 14 |
|
| 15 |
|
| 16 |
|
| 17 |
|
| 18 |
|
| 19 |
|
| 20 |
|
| 21 |
|
| 22 |
|
| 23 |
|
| 24 |
|
| 25 |
|
| 26 |
|
| 27 |
|
| 28 |
|
| 29 |
|
| 30 |
|
| 31 |
|
| 32 |
|
| 33 |
|
| 34 |
|
| 35 |
|
/
| 〈 |
|
〉 |