
Journal of Geographical Sciences >
Spatiotemporal variations of aridity index over the Belt and Road region under the 1.5℃ and 2.0℃ warming scenarios
|
Zhou Jian (1994‒), Master Candidate, specialized in the climate change impact assessment. E-mail: zhoujian941208@163.com |
Received date: 2018-12-20
Accepted date: 2019-03-26
Online published: 2020-03-25
Supported by
National Key Research and Development Program of China, No(2017YFA0603701)
Chinese-Pakistan cooperative project jointly funded by NSFC and PSF, No(41661144027)
The CMA Climate Change Science Fund(CCSF 201722)
The CMA Climate Change Science Fund(201810)
Copyright
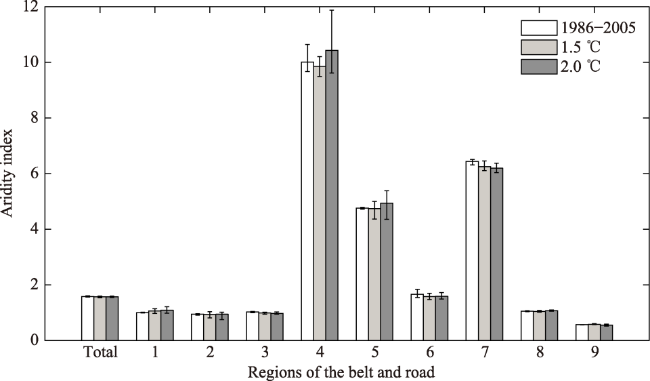
Aridity index reflects the exchanges of energy and water between the land surface and the atmosphere, and its variation can be used to forecast drought and flood patterns, which makes it of great significance for agricultural production. The ratio of potential evapotranspiration and precipitation is applied to analyse the spatial and temporal distributions of the aridity index in the Belt and Road region under the 1.5℃ and 2.0℃ global warming scenarios on the basis of outputs from four downscaled global climate models. The results show that: (1) Under the 1.5℃ warming scenario, the area-averaged aridity index will be similar to that in 1986-2005 (around 1.58), but the changes vary spatially. The aridity index will increase by more than 5% in Central-Eastern Europe, north of West Asia, the monsoon region of East Asia and northwest of Southeast Asia, while it is projected to decrease obviously in the southeast of West Asia. Regarding the seasonal scale, spring and winter will be more arid in South Asia, and the monsoon region of East Asia will be slightly drier in summer compared with the reference period. While, West Asia will be wetter in all seasons, except winter. (2) Relative to 1986-2005, both areal averaged annual potential evapotranspiration and precipitation are projected to increase, and the spatial variation of aridity index will become more obvious as well at the 2.0℃ warming level. Although the aridity index over the entire region will be maintained at approximately 1.57 as that in 1.5℃, the index in Central-Eastern Europe, north of West Asia and Central Asia will grow rapidly at a rate of more than 20%, while that in West Siberia, northwest of China, the southern part of South Asia and West Asia will show a declining trend. At the seasonal scale, the increase of the aridity index in Central-Eastern Europe, Central Asia, West Asia, South Asia and the northern part of Siberia in winter will be obvious, and the monsoon region in East Asia will be drier in both summer and autumn. (3) Under the scenario of an additional 0.5℃ increase in global temperature from 1.5℃ to 2.0℃, the aridity index will increase significantly in Central Asia and north of West Asia but decrease in Southeast Asia and Central Siberia. Seasonally, the aridity index in the Belt and Road region will slightly increase in all other seasons except spring. Central Asia will become drier annually at a rate of more than 20%. The aridity index in South Asia will increase in spring and winter, and that in East Asia will increase in autumn and winter. (4) To changes of the aridity index, the attribution of precipitation and potential evapotranspiration will vary regionally. Precipitation will be the major influencing factor over southern West Asia, southern South Asia, Central-Eastern Siberia, the non-monsoon region of East Asia and the border between West Asia and Central Asia, while potential evapotranspiration will exert greater effects over Central-Eastern Europe, West Siberia, Central Asia and the monsoon region of East Asia.
ZHOU Jian , JIANG Tong , Su Buda , WANG Yanjun , TAO Hui , QIN Jiancheng , ZHAI Jianqing . Spatiotemporal variations of aridity index over the Belt and Road region under the 1.5℃ and 2.0℃ warming scenarios[J]. Journal of Geographical Sciences, 2020 , 30(1) : 37 -52 . DOI: 10.1007/s11442-020-1713-z
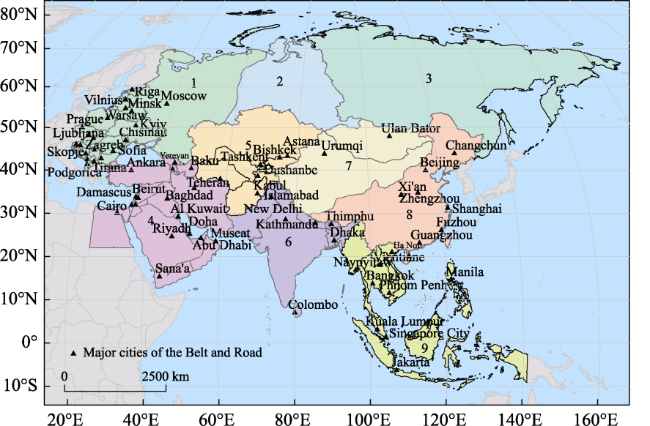
Figure 1 The Belt and Road sub-regions: 1. Central-Eastern Europe; 2. West Siberia; 3. Central-Eastern Siberia; 4. West Asia; 5. Central Asia; 6. South Asia; 7. Non-monsoon region of East Asia; 8. Monsoon region of East Asia; 9. Southeast Asia |
Table 1 Basic information on the four global climate models (GCMs) |
| Climate model | Research institute | Original horizontal resolution |
|---|---|---|
| GFDL-ESM2M | Geophysical Fluid Dynamics Laboratory | 144´90 |
| HadGEM2-ES | Hadley Centre for Climate Prediction and Research | 192´145 |
| IPSL-CM5A-LR | L’Institut Pierre-Simon Laplace | 96´96 |
| MIROC5 | Atmosphere and Ocean Research Institute | 256´128 |
Note: Horizontal resolution indicates the number of longitudinal grids × the number of latitudinal grids. |
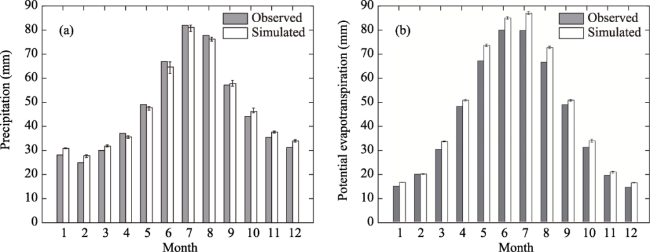
Figure 2 Comparison of GCM ensemble mean with observation in the Belt and Road region for 1961-2005: multi-year averaged monthly precipitation (a) and potential evapotranspiration (b)Note: The upper and lower limits represent the range of climate models. The same applies to Figures 4 and 6. |
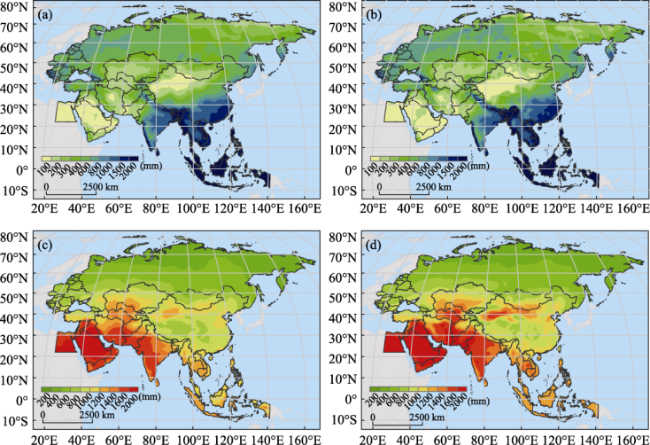
Figure 3 Spatial distributions of annual precipitation and potential evapotranspiration for 1961-2005: observed and simulated precipitation (a-b); observed and simulated potential evapotranspiration (c-d) |
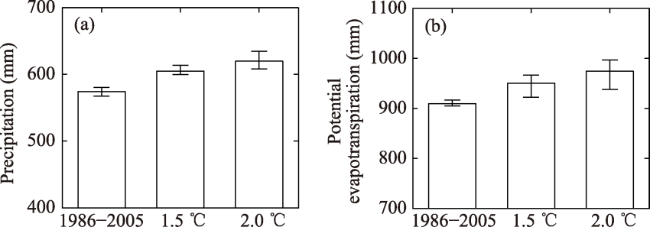
Figure 4 Comparison of precipitation (a) and potential evapotranspiration (b) in 1986-2005, 1.5℃ and 2.0℃ global warming levels over the Belt and Road region |
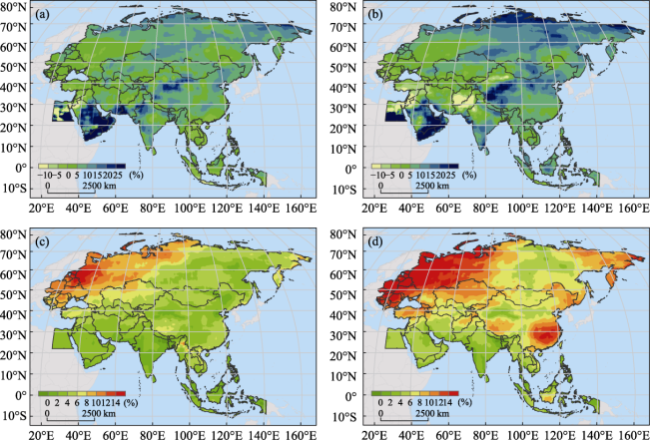
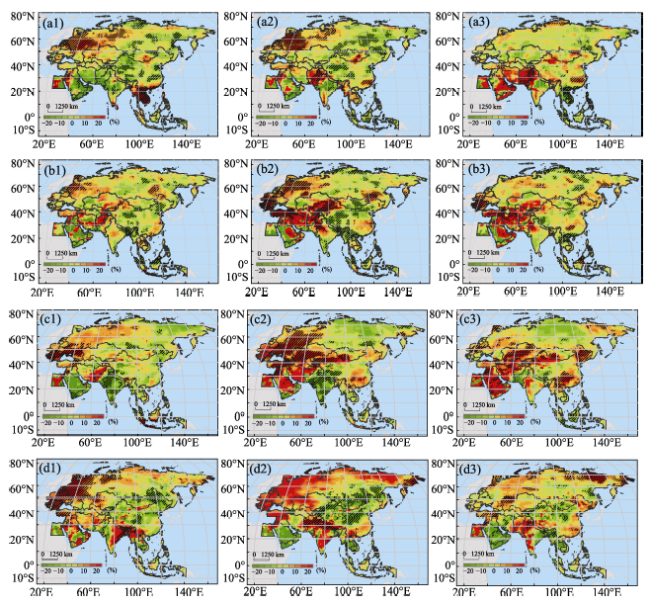
Figure 5 Changes in precipitation (a-b) and potential evapotranspiration (c-d) under the 1.5℃ and 2.0℃ global warming scenarios relative to the reference period over the Belt and Road region: (a) and (c) show the changes in precipitation and potential evapotranspiration under the 1.5℃ scenario compared to the reference period; (b) and (d) show the changes in precipitation and potential evapotranspiration under the 2.0℃ scenario compared to the reference period |
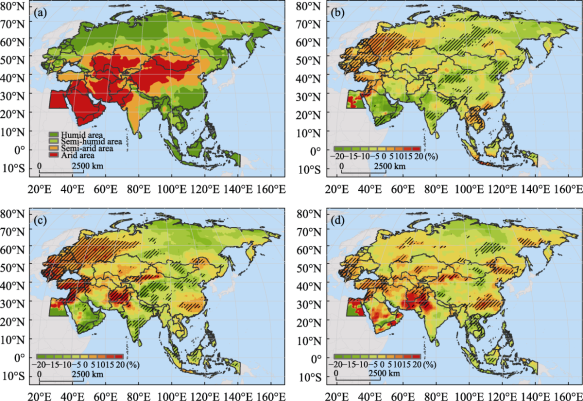
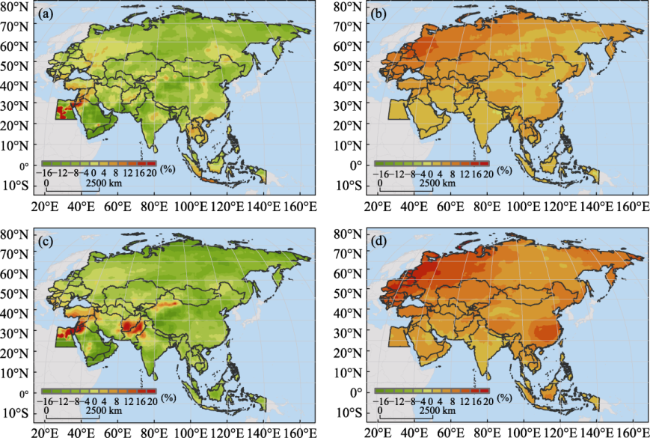
Figure 7 Spatial distribution of the aridity index in the Belt and Road region: (a) in 1986-2005; (b) changes in the 1.5℃ with relative to the reference period; (c) changes in the 2.0℃ with relative to the reference period; (d) changes in the 2.0℃ with relative to the 1.5℃ Note: Dashes in the figures represent areas with significant changes at p<0.1. This also applies to Figure 9. |
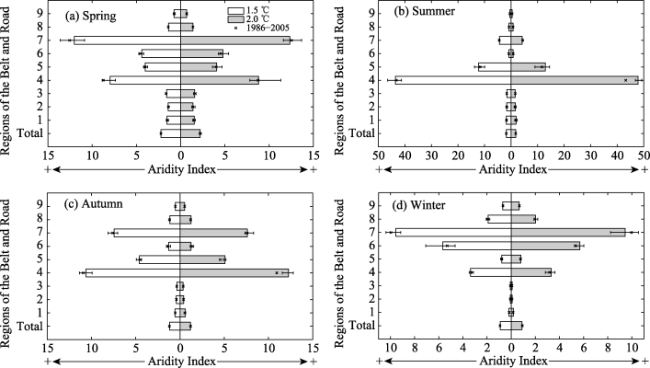
Figure 8 Seasonal aridity index changes in the Belt and Road region under the 1.5℃ and 2.0℃ global warming scenarios: (a) spring, (b) summer, (c) autumn, and (d) winter Note: The black mark (×) above the bars represents the multi-model ensemble mean in 1986-2005. |
Figure 9 Relative changes of the seasonal aridity index under the 1.5℃ and 2.0℃ warming scenarios: (a) spring, (b) summer, (c) autumn, (d) and winter. (1-3) denote the 1.5℃ scenario relative to the reference period, the 2.0℃ scenario relative to the reference period, and the 2.0℃ scenario relative to the 1.5℃ scenario, respectively. |
Figure 10 Changes in the aridity index attributable to precipitation (a, c) and potential evapotranspiration (b, d) under the 1.5℃ scenario (a, b) and 2.0℃ scenario (c, d) relative to 1986-2005 |
| 1 |
|
| 2 |
|
| 3 |
|
| 4 |
|
| 5 |
|
| 6 |
|
| 7 |
|
| 8 |
|
| 9 |
|
| 10 |
|
| 11 |
|
| 12 |
|
| 13 |
|
| 14 |
|
| 15 |
|
| 16 |
|
| 17 |
|
| 18 |
|
| 19 |
|
| 20 |
IPCC, 2013. Climate Change 2013: The Physical Science Basis. IPCC Working Group 1 Contribution to AR5. Cambridge. UK, New York, USA: Cambridge University Press.
|
| 21 |
IPCC, 2014. Climate Change 2014: Synthesis Report, in: Contribution of Working Groups I, II and III to the Fifth Assessment Report of the Intergovernmental Panel on Climate Change, IPCC Geneva, Switzerland, 151.
|
| 22 |
|
| 23 |
|
| 24 |
|
| 25 |
|
| 26 |
|
| 27 |
|
| 28 |
|
| 29 |
|
| 30 |
|
| 31 |
|
| 32 |
|
| 33 |
|
| 34 |
|
| 35 |
|
| 36 |
|
| 37 |
|
| 38 |
|
| 39 |
|
| 40 |
|
| 41 |
|
| 42 |
|
| 43 |
|
| 44 |
|
| 45 |
|
| 46 |
|
| 47 |
|
| 48 |
|
| 49 |
|
/
| 〈 |
|
〉 |