
Journal of Geographical Sciences >
Scenarios of land cover in Eurasia under climate change
|
Fan Zemeng, PhD, specialized in ecological modelling and system simulation. E-mail: fanzm@lreis.ac.cn |
Received date: 2018-06-15
Accepted date: 2019-02-28
Online published: 2020-03-25
Supported by
National Key R&D Program of China, No(2017YFA0603702)
National Key R&D Program of China, No(2018YFC0507200)
National Natural Science Foundation of China, No(41421001)
National Natural Science Foundation of China, No(41271406)
Innovation Project of LREIS, No.(O88RA600YA)
Copyright
The method for surface modelling of land cover scenarios (SMLCS) has been improved to simulate the scenarios of land cover in Eurasia. On the basis of the observation monthly climatic data observed from 2127 weather stations in Eurasia during 1981-2010, the climatic scenarios data of RCP26, RCP45 and RCP85 scenarios released by CMIP5, and the land cover current data of Eurasia in 2010, the land cover scenarios of Eurasia were respectively simulated. The results show that most land cover types would generally have similar changing trends in the future, but with some difference in different periods under the three scenarios of RCP26, RCP45 and RCP85. Deciduous needleleaf forest, mixed forest, shrub land, wetlands and snow and ice would generally decrease in Eurasia during 2010-2100. Snow and ice would have the fastest decreasing rate that would decrease by 37.42% on average. Shrub land would have the slowest decreasing rate that would decrease by 5.65% on average. Water bodies would have the fastest increasing rate that would increase by 28.78% on average. Barren or sparsely vegetated land would have the slowest increasing rate that would increase by 0.76%. Moreover, the simulated results show that climate change would directly impact on land cover change in Eurasia.
Key words: SMLCS; climate change; land cover; scenarios; Eurasia
FAN Zemeng , BAI Ruyu , YUE Tianxiang . Scenarios of land cover in Eurasia under climate change[J]. Journal of Geographical Sciences, 2020 , 30(1) : 3 -17 . DOI: 10.1007/s11442-020-1711-1
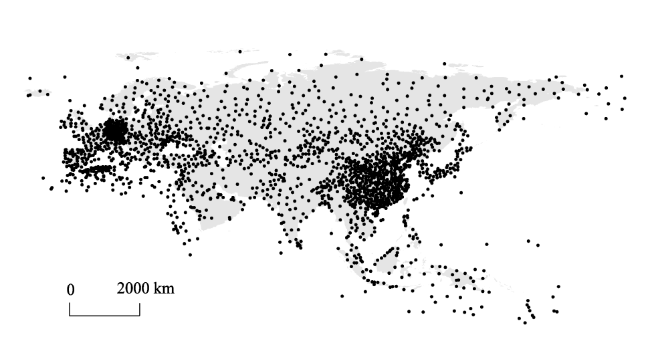
Figure 1 Location of the weather observation stations in Eurasia |
Table 1 Transition probability matrix from HLZ types in TO on an average to land cover types in 2010 |
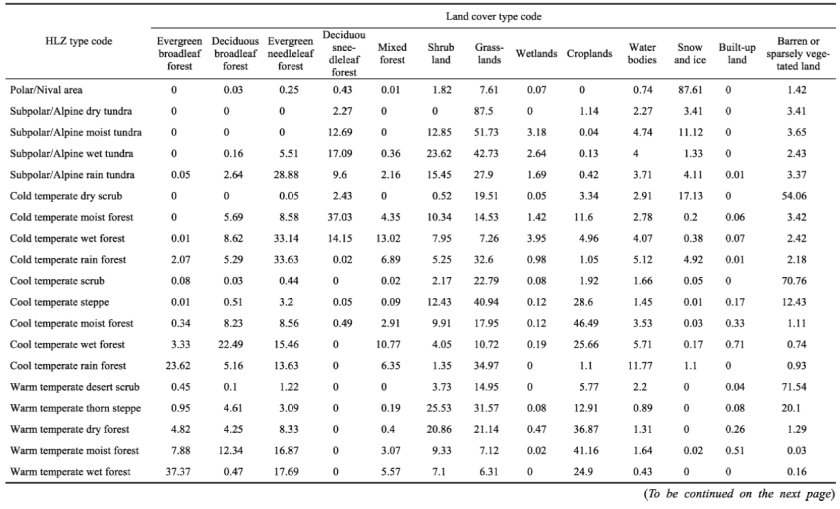 |
Table 1 Transition probability matrix from HLZ types in TO on an average to land cover types in 2010 (Continued) |
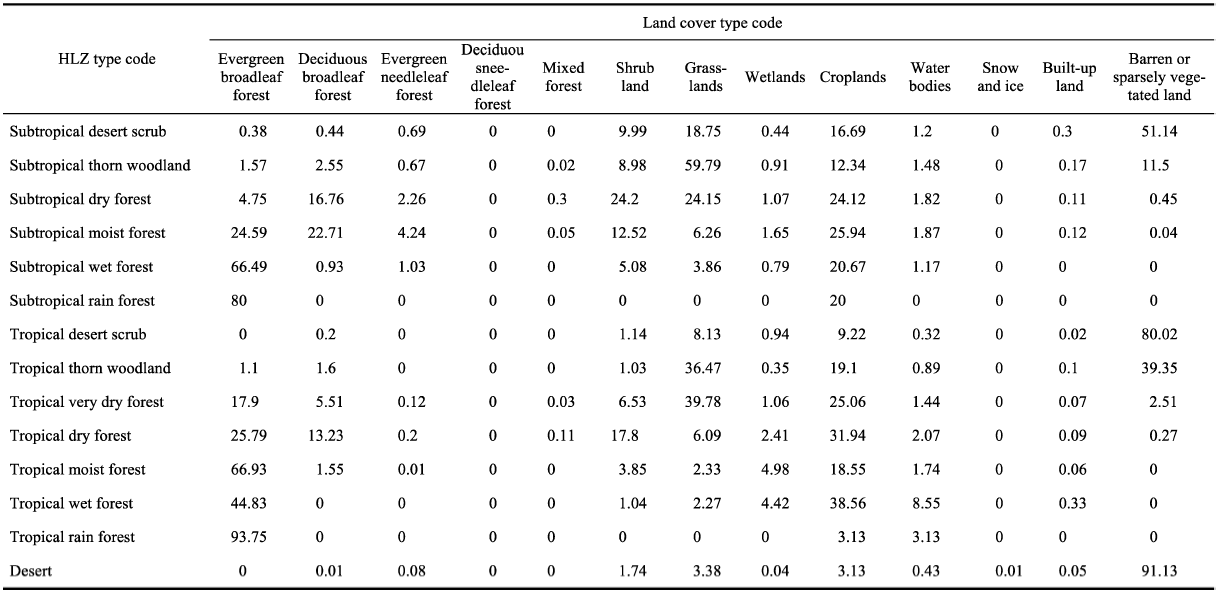 |
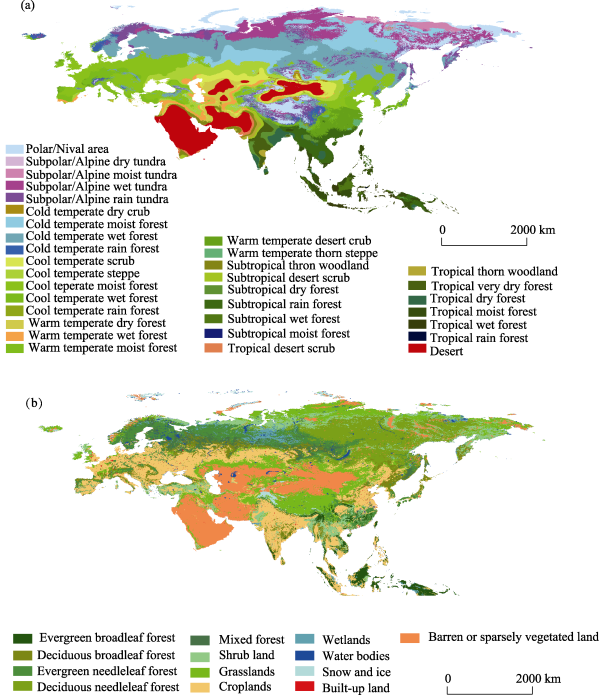
Figure 2 The distribution of HLZ types during 1981-2010 on an average (a) and land cover (b) of Eurasia in 2010 |
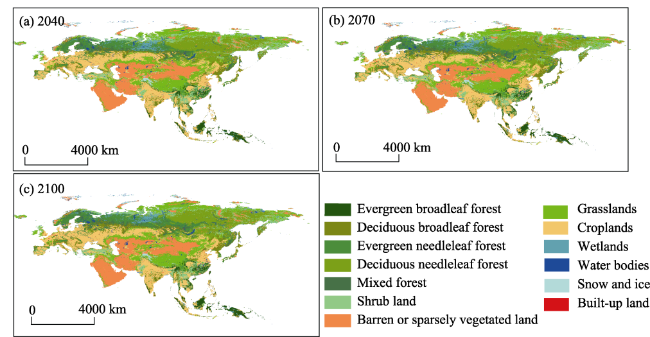
Figure 3 RCP26 scenario of land cover change in Eurasia |
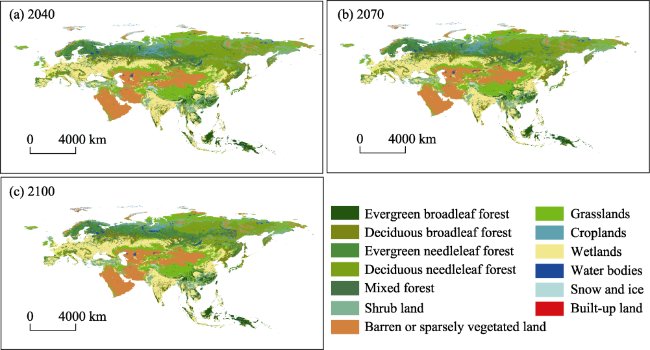
Figure 4 RCP45 scenario of land cover change in Eurasia |
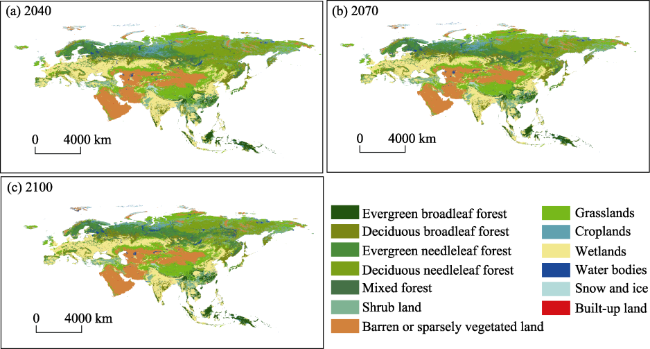
Figure 5 RCP85 scenario of land cover change in Eurasia |
Table 2 Area of land cover type based on RCP26 (km2) |
| Land cover type | 2010 | 2040 | 2070 | 2100 | Area change | Change rate (%) |
|---|---|---|---|---|---|---|
| Evergreen broadleaf forest | 2363080 | 2482321 | 2549012 | 2635963 | 272882 | 11.55 |
| Deciduous broadleaf forest | 3268045 | 3256437 | 3354152 | 3400582 | 132537 | 4.06 |
| Evergreen needleleaf forest | 4677409 | 4537064 | 4478604 | 4527778 | -149632 | -3.20 |
| Deciduous needleleaf forest | 4796439 | 4715819 | 4564922 | 4298793 | -497646 | -10.38 |
| Mixed forest | 1576935 | 1484708 | 1399023 | 1376441 | -200494 | -12.71 |
| Shrub land | 4265659 | 4078250 | 4023800 | 3973782 | -291876 | -6.84 |
| Grasslands | 8752493 | 8785628 | 8857383 | 8962695 | 210202 | 2.40 |
| Wetlands | 907075 | 966590 | 969967 | 892091 | -14984 | -1.65 |
| Croplands | 12226519 | 12544776 | 12692297 | 12748647 | 522127 | 4.27 |
| Water bodies | 862333 | 892091 | 930923 | 986850 | 124517 | 14.44 |
| Snow and Ice | 416393 | 384948 | 344849 | 311926 | -104468 | -25.09 |
| Built-up land | 222231 | 225397 | 228141 | 230040 | 7809 | 3.51 |
| Barren or sparsely vegetated land | 9747152 | 9727736 | 9688693 | 9736178 | -10974 | -0.11 |
Table 3 Area of land cover type based on RCP45 (km2) |
| Land cover type | 2010 | 2040 | 2070 | 2100 | Area change | Change rate (%) |
|---|---|---|---|---|---|---|
| Evergreen broadleaf forest | 2363080 | 2453619 | 2572016 | 2685347 | 322267 | 13.64 |
| Deciduous broadleaf forest | 3268045 | 3280286 | 3365759 | 3487322 | 219277 | 6.71 |
| Evergreen needleleaf forest | 4677409 | 4537486 | 4523135 | 4777445 | 100036 | 2.14 |
| Deciduous needleleaf forest | 4796439 | 4770058 | 4511738 | 3635687 | -1160752 | -24.20 |
| Mixed forest | 1576935 | 1478165 | 1363145 | 1405776 | -171158 | -10.85 |
| Shrub land | 4265659 | 4119615 | 3995520 | 4024644 | -241014 | -5.65 |
| Grasslands | 8752493 | 8774231 | 8879543 | 9153058 | 400565 | 4.58 |
| Wetlands | 907075 | 970389 | 954982 | 725154 | -181922 | -20.06 |
| Croplands | 12226519 | 12508687 | 12679001 | 12772284 | 545765 | 4.46 |
| Water bodies | 862333 | 888925 | 954138 | 1106302 | 243969 | 28.29 |
| Snow and Ice | 416393 | 384526 | 343583 | 254732 | -161661 | -38.82 |
| Built-up land | 222231 | 225608 | 228563 | 232150 | 9919 | 4.46 |
| Barren or sparsely vegetated land | 9747152 | 9690170 | 9710642 | 9821863 | 74710 | 0.77 |
Table 4 Area of land cover type based on RCP85 (km2) |
| Land cover type | 2010 | 2040 | 2070 | 2100 | Area change | Change rate (%) |
|---|---|---|---|---|---|---|
| Evergreen broadleaf forest | 2363080 | 2451298 | 2603673 | 2746340 | 383259 | 16.22 |
| Deciduous broadleaf forest | 3268045 | 3294215 | 3463473 | 3503994 | 235949 | 7.22 |
| Evergreen needleleaf forest | 4677409 | 4522924 | 4554158 | 4895208 | 217799 | 4.66 |
| Deciduous needleleaf forest | 4796439 | 4783565 | 4405371 | 3232589 | -1563850 | -32.60 |
| Mixed forest | 1576935 | 1427092 | 1263320 | 1275772 | -301162 | -19.10 |
| Shrub land | 4265659 | 4136499 | 3979058 | 4133755 | -131904 | -3.09 |
| Grasslands | 8752493 | 8763679 | 8958474 | 9317041 | 564548 | 6.45 |
| Wetlands | 907075 | 973343 | 856002 | 636725 | -270350 | -29.80 |
| Croplands | 12226519 | 12488005 | 12645656 | 12802252 | 575733 | 4.71 |
| Water bodies | 862333 | 897789 | 1002046 | 1190721 | 328387 | 38.08 |
| Snow and Ice | 416393 | 386425 | 310237 | 227296 | -189097 | -45.41 |
| Built-up land | 222231 | 226874 | 231306 | 232995 | 10763 | 4.84 |
| Barren or sparsely vegetated land | 9747152 | 9730058 | 9808989 | 9887076 | 139923 | 1.44 |
Table 5 Scenario of land cover change based on RCP26 (km2) |
| Land cover type | From 2011 to 2040 | From 2041 to 2070 | From 2071 to 2100 | |||
|---|---|---|---|---|---|---|
| Area | Change rate (%) | Area | Change rate (%) | Area | Change rate (%) | |
| Evergreen broadleaf forest | 119241 | 5.05 | 66690 | 2.69 | 86951 | 3.41 |
| Deciduous broadleaf forest | -11608 | -0.36 | 97714 | 3.00 | 46430 | 1.38 |
| Evergreen needleleaf forest | -140345 | -3.00 | -58460 | -1.29 | 49174 | 1.10 |
| Deciduous needleleaf forest | -80620 | -1.68 | -150898 | -3.20 | -266129 | -5.83 |
| Mixed forest | -92227 | -5.85 | -85685 | -5.77 | -22582 | -1.61 |
| Shrub land | -187409 | -4.39 | -54450 | -1.34 | -50018 | -1.24 |
| Grasslands | 33134 | 0.38 | 71756 | 0.82 | 105312 | 1.19 |
| Wetlands | 59515 | 6.56 | 3377 | 0.35 | -77876 | -8.03 |
| Croplands | 318257 | 2.60 | 147521 | 1.18 | 56349 | 0.44 |
| Water bodies | 29757 | 3.45 | 38832 | 4.35 | 55927 | 6.01 |
| Snow and Ice | -31446 | -7.55 | -40099 | -10.42 | -32923 | -9.55 |
| Built-up land | 3166 | 1.42 | 2744 | 1.22 | 1899 | 0.83 |
| Barren or sparsely vegetated land | -19416 | -0.20 | -39043 | -0.40 | 47485 | 0.49 |
Table 6 Scenario of land cover change based on RCP45 (km2) |
| Land cover type | From 2011 to 2040 | From 2041 to 2070 | From 2071 to 2100 | |||
|---|---|---|---|---|---|---|
| Area | Change rate (%) | Area | Change rate (%) | Area | Change rate (%) | |
| Evergreen broadleaf forest | 90539 | 3.83 | 118397 | 4.83 | 113332 | 4.41 |
| Deciduous broadleaf forest | 12241 | 0.37 | 85474 | 2.61 | 121562 | 3.61 |
| Evergreen needleleaf forest | -139923 | -2.99 | -14351 | -0.32 | 254310 | 5.62 |
| Deciduous needleleaf forest | -26381 | -0.55 | -258320 | -5.42 | -876051 | -19.42 |
| Mixed forest | -98769 | -6.26 | -115020 | -7.78 | 42631 | 3.13 |
| Shrub land | -146044 | -3.42 | -124095 | -3.01 | 29124 | 0.73 |
| Grasslands | 21738 | 0.25 | 105312 | 1.20 | 273515 | 3.08 |
| Wetlands | 63314 | 6.98 | -15406 | -1.59 | -229829 | -24.07 |
| Croplands | 282168 | 2.31 | 170314 | 1.36 | 93282 | 0.74 |
| Water bodies | 26592 | 3.08 | 65213 | 7.34 | 152164 | 15.95 |
| Snow and Ice | -31868 | -7.65 | -40943 | -10.65 | -88850 | -25.86 |
| Built-up land | 3377 | 1.52 | 2955 | 1.31 | 3588 | 1.57 |
| Barren or sparsely vegetated land | -56982 | -0.58 | 20471 | 0.21 | 111221 | 1.15 |
Table 7 Scenario of land cover change based on RCP85 (km2) |
| Land cover type | From 2011 to 2040 | From 2041 to 2070 | From 2071 to 2100 | |||
|---|---|---|---|---|---|---|
| Area | Change rate (%) | Area | Change rate (%) | Area | Change rate (%) | |
| Evergreen broadleaf forest | 88217 | 3.73 | 152375 | 6.22 | 142667 | 5.48 |
| Deciduous broadleaf forest | 26170 | 0.80 | 169259 | 5.14 | 40521 | 1.17 |
| Evergreen needleleaf forest | -154486 | -3.30 | 31235 | 0.69 | 341050 | 7.49 |
| Deciduous needleleaf forest | -12874 | -0.27 | -378194 | -7.91 | -1172782 | -26.62 |
| Mixed forest | -149843 | -9.50 | -163772 | -11.48 | 12452 | 0.99 |
| Shrub land | -129160 | -3.03 | -157440 | -3.81 | 154697 | 3.89 |
| Grasslands | 11185 | 0.13 | 194795 | 2.22 | 358567 | 4.00 |
| Wetlands | 66268 | 7.31 | -117341 | -12.06 | -219277 | -25.62 |
| Croplands | 261486 | 2.14 | 157651 | 1.26 | 156596 | 1.24 |
| Water bodies | 35456 | 4.11 | 104257 | 11.61 | 188675 | 18.83 |
| Snow and Ice | -29969 | -7.20 | -76188 | -19.72 | -82941 | -26.73 |
| Built-up land | 4643 | 2.09 | 4432 | 1.95 | 1688 | 0.73 |
| Barren or sparsely vegetated land | -17095 | -0.18 | 78931 | 0.81 | 78087 | 0.80 |
| 1 |
|
| 2 |
|
| 3 |
|
| 4 |
|
| 5 |
|
| 6 |
|
| 7 |
|
| 8 |
|
| 9 |
|
| 10 |
|
| 11 |
|
| 12 |
|
| 13 |
|
| 14 |
|
| 15 |
|
| 16 |
|
| 17 |
|
| 18 |
|
| 19 |
|
| 20 |
|
| 21 |
|
| 22 |
|
| 23 |
|
| 24 |
|
| 25 |
|
| 26 |
|
| 27 |
|
| 28 |
|
| 29 |
|
| 30 |
|
| 31 |
|
| 32 |
|
| 33 |
|
| 34 |
|
| 35 |
|
| 36 |
|
| 37 |
|
| 38 |
|
| 39 |
|
| 40 |
|
/
| 〈 |
|
〉 |