
Journal of Geographical Sciences >
Impacts of climate change and agricultural activities on water quality in the Lower Kaidu River Basin, China
Received date: 2018-07-02
Accepted date: 2018-12-27
Online published: 2020-03-25
Supported by
National Key Research and Development Program of China, No(2017YFC0404501)
Tianshan Innovation Team Project of the Xinjiang Department of Science and Technology, No(Y744261)
Copyright
In the context of climate change and over-exploitation of water resources, water shortage and water pollution in arid regions have become major constraints to local sustainable development. In this study, we established a Soil and Water Assessment Tool (SWAT) model for simulating non-point source (NPS) pollution in the irrigation area of the lower reaches of the Kaidu River Basin, based on spatial and attribute data (2010-2014). Four climate change scenarios (2040-2044) and two agricultural management scenarios were input into the SWAT model to quantify the effects of climate change and agricultural management on solvents and solutes of pollutants in the study area. The simulation results show that compared to the reference period (2010-2014), with a decline in streamflow from the Kaidu River, the average annual irrigation water consumption is expected to decrease by 3.84×10 8 m 3 or 8.87% during the period of 2040-2044. Meanwhile, the average annual total nitrogen (TN) and total phosphorus (TP) in agricultural drainage canals will also increase by 10.50% and 30.06%, respectively. Through the implementation of agricultural management measures, the TN and TP in farmland drainage can be reduced by 14.49% and 16.03%, respectively, reaching 661.56 t and 12.99 t, accordingly, and the increasing water efficiency can save irrigation water consumption by 4.41×10 8 m 3 or 4.77%. The results indicate that although the water environment in the irrigation area in the lower reaches of the Kaidu River Basin is deteriorating, the situation can be improved by implementing appropriate agricultural production methods. The quantitative analysis results of NPS pollutants in the irrigation area under different scenarios provide a scientific basis for water environmental management in the Kaidu River Basin.
BA Wulong , DU Pengfei , LIU Tie , BAO Anming , CHEN Xi , LIU Jiao , QIN Chengxin . Impacts of climate change and agricultural activities on water quality in the Lower Kaidu River Basin, China[J]. Journal of Geographical Sciences, 2020 , 30(1) : 164 -176 . DOI: 10.1007/s11442-020-1721-z
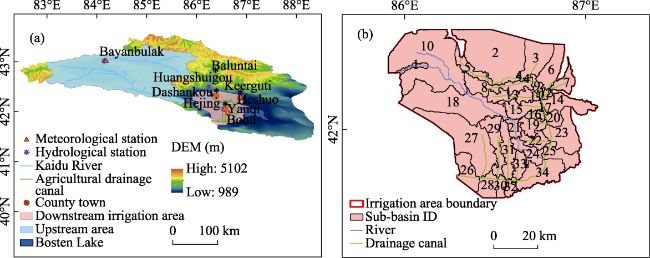
Figure 1 Locations of the Kaidu River Basin (a) and irrigation area of the lower reaches of the Kaidu River Basin (b) |
Table 1 Climate change (2040-2044) and agricultural management measure scenarios used in this study |
| Climate scenarios | Temperature change (℃) | Precipitation change (%) | Streamflow change (%) |
|---|---|---|---|
| A | +0.5 | -10 | -10 |
| B | +0.7 | +10 | +10 |
| C | +1.3 | +20 | -10 |
| D | +1.9 | +30 | -20 |
| Management scenarios | Measures | ||
| E | Agricultural irrigation efficiency increased from 58 % to 75% | ||
| F | Amount of fertilizer application reduced by 20% | ||
Table 2 Parameters used for calibration of the SWAT model (2012-2013) |
| Parameter | Definition | Ranges | Fitted value |
|---|---|---|---|
| LAT_TTIME | Lateral flow travel time | 0.00-180.00 | 62.00 |
| NPERCO | Nitrogen percolation coefficient | 0.00-1.00 | 0.21 |
| ALPHA_BF | Baseflow alpha factor | 0.00-1.00 | 0.25 |
| GW_REVAP | Groundwater evaporation coefficient | 0.02-0.20 | 0.02 |
| GW_DELAY | Groundwater delay | 0.00-500.00 | 14.00 |
| ESCO | Soil evaporation compensation factor | 0.00-1.00 | 0.19 |
| BIOMIX | Biological mixing efficiency | 0.00-1.00 | 0.26 |
| USLE_P | USLE equation support practice | 0.00-1.00 | 0.26 |
| BC1 | Rate constant for biological oxidation of NH3 | 0.10-1.00 | 0.55 |
| BC2 | Rate constant for biological oxidation NO2 to NO3 | 0.20-2.00 | 1.10 |
Table 3 Calibration and validation results of model parameters |
| Variable | Period | R2 | NSE | PBIAS (%) |
|---|---|---|---|---|
| Streamflow | Calibration (2012/01-2013/12) | 0.84 | 0.80 | -28.57 |
| Validation (2014/01-2014/12) | 0.86 | 0.83 | 7.46 | |
| TN (t) | Calibration (2012/01-2013/12) | 0.85 | 0.79 | -27.32 |
| Validation (2014/01-2014/12) | 0.86 | 0.82 | 10.68 | |
| TP (t) | Calibration (2012/01-2013/12) | 0.79 | 0.75 | -35.34 |
| Validation (2014/01-2014/12) | 0.81 | 0.73 | 12.35 |
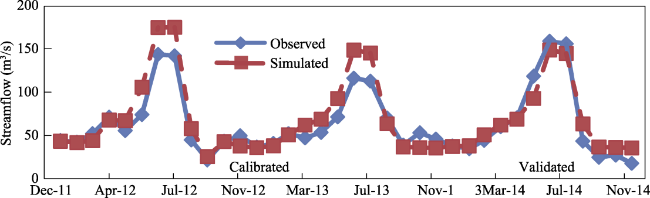
Figure 2 Calibration and validation of monthly streamflow at the Yanqi hydrological station (2012-2014) |
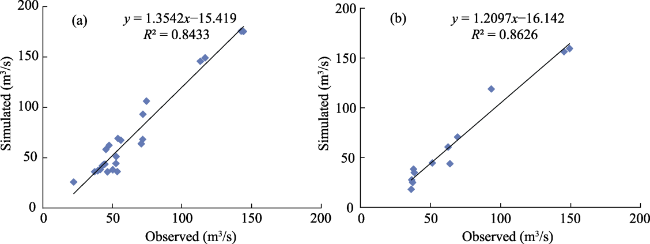
Figure 3 Simulated and observed values of streamflow in the calibration (a) and validation periods (b) (2012-2014) |
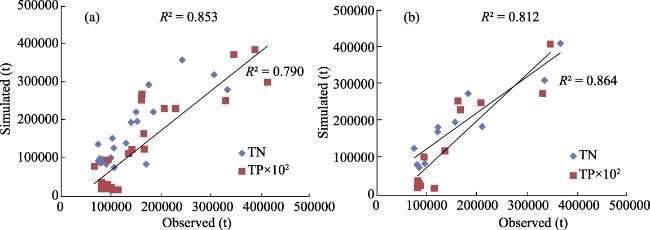
Figure 4 Simulated and observed values of TN and TP in the calibration (a) and validation periods (b) (2012-2014) |
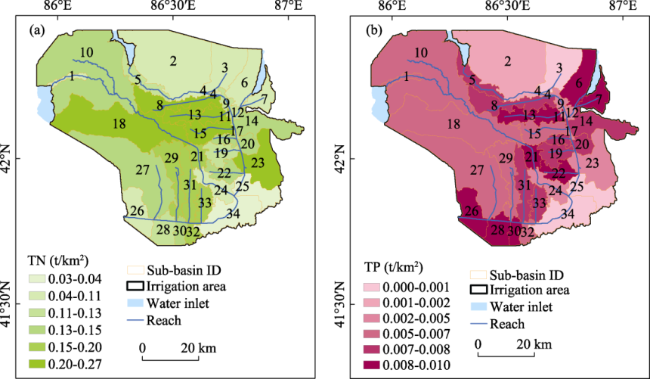
Figure 5 Distributions of annual average total nitrogen (TN) (a) and total phosphorus (TP) (b) (2010-2014) |
Table 4 Average annual non-point source (NPS) pollutant emissions and streamflow discharge for each drainage canal (2010-2014) |
| Sub-basin ID | Receiving water | Drainage canal | TN (t) | TP (t) | Discharge (104 m3/s) |
|---|---|---|---|---|---|
| 24 | Big Lake District | Kaidu River | 2345.36 | 9.50 | 225896.46 |
| 16 | Halayin, Dongdahan | 4.16 | 0.24 | 723.98 | |
| 19 | Benbutu, 25th Regiment | 9.52 | 0.60 | 1539.51 | |
| 22 | Bohu Town, Wulan Town | 10.29 | 0.64 | 1485.38 | |
| 7 | Bortu, 26th Regiment West | 6.26 | 0.66 | 1545.33 | |
| 2 | Yellow Water District | Huangshui River | 499.58 | 2.70 | 12633.36 |
| 8 | 22nd Regiment North and South | 36.69 | 1.21 | 2624.37 | |
| 13 | Shengli, Beigan | 26.85 | 0.99 | 2331.01 | |
| 15 | Dongfeng | 24.11 | 0.81 | 1685.94 | |
| 3 | 6th and 4th Companies of the 24th Regiment | 16.6 | 0.01 | 101.94 | |
| 6 | Qingshui River West and East | 22.64 | 1.85 | 1516.93 | |
| 27 | Small Lake District | Tuanjie | 61.52 | 3.28 | 10091.55 |
| 29 | Jiefang, 40 Lichengzi | 22.58 | 1.03 | 2461.36 | |
| 31 | 27th Regiment, Yongning Town | 23.03 | 0.96 | 2091.49 | |
| 33 | Yongning Town East, Chaganur | 9.91 | 0.51 | 1268.55 | |
| Total | 3119.10 | 24.99 | 267997.16 | ||
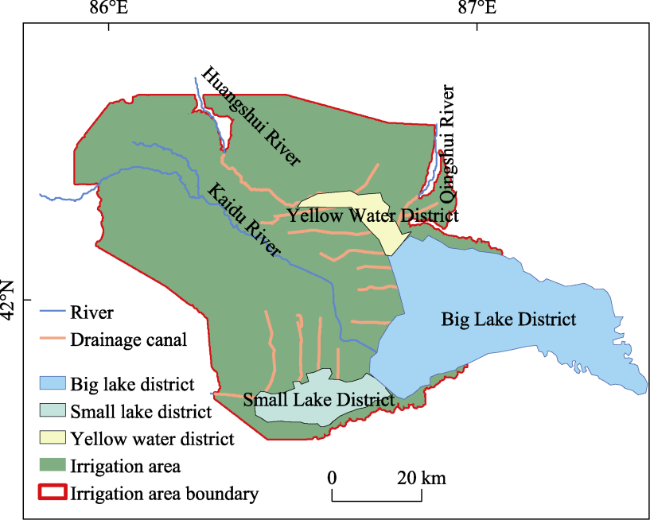
Figure 6 Drainage map of Kaidu River irrigation area |
Table 5 Changes of NPS pollution in the Kaidu River and drainage canals under different scenarios |
| Scenarios | Water source | Precipitation (mm) | Discharge (m3/s) | TN (t) | TP (t) |
|---|---|---|---|---|---|
| Reference period | Drainage | 79.51 | 4.21×10⁸ | 773.73 | 15.47 |
| River | 246.47 | 2.26×10⁹ | 2345.36 | 9.50 | |
| Scenario A | Drainage | 71.56 | 4.03×10⁸ | 704.39 | 13.60 |
| River | 221.82 | 1.93×10⁹ | 2233.16 | 9.12 | |
| Scenario B | Drainage | 87.46 | 4.37×10⁸ | 845.33 | 21.88 |
| River | 271.12 | 2.58×10⁹ | 2485.97 | 15.21 | |
| Scenario C | Drainage | 95.41 | 4.09×10⁸ | 847.70 | 20.98 |
| River | 295.76 | 1.94×10⁹ | 2331.32 | 13.70 | |
| Scenario D | Drainage | 103.36 | 3.84×10⁸ | 854.98 | 20.20 |
| River | 320.41 | 1.61×10⁹ | 2222.45 | 12.87 | |
| Scenario E | Drainage | 79.51 | 4.41×10⁸ | 773.73 | 15.47 |
| River | 246.47 | 2.26×10⁹ | 2345.36 | 9.50 | |
| Scenario F | Drainage | 79.51 | 4.21×10⁸ | 661.56 | 12.99 |
| River | 246.47 | 2.26×10⁹ | 2312.59 | 8.93 |
| 1 |
|
| 2 |
|
| 3 |
|
| 4 |
|
| 5 |
|
| 6 |
|
| 7 |
|
| 8 |
|
| 9 |
|
| 10 |
|
| 11 |
|
| 12 |
|
| 13 |
|
| 14 |
|
| 15 |
|
| 16 |
|
| 17 |
|
| 18 |
|
| 19 |
|
| 20 |
|
| 21 |
|
| 22 |
|
| 23 |
|
| 24 |
|
| 25 |
|
| 26 |
|
| 27 |
|
| 28 |
|
| 29 |
|
| 30 |
|
| 31 |
|
| 32 |
|
| 33 |
|
| 34 |
|
| 35 |
|
| 36 |
|
| 37 |
|
/
| 〈 |
|
〉 |