
Journal of Geographical Sciences >
Glacial changes in the Gangdisê Mountains from 1970 to 2016
|
Liu Juan (1993–), Master Candidate, specializing in the environmental science and geographic information system. E-mail: liujuan_qx@163.com |
Received date: 2019-02-19
Accepted date: 2019-05-30
Online published: 2020-03-25
Supported by
National Natural Science Foundation of China, No(415610162)
National Natural Science Foundation of China, No(41861013)
National Natural Science Foundation of China, No(41801052)
National Basic Work Program of MST, No(2013FY111400)
Youth Scholar Scientific Capability Promoting Project of Northwest Normal University, No(NWNU-LKQN-14-4)
Copyright
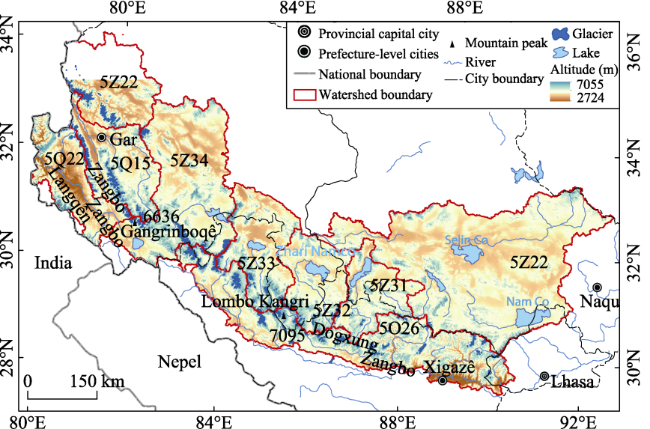
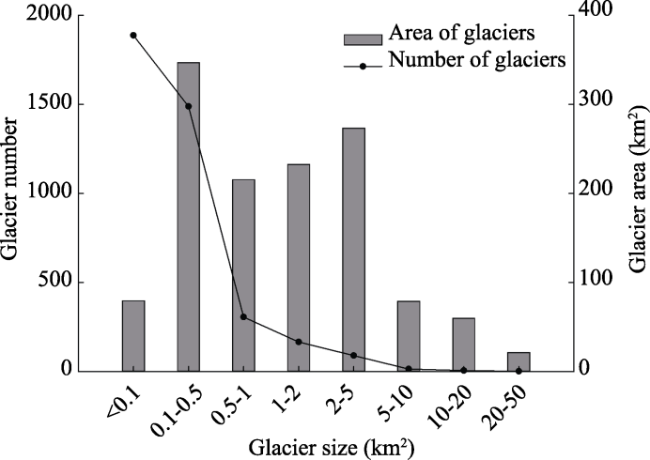
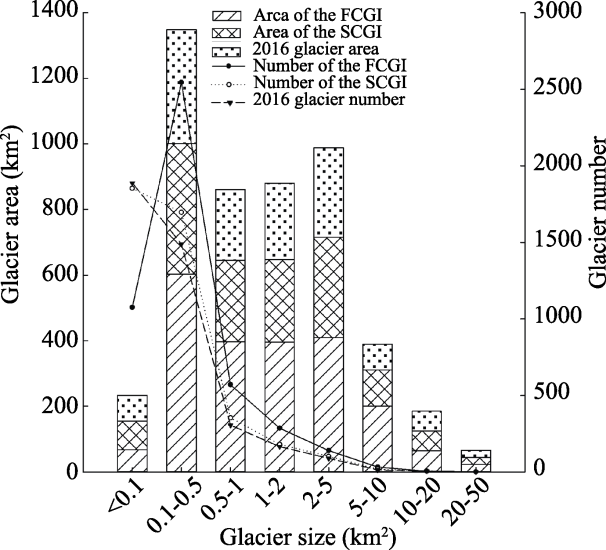
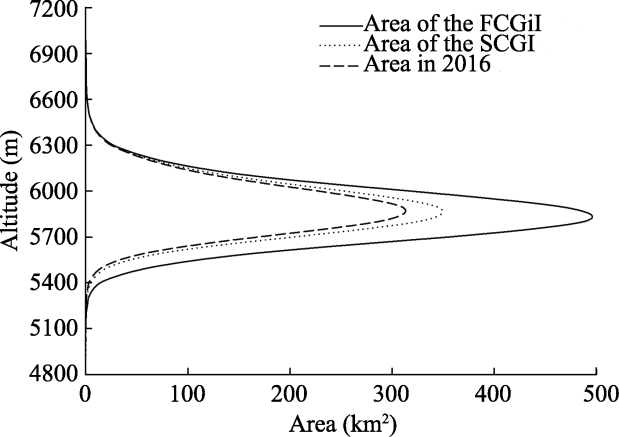
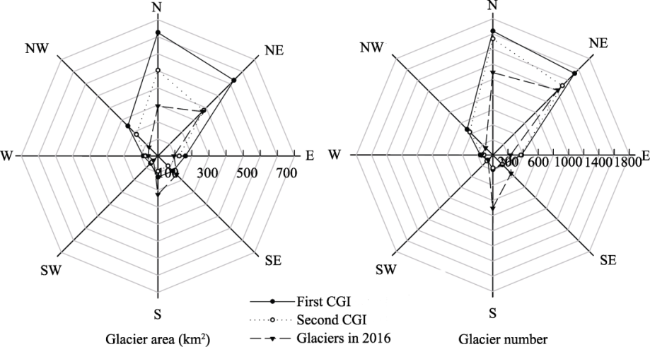
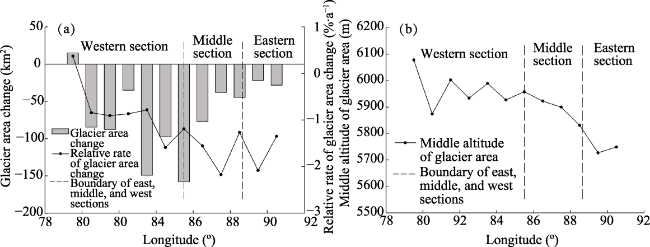
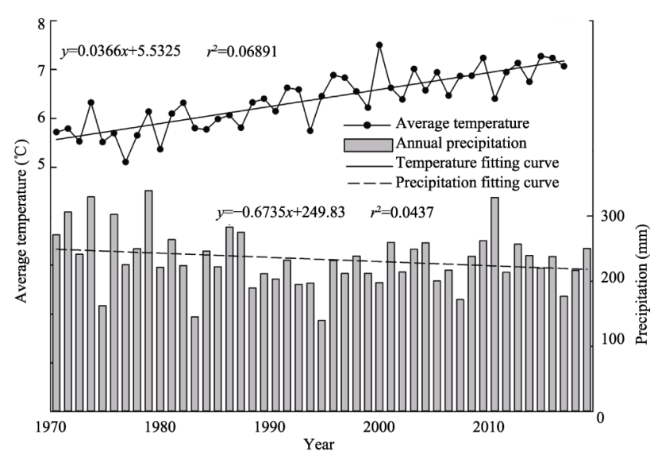
Based on the revised First Chinese Glacier Inventory (FCGI), the Second Chinese Glacier Inventory (SCGI) and Landsat OLI images for 2015-2016, we analyzed the spatial-temporal variation characteristics of glaciers in the Gangdisê Mountains from 1970 to 2016. The results showed that there were 3953 glaciers with a total area of 1306.45 km 2 and ice volume of ~58.16 km 3 in the Gangdisê Mountains in 2015-2016. Glaciers with sizes of 0.1-5 km 2 and <0.5 km 2 accounted for the largest area and the most amounts of glaciers in the Gangdisê Mountains, respectively. Over the past five decades, the area of glaciers in the Gangdisê Mountains decreased by 854.05 km 2 (-1.09%·a -1), accounting for 39.53% of the total glacier area in 1970. The increase in temperature during the ablation period was the most important cause for glacier retreat. Compared to other mountains in western China, the Gangdisê Mountains have experienced the strongest glacial retreat, and the rate of recession has increased in recent years. The decrease of glacier area was mainly concentrated at elevations of 5600-6100 m, and no change in glacier area was observed at elevations above 6500 m. The number and area of glaciers decreased in all orientations in the Gangdisê Mountains except for south- and southeast-oriented glaciers. Among them, north-oriented glaciers suffered the largest loss of glacier area, while glacier retreat saw the fastest in northwest-oriented glaciers. The rate of glacier retreat increased from west to east in the Gangdisê Mountains. The relative rate of glacier area change was the highest in the eastern section of the Gangdisê Mountains (-1.72%·a -1), followed by the middle section (-1.67%·a -1) and the western section (-0.83%·a -1).
Key words: glacier change; glacier inventory; climate change; Gangdisê Mountains;
LIU Juan , YAO Xiaojun , LIU Shiyin , GUO Wanqin , XU Junli . Glacial changes in the Gangdisê Mountains from 1970 to 2016[J]. Journal of Geographical Sciences, 2020 , 30(1) : 131 -144 . DOI: 10.1007/s11442-020-1719-6
Figure 1 Distribution of glaciers in the Gangdisê Mountains |
Table 1 Landsat OLI images used to obtain glacier data in the Gangdisê Mountains from 2015-2016 |
| Number | Orbit number | Acquisition date | Number | Orbit number | Acquisition date | |||
|---|---|---|---|---|---|---|---|---|
| Path | Row | Path | Row | |||||
| 1 | 138 | 39 | 2016-04-27 | 8 | 143 | 38 | 2016-10-07 | |
| 2 | 138 | 40 | 2016-04-27 | 9 | 143 | 39 | 2016-09-05 | |
| 3 | 139 | 39 | 2016-03-17 | 10 | 144 | 38 | 2016-06-24 | |
| 4 | 140 | 39 | 2016-10-18 | 11 | 145 | 37 | 2016-10-15 | |
| 5 | 141 | 39 | 2016-05-18 | 12 | 145 | 38 | 2016-09-03 | |
| 6 | 141 | 40 | 2015-10-07 | 13 | 146 | 37 | 2016-09-10 | |
| 7 | 142 | 39 | 2015-09-28 | |||||
Figure 2 Number and area of glaciers with different sizes in the Gangdisê Mountains from 2015-2016 |
Table 2 Glacier statistics for different basins in the Gangdisê Mountains from 2015-2016 |
| Basin (code) | Secondary basin (code) | Tertiary basin (code) | Number | Area | Volume | |||
|---|---|---|---|---|---|---|---|---|
| (%) | (km2) | (%) | (km2) | (%) | ||||
| Ganges River (5O) | Yarlung Zangbo River (5O2) | Dogxung Zangbo (5O26) | 1372 | 34.71 | 413.65 | 31.66 | 16.63 | 28.65 |
| Indus River (5Q) | Sênggê Zangbo (5Q1) | Sênggê Zangbo (5Q15) | 703 | 17.78 | 172.36 | 13.19 | 7.54 | 12.99 |
| Langqên Zangbo (5Q2) | Langqên Zangbo (5Q22) | 227 | 5.74 | 40.09 | 3.07 | 1.30 | 2.24 | |
| Total | 930 | 23.52 | 212.45 | 16.26 | 8.84 | 15.23 | ||
| Tibetan Plateau interior (5Z) | Selin Co (5Z2) | Selin Co (5Z22) | 43 | 1.09 | 15.46 | 1.18 | 0.66 | 1.14 |
| Zhari Namco (5Z3) | Dangta Yumco (5Z31) | 104 | 2.63 | 27.28 | 2.09 | 0.93 | 1.60 | |
| Zhari Namco (5Z32) | 182 | 4.61 | 61.48 | 4.71 | 2.52 | 4.34 | ||
| Taro Co (5Z33) | 301 | 7.61 | 157.64 | 12.07 | 6.80 | 11.71 | ||
| Ngangla Ring Co (5Z34) | 531 | 13.43 | 343.12 | 26.26 | 19.47 | 33.54 | ||
| Bangong Co (5Z4) | Bangong Co (5Z42) | 490 | 12.40 | 75.37 | 5.77 | 2.20 | 3.79 | |
| Total | 1651 | 41.78 | 680.35 | 52.08 | 29.72 | 51.19 | ||
Table 3 Glacier statistics in different administrative divisions in the Gangdisê Mountains from 2015-2016 |
| City (region) | Number | Area | Volume | |||
|---|---|---|---|---|---|---|
| (%) | (km2) | (%) | (km3) | (%) | ||
| Lhasa | 46 | 1.17 | 22.83 | 1.75 | 1.13 | 1.94 |
| Xigazê | 1603 | 40.55 | 607.87 | 46.53 | 27.09 | 46.58 |
| Ngari | 2260 | 57.17 | 665.13 | 50.91 | 29.60 | 50.89 |
| Naqu | 44 | 1.11 | 10.62 | 0.81 | 0.34 | 0.58 |
Figure 3 Changes in the number and area of glaciers with different sizes in the Gangdisê Mountains from 1970 to 2016 |
Figure 4 Altitude characteristics of changes in glacier area in the Gangdisê Mountains from 1970 to 2016 |
Figure 5 Orientational characteristics of glacial changes in the Gangdisê Mountains from 1970 to 2016 |
Figure 6 Changes in glacier area in different sections of the Gangdisê Mountains from 1970 to 2016 |
Figure 7 Average temperature during the ablation period and annual precipitation in the Gangdisê Mountains from 1970 to 2016 |
Table 4 Statistics of glacier changes in western China in recent decades |
| Name | Time period | Area change (km2) | Relative rate of glacier area change (%·a-1) | Data source | |
|---|---|---|---|---|---|
| Altay Mountains | 1960-2009 | -104.61 | -0.94 | Yao et al., 2012 | |
| Tianshan Mountains | 1959-2010 | -1619.82 | -0.40 | Xing et al., 2017 | |
| A°Nyêmaqên Mountains | 1966-2000 | -21.70 | -0.56 | Liu et al., 2002 | |
| Altun Mountains | 1973-2010 | -54.22 | -0.46 | Zhu et al., 2013 | |
| Qilian Mountains | 1956-2010 | -417.15 | -0.43 | Sun et al., 2018 | |
| Middle section of the Tanggula Mountains | 1990-2015 | -115.46 | -1.00 | Wang et al., 2016 | |
| Central and Western Qangtang Plateau | 1970-2000 | -5.07 | -0.03 | Li et al., 2009 | |
| Gangdisê Mountains | 1970-2016 | -854.05 | -1.09 | This study | |
| Western region of the Nyainqetanglha Range | 1970-2000 | -52.10 | -0.19 | Shangguan et al., 2008 | |
| Kangri Karpo Mountains | 1980-2015 | -679.50 | -0.82 | Wu et al., 2018 | |
| Luozha region, Eastern Himalayas | 1980-2007 | -80.77 | -0.66 | Li et al., 2011 | |
| Gongga Mountain | 1974-2010 | -30.20 | -0.35 | Li et al., 2013 | |
| 1 |
|
| 2 |
|
| 3 |
|
| 4 |
|
| 5 |
|
| 6 |
GardelleJ,
|
| 7 |
|
| 8 |
|
| 9 |
|
| 10 |
|
| 11 |
|
| 12 |
|
| 13 |
|
| 14 |
|
| 15 |
|
| 16 |
|
| 17 |
|
| 18 |
|
| 19 |
|
| 20 |
|
| 21 |
|
| 22 |
|
| 23 |
|
| 24 |
|
| 25 |
|
| 26 |
|
| 27 |
|
| 28 |
|
| 29 |
|
| 30 |
|
| 31 |
|
| 32 |
|
| 33 |
|
| 34 |
|
| 35 |
|
| 36 |
|
| 37 |
|
| 38 |
|
| 39 |
|
| 40 |
|
| 41 |
|
| 42 |
|
| 43 |
|
| 44 |
|
| 45 |
|
/
| 〈 |
|
〉 |