
Journal of Geographical Sciences >
Multi-scale temperature variations and their regional differences in China during the Medieval Climate Anomaly
|
Hao Zhixin, Professor, specialized in climate change. E-mail: haozx@igsnrr.ac.cn |
Received date: 2019-07-08
Accepted date: 2019-08-16
Online published: 2020-03-25
Supported by
National Key R&D Program of China, No(2017YFA0603300)
National Natural Science Foundation of China, No(41671036)
National Natural Science Foundation of China, No(41831174)
The Strategic Priority Research Program of the Chinese Academy of Sciences, No(XDA19040101)
Copyright
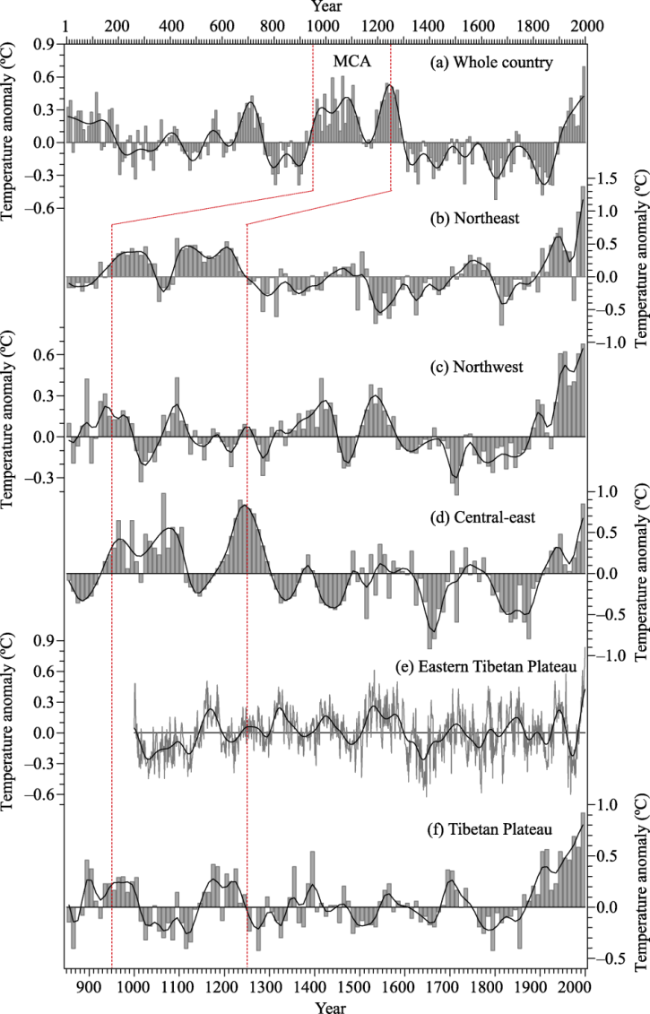
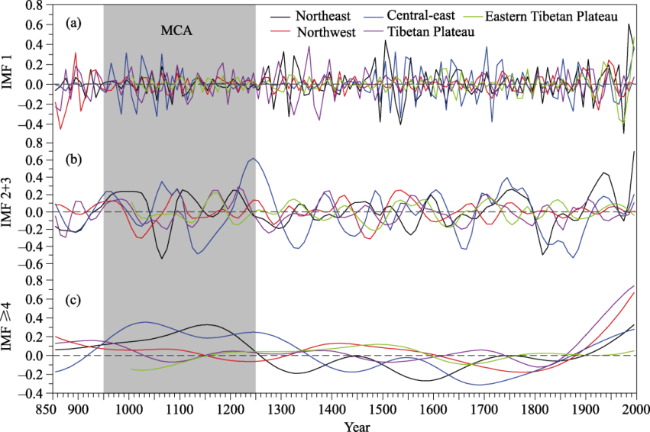
The Medieval Climate Anomaly (MCA, AD950-1250) is the most recent warm period lasting for several hundred years and is regarded as a reference scenario when studying the impact of and adaptation to global and regional warming. In this study, we investigated the characteristics of temperature variations on decadal-centennial scales during the MCA for four regions (Northeast, Northwest, Central-east, and Tibetan Plateau) in China, based on high-resolution temperature reconstructions and related warm-cold records from historical documents. The ensemble empirical mode decomposition method is used to analyze the time series. The results showed that for China as a whole, the longest warm period during the last 2000 years occurred in the 10th-13th centuries, although there were multi-decadal cold intervals in the middle to late 12th century. However, in the beginning and ending decades, warm peaks and phases on the decadal scale of the MCA for different regions were not consistent with each other. On the inter-decadal scale, regional temperature variations were similar from 950 to 1130; moreover, their amplitudes became smaller, and the phases did not agree well from 1130 to 1250. On the multi-decadal to centennial scale, all four regions began to warm in the early 10th century and experienced two cold intervals during the MCA. However, the Northwest and Central-east China were in step with each other while the warm periods in the Northeast China and Tibetan Plateau ended about 40-50 years earlier. On the multi-centennial scale, the mean temperature difference between the MCA and Little Ice Age was significant in Northeast and Central-east China but not in the Northwest China and Tibetan Plateau. Compared to the mean temperature of the 20th century, a comparable warmth in the MCA was found in the Central-east China, but there was a little cooling in Northeast China; meanwhile, there were significantly lower temperatures in Northwest China and Tibetan Plateau.
Key words: China; multi-scale variations; temperature; Medieval Climate Anomaly
HAO Zhixin , WU Maowei , LIU Yang , ZHANG Xuezhen , ZHENG Jingyun . Multi-scale temperature variations and their regional differences in China during the Medieval Climate Anomaly[J]. Journal of Geographical Sciences, 2020 , 30(1) : 119 -130 . DOI: 10.1007/s11442-020-1718-7
Table 1 Information for published temperature reconstruction series by historical documents and natural evidence |
| Region | Proxy | Spatial coverage | Indicator | Reconstructed period | Time resolution | Reference |
|---|---|---|---|---|---|---|
| Northeast China | Integrated from 5 series including δ18O in peat, long-chain alkenone, stalagmite microlayer thickness, and warm/cold records. | About 110 º-130 ºE, 36 º-50 ºN | Annual mean temperature | AD 1-2000 | 10 yr | Ge et al., 2013a |
| Northwest China | Integrated from 2 series of juniper tree ring width from the northern slope of Qilian Mountain. | About 80 º-110ºE, 38ºN to the north border | Annual mean temperature | AD 850-2000 | 10 yr | Ge et al., 2013a |
| Central-east China | Integrated from 11 series of historical warm/cold records, 3 of which started from 1380 and 8 of which started from 1470. | About 105º-122 ºE, 24 º-36 ºN | Annual mean temperature | AD 1-2000 | 10 yr | Ge et al., 2013a |
| Tibetan Plateau | Integrated from 8 series including δ18O in ice cores, juniper tree ring width, total organic carbon, and long-chain alkenone. | About 80 º-102 ºE, 25º-38 ºN | Annual mean temperature | AD 1-2000 | 10 yr | Ge et al., 2013a |
| Eastern Tibetan Plateau | Integrated from 12 chronologies from tree ring width. | 87 º-102ºE, 27 º-38ºN, 3100-4500 m | Mean temperature from June to August | AD 1000-2005 | 1 yr | Wang et al., 2015 |
Figure 1 Temperature reconstructions for China (a) and different regions of China (b-f) |
Figure 2 EEMD analysis of reconstructed temperature series for different regions in China |
Table 2 Explained variance by IMFs combination for regional reconstructions |
| IMF | Northeast China | Northwest China | Central-east China | Tibetan Plateau | Eastern Tibetan Plateau |
|---|---|---|---|---|---|
| IMF 1 | 29.5% | 24.5% | 11.3% | 31.5% | 42.7% |
| IMF 2+3 | 29.1% | 28.6% | 40.7% | 25.9% | 38.0% |
| IMF ≥4 | 21.9% | 46.7% | 29.7% | 34.3% | 18.7% |
| 1 |
|
| 2 |
|
| 3 |
|
| 4 |
|
| 5 |
|
| 6 |
|
| 7 |
|
| 8 |
|
| 9 |
|
| 10 |
|
| 11 |
|
| 12 |
|
| 13 |
|
| 14 |
|
| 15 |
|
| 16 |
|
| 17 |
|
| 18 |
|
| 19 |
|
| 20 |
|
| 21 |
|
| 22 |
IPCC, 2012. Managing the Risks of Extreme Events and Disasters to Advance Climate Change Adaptation. A Special Report of Working Groups I and II of the Intergovernmental Panel on Climate Change. Cambridge, UK, and New York, NY, USA: Cambridge University Press.
|
| 23 |
IPCC, 2014. Summary for policymakers. In: Climate Change 2014: Impacts, Adaptation, and Vulnerability. Part A: Global and Sectoral Aspects. Contribution of Working Group II to the Fifth Assessment Report of the Intergovernmental Panel on Climate Change. Cambridge, UK and New York, NY, USA: Cambridge University Press.
|
| 24 |
|
| 25 |
|
| 26 |
PAGES, 2009. Science Plan and Implementation Strategy. IGBP Report No.57. Stockholm: IGBP Secretariat.
|
| 27 |
PAGES, 2014. PAGES Restructured. Past Global Changes Magazine, 22(1):3.
|
| 28 |
|
| 29 |
|
| 30 |
|
| 31 |
|
| 32 |
|
| 33 |
|
| 34 |
|
| 35 |
|
| 36 |
|
| 37 |
|
| 38 |
|
| 39 |
|
| 40 |
|
| 41 |
|
| 42 |
|
| 43 |
|
/
| 〈 |
|
〉 |