
Journal of Geographical Sciences >
Application of an evaluation method of resource and environment carrying capacity in the adjustment of industrial structure in Tibet
|
Niu Fangqu (1979-), PhD and Associate Professor, specialized in urban and regional sustainable development modeling. E-mail: niufq@lreis.ac.cn. |
Received date: 2019-08-28
Accepted date: 2019-10-12
Online published: 2020-04-21
Supported by
National Key Research and Development Program(No.2016YFC0503506)
The Strategic Priority Research Program of the Chinese Academy of Sciences(No.XDA19040401)
Copyright
With the degradation of natural resources and environment caused by industrial development in some developing countries, the requirement of implementing a “social ecological” approach to development is imminent. Resource and environment carrying capacity provides a means of assessing regional development potential by measuring regional sustainable development in terms of economy, population and resources & environment. This study develops a conceptual framework for resource and environment carrying capacity estimation to support the co-development planning of industries, population and resources & environment. First, the framework constructs an index system for evaluating importance of industry or influence based on the role of industry played in the local socio-economic system. Then, the framework computes the quantitative relations through the importance of local industry, population size and resource utilization and environment effects, and subsequently estimates the resource and environment carrying capacity of the study area. With a particular attention to its land resources, water resources and environment, the Tibet case study shows that: the non-ferrous metal mining, tourism, liquor and refined tea industries play a pillar role in the Tibet’s socio-economic system; under each industrial structure, land resource carrying capacity is the weakest, and water resources carrying capacity is the strongest; to focus on tourism will improve local resource and environment carrying capacity. The research results provide a solid guide for Tibet government’s co-actions in industrial restructuring, ecological protection, and the pursuit of economic development. This study will contribute to bridge the gap between theoretical research and practical applications of resource and environment carrying capacity, and help local governments plan the regional “socio-ecological” sustainable development.
NIU Fangqu , YANG Xinyu , ZHANG Xiaoping . Application of an evaluation method of resource and environment carrying capacity in the adjustment of industrial structure in Tibet[J]. Journal of Geographical Sciences, 2020 , 30(2) : 319 -332 . DOI: 10.1007/s11442-020-1730-y
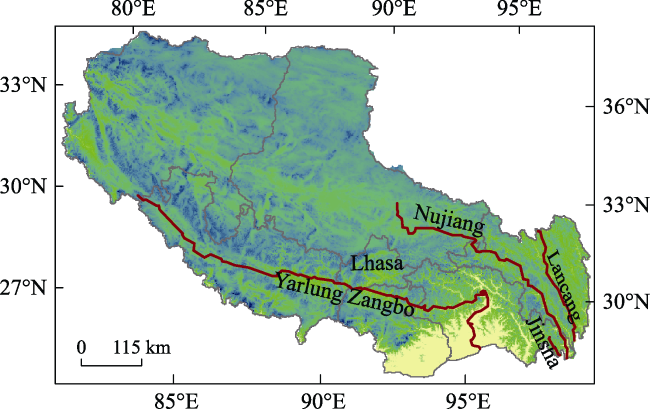
Figure 1 Study area: Tibet, China |
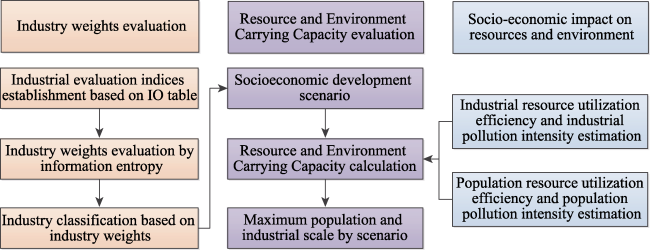
Figure 2 The RECC evaluation framework |
Table 1 Industrial evaluation index matrix |
| Industries | Output value | Influence coefficient | Response coefficient | Industrial potential |
|---|---|---|---|---|
| Industry 1 | X11 | X12 | X13 | X14 |
| Industry 2 | X21 | X22 | X23 | X24 |
| Industry 3 | X31 | X32 | X33 | X34 |
| …… | … | … | … | … |
| Industry m | Xm1 | Xm2 | Xm3 | Xm4 |
Table 2 Industry weights in Tibet, China |
| Class | Industry type | Weight | Rank |
|---|---|---|---|
| First Class | Non-ferrous metal mining and dressing industry | 0.617 | 1 |
| Tourism | 0.333 | 2 | |
| Wine and beverage and refined tea manufacturing industry | 0.182 | 3 | |
| Second Class | Pharmaceutical industry | 0.154 | 4 |
| Chemical raw materials and chemical products manufacturing industry | 0.137 | 5 | |
| Printing and recording media reproduction | 0.132 | 6 | |
| Paper and paper products industry | 0.127 | 7 | |
| Culture, education, arts & crafts, sports and entertainment products manufacturing industry | 0.127 | 8 | |
| Food manufacturing | 0.118 | 9 | |
| Agricultural and sideline food processing industry | 0.116 | 10 | |
| Third Class | Electric power and thermal production and supply industry | 0.078 | 11 |
| Non-metallic mineral products industry | 0.074 | 12 | |
| Ferrous metal mining and dressing industry | 0.053 | 13 | |
| Textile industry | 0.047 | 14 | |
| Wood processing and wood, bamboo, rattan, and brown grass products industry | 0.033 | 15 | |
| Electrical machinery and equipment manufacturing industry | 0.030 | 16 | |
| Non-metallic mining and dressing industry | 0.017 | 17 |
Table 3 Intensities of resource consumption and pollution emission by industry |
| Class | Industry type | Water consumption | COD discharge | Land consumption |
|---|---|---|---|---|
| m3/104 yuan of GDP | kg/104 yuan of GDP | ha/108 yuan of GDP | ||
| First Class | Non-ferrous metal mining and dressing industry | 106.5 | 4.88 | 112.63 |
| Tourism | 24.63 | 9.85 | 2.88 | |
| Wine and beverage and refined tea manufacturing industry | 79.4 | 12.09 | 33.19 | |
| Second Class | Pharmaceutical industry | 48.74 | 5.44 | 15.98 |
| Chemical raw materials and chemical products manufacturing industry | 100.8 | 6.37 | 35.83 | |
| Printing and recording media reproduction | 19.8 | 0.32 | 1.27 | |
| Paper and paper products industry | 450.33 | 90.28 | 188.41 | |
| Culture, education, arts & crafts, sports and entertainment products manufacturing industry | 20.68 | 0.22 | 1.02 | |
| Food manufacturing | 60.72 | 6.44 | 20.82 | |
| Agricultural and sideline food processing industry | 93.73 | 12.46 | 30.59 | |
| Third Class | Electric power and thermal production and supply industry | 908.46 | 0.69 | 200.00 |
| Non-metallic mineral products industry | 43.62 | 0.93 | 71.01 | |
| Ferrous metal mining and dressing industry | 93.85 | 1.14 | 16.23 | |
| Textile industry | 160.44 | 7.02 | 31.51 | |
| Wood processing and wood, bamboo, rattan, and brown grass products industry | 34.32 | 1.54 | 12.85 | |
| Electrical machinery and equipment manufacturing | 11.89 | 0.18 | 0.12 | |
| Non-metallic mining and dressing industry | 133.53 | 1.75 | 36.58 |
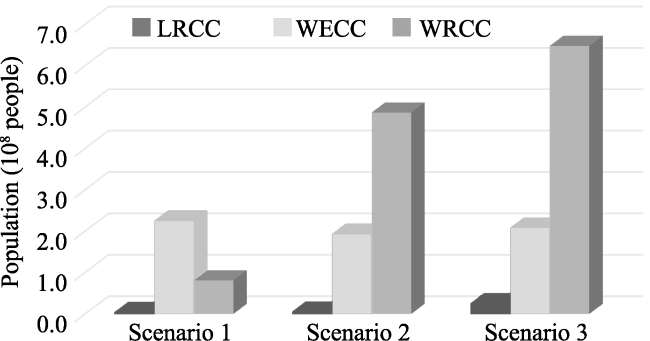
Table 4 Regional resource and environment carrying capacity evaluation |
| Carrying capacities | Business as usual (Scenario 1) | Focus on developing pillar industries (Scenario 2) | Focus on developing tourism (Scenario 3) | |||
|---|---|---|---|---|---|---|
| Population (100 million) | Economy (trillion yuan) | Population (100 million) | Economy (trillion yuan) | Population (100 million) | Economy (trillion yuan) | |
| WRCC | 0.81 | 2.57 | 4.87 | 15.44 | 6.48 | 20.53 |
| WECC | 2.25 | 7.41 | 1.93 | 6.11 | 2.08 | 6.58 |
| LRCC | 0.04 | 0.12 | 0.05 | 0.17 | 0.25 | 0.79 |
Figure 3 RECC comparisons by scenario |
| [1] |
|
| [2] |
|
| [3] |
|
| [4] |
|
| [5] |
First National Pollution Census Leading Group Office of State Council (FNPC), 2008. First national pollution sources survey: Urban living sources and discharge coefficients. accessed on June 6, 2018.
|
| [6] |
General Administration of Quality Supervision, Inspection and Quarantine of China (GAQSIQC), 2017. Industrial classification for national economic activities. accessed in June, 2017.(in Chinese)
|
| [7] |
|
| [8] |
|
| [9] |
|
| [10] |
Lhasa Bureau of Statistics (LBS), 2016. Lhasa Statistics Yearbook. Beijing: China Statistics Press. (in Chinese)
|
| [11] |
|
| [12] |
|
| [13] |
|
| [14] |
|
| [15] |
|
| [16] |
|
| [17] |
Ministry of Ecology and Environment of the People’s Republic of China (MEEC). Environmental Quality Standards for Surface Water (GB 3838-2002). Environmental Quality Standards for Surface Water (GB 3838-2002). Accessed on June 6, 2018.(in Chinese)
|
| [18] |
Ministry of Natural Resources of PRC (MNRC), 2017. General Land Use Planning in Tibet Autonomous Region (2006-2020). accessed on June 6, 2018. (in Chinese)
|
| [19] |
National Bureau of Statistics of China (NBSC), 2016a. China Energy Statistical Yearbook 2016. Beijing: China Statistics Press. (in Chinese)
|
| [20] |
National Bureau of Statistics of China (NBSC), 2016b. China Statistical Yearbook 2016. Beijing: China Statistics Press. (in Chinese)
|
| [21] |
National Bureau of Statistics of China (NBSC), 2016c. China Statistical Yearbook on Environment 2016. Beijing: China Statistics Press. (in Chinese)
|
| [22] |
|
| [23] |
|
| [24] |
|
| [25] |
|
| [26] |
|
| [27] |
|
| [28] |
|
| [29] |
|
| [30] |
|
| [31] |
Tibet Bureau of Statistics (TBS), 2016. Tibet Statistics Yearbook. Beijing: China Statistics Press. (in Chinese)
|
| [32] |
|
| [33] |
|
| [34] |
|
| [35] |
|
| [36] |
|
| [37] |
|
| [38] |
|
| [39] |
|
| [40] |
|
| [41] |
|
/
| 〈 |
|
〉 |