
Journal of Geographical Sciences >
From earth observation to human observation: Geocomputation for social science
|
Li Deren (1939-), Professor and Academician of Chinese Academy of Sciences, Academician of Chinese Academy of Engineering, Academician of Euro-Asia International Academy of Sciences, specialized in the research and education on spatial information science and technology represented by RS, GPS and GIS, and promoting the construction of geographic national monitoring, digital city, digital China, smart city and smart China. E-mail: drli@whu.edu.cn |
Received date: 2018-12-16
Accepted date: 2019-04-15
Online published: 2020-04-21
Supported by
LIESMARS Special Research Funding()
Copyright
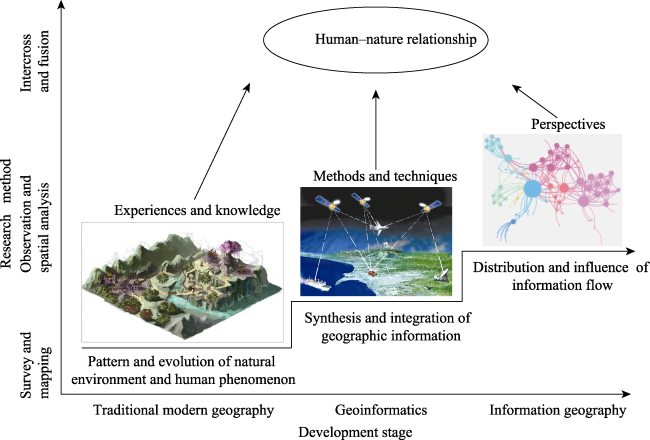
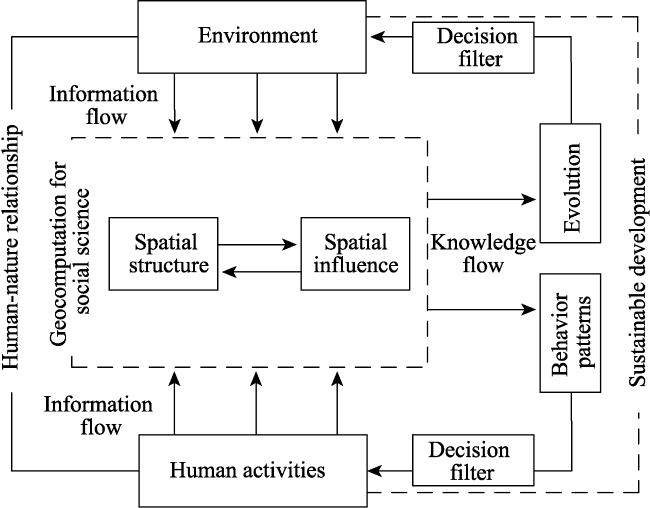
It is possible to obtain vast amounts of spatiotemporal data related to human activities to support the study of human behavior and social evolution. In this context, geography, with the human-nature relationship as its core, is undergoing a transition from strictly earth observations to the observation of human activities. Geocomputation for social science is one manifestation thereof. Geocomputation for social science is an interdisciplinary approach combining remote sensing techniques, social science, and big data computation. Driven by the availability of spatially and temporally expansive big data, geocomputation for social science uses spatiotemporal statistical analyses to detect and analyze the interactions between human behavior, the natural environment, and social activities; Remote sensing (RS) observations are used as primary data. Geocomputation for social science can be used to investigate major social issues and to assess the impact of major natural and societal events, and will surely be an area of focused development in geography in the near future. We briefly review the background of geocomputation in the social sciences, discuss its definition and disciplinary characteristics, and highlight the main research foci. Several key technologies and applications are also illustrated with relevant case studies of the Syrian Civil War, typhoon transits, and traffic patterns.
LI Deren , GUO Wei , CHANG Xiaomeng , LI Xi . From earth observation to human observation: Geocomputation for social science[J]. Journal of Geographical Sciences, 2020 , 30(2) : 233 -250 . DOI: 10.1007/s11442-020-1725-8
Figure 1 Development of modern geography |
Figure 2 Schematic of the methodology of geocomputation for social science |
Table 1 Research foci of geocomputation in social science |
| Research topics | Data type | Main results and conclusions |
|---|---|---|
| Assessment of social and economic development | Nighttime light image | Investigation on the spatial patterns of economic recessions (Li et al., 2014) |
| Identification and evolution analysis of urban agglomeration and urban system (Yu et al., 2014) | ||
| Analyses of the impact of urbanization on ecological environment (He et al., 2015) | ||
| Mobile phone metadata | Socioeconomic status and socioeconomic characteristic of people were inferred (Blumenstock et al., 2015) | |
| Remote sensing image | Population consumption and asset changes were predicted (Jean et al., 2016) | |
| Remote sensing image and online rental information | Poverty measurement of urban internal space (Yuan et al., 2018) | |
| Street view image | The demographics and socioeconomic characteristics were estimated and voting trends in presidential elections were predicted (Fei-Fei L, 2017 ) | |
| Quantifying the street-visible greenery and estimating the economic benefits that the neighbor visible greenery would have on residential developments (Zhang and Dong, 2018) | ||
| High-speed railway and airline networks | The influence of high-speed railway and air networks on urban system was analyzed (Yang et al., 2018) | |
| Causal analysis of major social events | Nighttime light image | The impact of war was assessed (Witmer et al., 2011) |
| Monitoring humanitarian crises (Li et al., 2011) | ||
| The correlation between night light change and disaster loss in earthquake-stricken areas was analyzed (Zhang et al., 2018) | ||
| Assessing the impact of three types of natural disasters: earthquakes, floods, and storms (Zhao et al., 2018) | ||
| Crowd activity in large cities | Mobile phone data | The taxi demand characteristics and potential land use patterns between two places were revealed (Kang et al., 2013) |
| Human mobility was speculated to improve traffic planning and urban planning management (Zhu et al., 2015) | ||
| The disparities in park access were explored (Xiao et al., 2019) | ||
| Nighttime light image | The house vacancy rate was estimated. (Chen et al., 2015) | |
| Nighttime light image and cancer registry data | There is a significant correlation between the intensity of light at night and the incidence of breast cancer. (Bauer et al., 2013) | |
| Nighttime light image and taxi trajectories data | The nighttime light and taxi trajectory data were integrated to estimate population at micro levels. (Yu et al., 2019) | |
| Research topics | Data type | Main results and conclusions |
| Crowd activity in large cities | Taxi trajectories data | The demand-supply of healthcare services was analyzed (Chen et al., 2018) |
| Sharing bikes’ trajectories | Illegal parking behaviors were detected to ease traffic congestion (He et al., 2018) | |
| Transit smart card data | To discuss the influence of housing burden pressure on housing spatial distribution pattern (Li et al., 2018) | |
| Social media data | The development trend and spatial distribution law of emergency events are mined to provide decision-making basis for disaster emergency response (Wang et al., 2016) | |
| Street view image | Image detection methods are used to determine the presence of pedestrian and extract pedestrian count data (Li et al., 2015) | |
| Examining associations between exposure to green and blue spaces as well as geriatric depression (Helbich et al., 2019) | ||
| Crime data | It reveals the spatial-temporal characteristics and influences of crimes, and predicts of space crimes (Liu et al., 2018) | |
| Analysis of human activity in virtual space | Social media data | It extracts the public interest and attention to the event and predicts the reported disease level (Signorini et al., 2011) |
| It reveals the users who made political comments onsocial networking sites were mostly urban males (Barbera and Rivero., 2014) | ||
| The traveler’s family and workplace were estimated and the characteristics of human travel were depicted (Chang et al., 2017) |
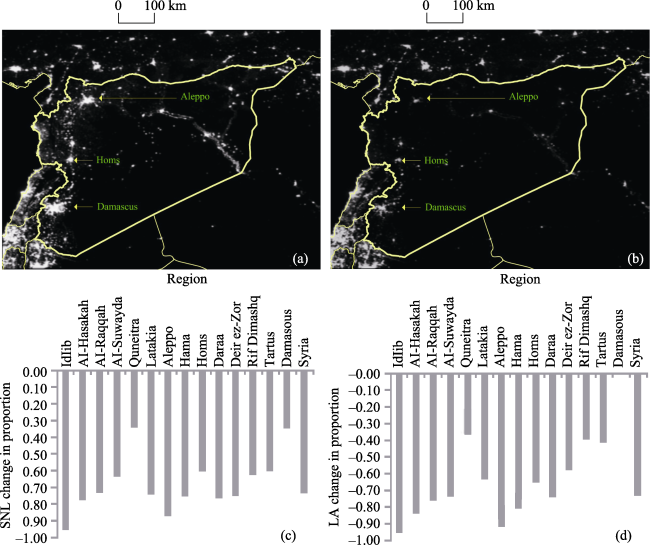
Figure 3 Monthly average nighttime light and its corresponding changes in all Syrian provinces between March 2011 and February 2014: (a) monthly average nighttime light in March 2011; (b) monthly average nighttime light in February 2014; (c) sum of nighttime light (SNL); (d) lit area (LA) |
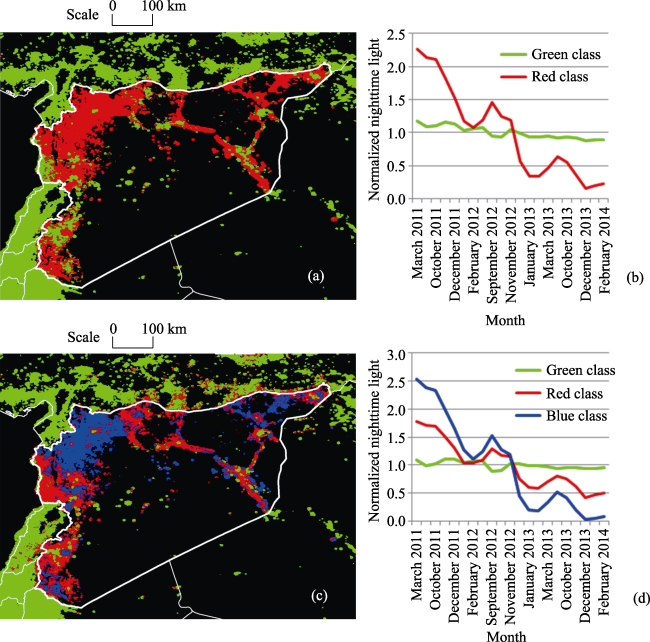
Figure 4 Class maps and centers derived from normalized time series nighttime light images: (a) two-class map; (b) class centers for the two-class map; (c) three-class map; (d) class centers for the three-class map |
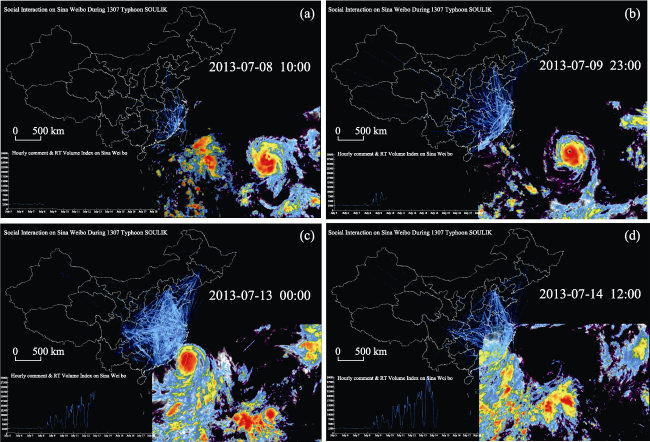
Figure 5 Spatiotemporal propagation paths and evolution of micro-blog topics: (a) tropical disturbance; (b) super typhoon; (c) landing in Fujian; (d) typhoon demise |
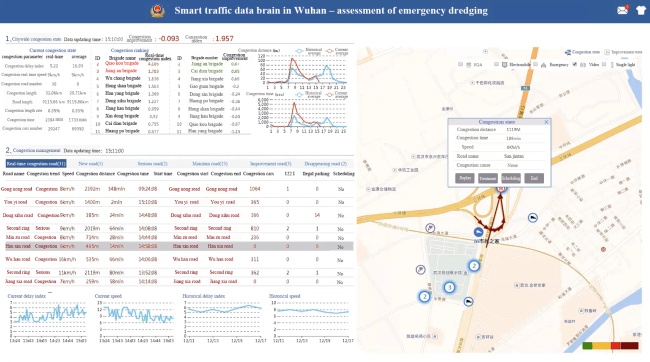
Figure 6 Smart traffic data brain in Wuhan: Assessment of emergency dredging |
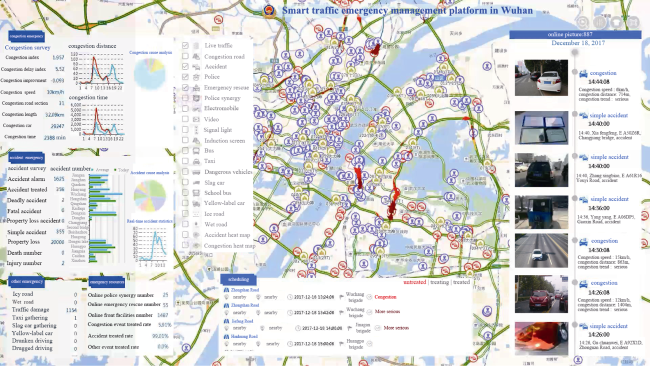
Figure 7 Smart traffic management brain in Wuhan: Smart emergency platform |
| [1] |
|
| [2] |
|
| [3] |
|
| [4] |
|
| [5] |
|
| [6] |
|
| [7] |
China Central Television, 2017. More than 60 drug-related vehicles were seized and 15 people were forcibly detoxified in Wuhan, Hubei province. Retrieved August 26, 2017, from
|
| [8] |
|
| [9] |
|
| [10] |
|
| [11] |
|
| [12] |
|
| [13] |
|
| [14] |
|
| [15] |
|
| [16] |
|
| [17] |
|
| [18] |
|
| [19] |
|
| [20] |
|
| [21] |
|
| [22] |
|
| [23] |
|
| [24] |
|
| [25] |
|
| [26] |
|
| [27] |
|
| [28] |
|
| [29] |
|
| [30] |
|
| [31] |
|
| [32] |
|
| [33] |
|
| [34] |
Wuhan University (WU), 2015. Remote sensing research on the Syrian Conflict has attracted high attention from the global media. Retrieved on March 16, 2015, from
|
| [35] |
|
| [36] |
|
| [37] |
|
| [38] |
|
| [39] |
|
| [40] |
|
| [41] |
|
| [42] |
|
| [43] |
|
| [44] |
|
| [45] |
|
| [46] |
|
/
| 〈 |
|
〉 |