Research Articles

Analog simulation of urban construction land supply and demand in Chang-Zhu-Tan Urban Agglomeration based on land intensive use

  • XIONG Ying 1, 2 ,
  • CHEN Yun 1 ,
  • PENG Fen 1, 2 ,
  • LI Jingzhi 1, 2 ,
  • YAN Xiaojing 1
Expand
  • 1. School of Architecture, Changsha University of Science and Technology, Changsha 410076, China
  • 2. Key Laboratory of Dongting Lake Aquatic Eco-Environmental Control and Restoration of Hunan Province, Changsha 410014, China

Xiong Ying (1977-), PhD and Professor, specialized in land use and urban sprawl, regional and urban planning.E-mail: xiong2001ying@126.com

Received date: 2018-10-17

  Accepted date: 2018-12-20

  Online published: 2019-12-13

Supported by

National Social Science Foundation of China(No.15BJY051)

Social Science Foundation of Hunan Province(No.16ZDB04)

Social Science Foundation of Hunan Province(No.13YBA016)

Research Project of Appraisement Committee of Social Sciences Research Achievements of Hunan Province(No.XSP18ZDI031)

Natural Science Foundation of Hunan Province(No.2017JJ2264)

Science & Technology Research Project of the Department of Land and Resource of Hunan Province(No.2014-13)

Copyright

Copyright reserved © 2019. Office of Journal of Geographical Sciences All articles published represent the opinions of the authors, and do not reflect the official policy of the Chinese Medical Association or the Editorial Board, unless this is clearly specified.

Abstract

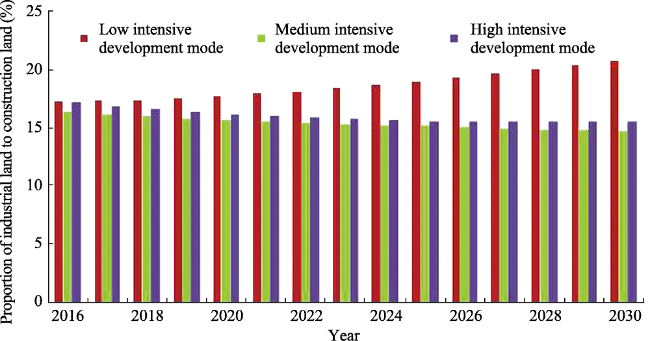
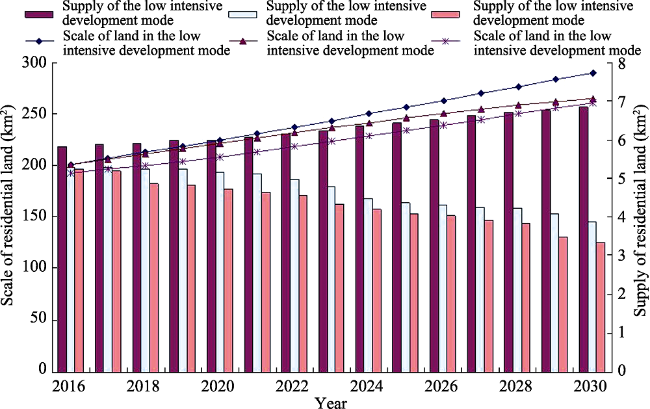
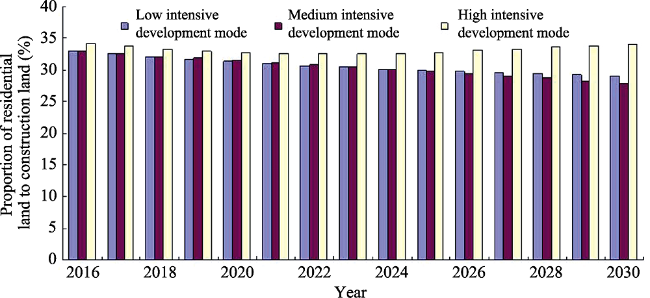
Urban land intensive use is an important indicator in harmonizing the relationship between land supply and demand. The system dynamics (SD) can be used to construct the feedback loop between urban construction land supply and demand and index variable function. Based on this, this study built a supply and demand system dynamic model of urban construction land for Chang-Zhu-Tan urban agglomeration. This model can simulate the change trends of supply and demand of construction land, industrial land, and residential land in 2016-2030 by three scenarios of low, medium, and high intensity modes. The results showed that the scale of construction land of urban agglomeration is expanding, with a rapid increase rate for the urban construction land. The scale and speed of land use based on the three intensity modes existed differences. The large scale and supply of construction land in the low intensity mode caused easily the waste of land resources. In high intensity mode, the scale and supply of construction land were reduced against the healthy development of new-type urbanization. In the medium intensity mode, the scale and supply of land use adapted to the socio-economic development and at the same time reflected the concept of modern urban development. In addition, the results of this study found that the proportion of industrial land in construction land ranged from 15% to 21%, which increased year by year in the low intensity mode, and decreased slowly and stabilized in medium and high intensity modes. The proportion of residential land in construction land ranged from 27% to 35%, which decreased in the low and the medium intensity modes, and maintained a high level in the higher intensity mode. This study contributes to provide scientific reference for decision-making optimization of land supply and demand, urban planning, and land supply-side reform.

Cite this article

XIONG Ying , CHEN Yun , PENG Fen , LI Jingzhi , YAN Xiaojing . Analog simulation of urban construction land supply and demand in Chang-Zhu-Tan Urban Agglomeration based on land intensive use[J]. Journal of Geographical Sciences, 2019 , 29(8) : 1346 -1362 . DOI: 10.1007/s11442-019-1663-5

1 Introduction

Land intensive use that is an important factor of influencing urban growth is closely correlated with economic development and city scale. With the rapid urbanization, land use patterns with the core driving factors of “land finance” and “land investment” bring economic growth and rapid increases of supply and scale of urban construction land (Peng et al., 2014). In China, the area of construction land increased 1004 km2 per 1% increase in urbanization rate in 1980-2005, and increased 3460 km2 in 2006-2030. Due to the regulation of the land policy, small amounts of land with authority approval aggravated contradictions between land supply and demand (Fang and Ma, 2013). Compared with urbanization patterns of land intensive use of developed countries, Chinese land use change caused prominent socio-economic and ecological problems, for example, high quality farmlands and ecological land were occupied due to unlimited urban sprawl and low efficiency of land use (He and Ni, 2013). The Central Work Conference on Urbanization held in December 2013 indicated that improving urban land use efficiency is the main parts of advancing new-type urbanization, and revealed the importance and urgency of strengthening land intensive use (Peng et al., 2014). Therefore, urbanization process should drive land use to be intensive and high efficient, and implement the balance between land supply and demand for improving the quality of urbanization.
Urban land intensive use has currently been the hotspot issues and key areas of the study of urban land use change (Zhao et al., 2010). Researchers have discussed the meaning of land intensive use (Xie et al., 2006; Yang, 2007), comprehensive measure (Wang et al., 2010; Chen et al., 2013), spatiotemporal evolution (He and Xiu, 2011; Deng et al., 2012), and driving mechanism from different perspectives and spatiotemporal scale (Wu and Qu, 2007; Wang and Ji, 2008). A large number of methods were also used to improve land intensive assessment method, such as PSR model, STIRPAT model, GPCA method, improved entropy model, polygon graphic method, and RS method (Yin et al., 2007; Zhu and Cao, 2011; Li et al., 2012; Sun and Chen, 2012; Zhang et al., 2012; Zhou et al., 2012). In addition, the studies on the coordination between urbanization process and land intensive use, the effect of industrial structure on urban land intensive use, the spatiotemporal evolution of inner coordination of land intensive use, the relationship between construction of new district and land intensive use have been developed (Yang and Lang, 2011; Zhou et al., 2012; Fan et al., 2014; Zhang et al., 2014). Many studies found that urban land use is interactions with land supply and demand, land resource optimization, and urban growth and sprawl (Zhou and He et al., 2006; Taleai et al., 2007; Susannah et al., 2008; Zhang et al., 2008; Fan and Zhang, 2012; Wang et al., 2014; Xiong et al., 2016). However, the relationship between land intensive use and land supply and demand, especially simulation model and prediction of urban construction land supply and demand, are less studied. In addition, a study focused on urban agglomeration which has the characteristics of rapid expansion of urban land and significant contradiction between supply and demand of land resource is lacking.
This study will use the system dynamics (SD) to build a simulation decision system model of land supply and demand of construction land for analyzing the change trends and relationship between supply and demand of land resource based on the low, medium, and high intensity modes in Changsha-Zhuzhou-Xiangtan (Chang-Zhu-Tan) urban agglomeration. Simulating the development of future land supply and demand contributes to provide a reference for decision-making optimization of land supply and demand, advancing urbanization and land regulation in a coordinated manner, and land supply-side structural reform.

2 Study area and method

2.1 Study area

Chang-Zhu-Tan urban agglomeration is selected as the study area, which is located in the northeastern part of the province, China. It is the core area of urbanization and economic development of Hunan Province, and the test area of “two-oriented society”. It covers an area of 28,000 km2 with a total population of 14.50 million, urbanization rate of 66.8%, and Gross Domestic Product (GDP) of 1368.19 billion yuan (43.8% of the province’s total). With rapid urbanization, the scale of land use and the urban built-up area were continuously expanding with intense exploitation of land. The area of construction land increased from 232.51 km2 to 485.79 km2 in 2000-2014, and the scale of land use increased 253.28 km2. A large-scale suburban land was expropriated with only cultivated land area of 0.0533 ha/person, which approaches the security line determined by FAO. Therefore, the contradiction between supply and demand of land in the study area is increasingly serious.

2.2 Study method and data collection

2.2.1 Study method
Land intensive use in China is an inevitable choice due to more population with less land and rapid urbanization (Fan et al., 2014). The overall urban land intensive use can reflect urban land supply for determining to what extent meets urban land demand. Therefore, land intensive use becomes a key indicator for balancing the contraction between land supply and demand (Gu et al., 2010; Xiong et al., 2016). The influencing factors of urban land supply and demand system include resources and environment, economic development, production and living, and policies and systems, which have a complicated interaction between each other. The conventional evaluation methods are difficult to be used to analyze the structure and feature of supply and demand system of land. Therefore, this study will use the principles and analytical methods of SD to build the simulation model and the feedback relationship between elements of land supply and demand system for analyzing the internal relationship between land intensive use and construction land supply and demand, and simulating and predicting change trends of land indexes based on the low, medium, and high intensity modes.
SD is an approach to understanding the nonlinear behavior of complex systems over time using stocks, flows, internal feedback loops, table functions and time delays (Li et al., 2013a; 2013b). It is widely applied to strategic analysis and optimal decision making of complicated integral system including society, economy, environment, and management. The process of solving problems using SD mainly includes: 1) defining the purpose of modelling and system boundaries; 2) determining feedback mechanism and developing system structure analysis; 3) constructing causal relationship, building system model, and revising parameters according to the simulation results; and 4) applying and optimizing the strategy experiment. This study used a Vensim-PLE software to build a supply and demand system dynamic simulation model of construction land for dynamic simulation and prediction of supply and demand of construction land.
2.2.2 Data collection
Due to data availability, the area of construction land use and social economic data were collected from China statistical yearbook of urban construction, statistical yearbooks and statistical bulletins of the national economic and social development of Hunan Province, Changsha City, Zhuzhou City, and Xiangtan City, and overall city planning, land use planning, land utilization alteration data of Changsha, Zhuzhou, and Xiangtan. Vacancy rates of industrial land and residential land, and land reserves were acquired from conservation intensive assessment report of Hunan Province land resources, land intensive use assessment report of Hunan Province industrial park, Chang-Zhu-Tan urban expansion and land change dynamic monitoring report, and report of supply, conservation intensive use evaluation, and vacancy of construction land in Changsha, Zhuzhou, and Xiangtan (Xiong et al., 2016).

3 Construction of the supply and demand system dynamic model of construction land in Chang-Zhu-Tan urban agglomeration

3.1 System space boundary

The space boundary of supply and demand of land is the urban districts of Chang-Zhu-Tan urban agglomeration with a total area of 3438.15 km2, which includes urban-level districts of Furong, Tianxin, Kaifu, Yuelu, and Yuhua of Changsha, Tianyuan, Lusong, Hetang, Shifeng of Zhuzhou, and Yuhu and Yuetang of Xiangtan. The equation of system simulation model was constructed based on the collected data for the years 2001-2013 with the year 2000 as base year. It was then used to predict supplies and demands of construction land, industrial land, and residential land for the years 2016-2030 with the time step of one year.

3.2 System modeling indicator and feedback relationship

The supply and demand system dynamic model was constructed with Vensim-PLE software based on the characteristics of supply and demand of land and socio-economic development. Table 1 shows the variables the simulation model used. Housing price and industrial power consumption and enterprise quantity above designated size can indirectly reflect scale of land use for influencing land intensive use level. The fluctuation of housing price influences local government for constituting land use policy, further influences supply of residential land, and at the same time stimulates market to demand of residential land. The unbalanced supply and demand of land will therefore influence land intensive use. Industrial power consumption above designated size reveals the scale and efficiency of industrial economic development and correlates with demand of industrial land. To a certain extent, the efficiency will affect land intensive use. Enterprise quantity above designated size can reflect the quantity of industrial land, which also influence land intensive use.
Table 1 Main indexes of land supply and demand system model
Variable name Variable type Variable explanation
Scale of construction land Status variable Z1 Total construction land
Scale of industrial land Status variable Z2 Total industrial land
Scale of residential land Status variable Z3 Total residential land
Theoretical demand of construction land Auxiliary variable F1 Theoretical demand of construction land with the urban development
Theoretical demand of industrial land Auxiliary variable F2 Theoretical demand of industrial land with the urban development
Theoretical demand of residential land Auxiliary variable F3 Theoretical demand of residential land with the urban development
Supply of construction land Auxiliary variableF4 Annual increase of construction land
Supply of industrial land Auxiliary variable F5 Annual increase of industrial land
Supply of residential land Auxiliary variable F6 Annual increase of residential land
Basic demand of construction land Auxiliary variable F7 Theoretical demand of construction land minus the existing scale
Basic demand of industrial land Auxiliary variable F8 Theoretical demand of industrial land minus the existing scale
Basic demand of residential land Auxiliary variable F9 Theoretical demand of residential land minus the existing scale
Effective demand of industrial land Auxiliary variable F10 Basic demand of industrial land minus vacancy
Effective demand of residential land Auxiliary variable F11 Basic demand of residential land minus vacancy
Population Table function D1 Annual population of Chang-Zhu-Tan urban agglomeration
GDP Table function D2 Annual GDP of Chang-Zhu-Tan urban agglomeration
Total intensity Table function D3 Total intensity of land use every year
Land reservation Table function D4 Annual land reservation
Industrial power consumption above designated size Table function D5 Annual industrial power consumption above designated size
The number of enterprises above the scale Table function D6 The number of enterprises above the scale every year
Housing area per capita Table function D7 Annual housing area per capita
Industrial production Table function D8 Annual industrial production
Per capita disposable income Table function D9 Annual per capita disposable income
Housing price Table function D10 Annual housing price
Structure index of industrial land Table function D11 Proportion of industrial land to construction land
Structure index of residential land Table function D12 Proportion of residential land to construction land
Vacancy rate of industrial land Table function D13 Annual proportion of vacant industrial land to total industrial land
Vacancy rate of residential land Table function D14 Annual proportion of vacant residential land to total residential land
This study focused on the supply and demand of land, and used the intensive degree as the measuring indicator of rate control (Gu et al., 2010), which can be used to help adjust land supply and the proportion of all kinds of land supply. The constructed SD model in Figure 1 includes three feedback loops: 1) scale of construction land → demand of construction land → supply of construction land → scale of construction land; 2) scale of industrial land → demand of industrial land → supply of industrial land → scale of industrial land; 3) scale of residential land → demand of residential land → supply of residential land → scale of residential land. In the feedback relationship of 1), the intensive degree and land reserve quantity are used as the indicators of controlling supply of construction land to adjust the supply and demand of construction land. In the feedback relationship of 2) and 3), structure index and quantities of effective demands of industrial and residential lands are used to adjust the supplies and demands of industrial and residential lands.
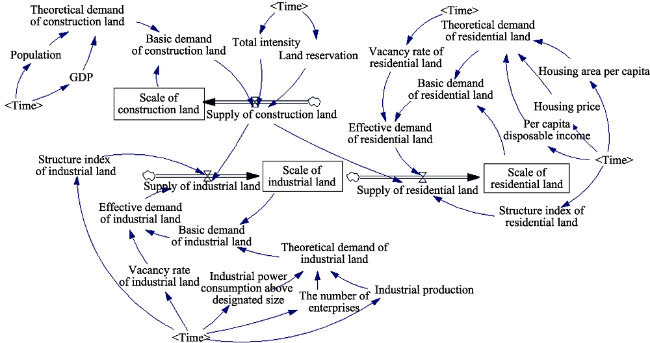
Figure 1 Dynamics model of urban construction land supply and demand system

3.3 Model variable equation

The index variable equation in this study was constructed using mathematical statistical analysis and simulation hypothesis method. The coefficients of index variables were determined by developing a regression analysis based on the index variables in SPSS software. Table 2 shows the result of regression based on the annual population, GDP, and actual demand of construction land in Chang-Zhu-Tan urban agglomeration in 2001-2013. R square of 0.994 indicates that population and GDP can be well used to describe the theoretical demand of construction. Table 3 shows the regression equations of all index variables.
Table 2 The result of regression based on annual population, GDP and actual demand of construction land
Indicator Unstandardized coefficient Standard coefficient t Sig.
B Standard deviation
Constant -264.217 81.619 - -3.237 0.009
Total population 1.576 0.253 0.762 6.220 0.000
GDP 0.013 0.007 0.239 1.947 0.080
Table 3 Variable equation of system model index
Indicator variable Equation
Scale of construction land Status variable Z1=INTEG (Supply of construction land)
Scale of industrial land Status variable Z2=INTEG (Supply of industrial land)
Scale of residential land Status variable Z3=INTEG (Supply of residential land)
Theoretical demand of construction land Auxiliary variable F1=population*1.576+GDP*0.013-264.217
Theoretical demand of industrial land Auxiliary variable F2=industrial production*0.0053+industrial power consumption above designated size*0.416+ the number of enterprises above the scale*0.0027+32.015
Theoretical demand of residential land Auxiliary variable F3=housing price *0.044-per capita disposable income *0.004+housing area per capita*3.387-73.844
Supply of construction land Auxiliary variable F4=IF THEN ELSE (land reservation*0.6-basic demand of construction land*1.5(1-total intensity)>=0, basic demand of construction land*1.5(1-total intensity), land reservation *0.6)
Supply of industrial land Auxiliary variable F5=IF THEN ELSE (1.3*supply of construction land*structure index of industrial land-effective demand of industrial land>=0, effective demand of industrial land, 1.3* supply of construction land * structure index of industrial land)
Supply of residential land Auxiliary variable F6=IF THEN ELSE (1.5*supply of construction land* structure index of residential land-effective demand of residential land>=0, effective demand of residential land, 1.5*supply of construction land*structure index of residential land)
Basic demand of
construction land
Auxiliary variable F7=theoretical demand of construction land-scale of construction land
Basic demand of
industrial land
Auxiliary variable F8=theoretical demand of industrial land-scale of industrial land
Basic demand of
residential land
Auxiliary variable F9=theoretical demand of residential land-scale of residential land
Effective demand of industrial land Auxiliary variable F10=basic demand of industrial land* (1-vacancy rate of industrial land)
Effective demand of residential land Auxiliary variable F11=basic demand of residential land* (1-vacancy rate of residential land)

Note: The other indexes,population, GDP, total intensity, land reservation, added value of industry, industrial power consumption above designated size, the number of enterprises above the scale, structure index of industrial land, housing area per capita, per capita disposable income, housing price, structure index of residential land, vacancy rate of industrial land, vacancy rate of residential land

3.4 System simulation

The system simulation model of supply and demand of construction land built in Venim-PLE software was used to simulate total population, GDP, and scale of construction land of Chang-Zhu-Tan urban agglomeration in 2001-2013 with 2000 as base year. Table 4 shows that the relative error between simulated and actual values was less than 5%, which is fairly accurate. Therefore, the system dynamic model can well and reliably simulate the supply and demand of land.
Table 4 Simulation data and statistic data of land supply and demand system in Chang-Zhu-Tan urban agglomeration
Year Total population/104
persons
GDP/108 yuan Increase value of industry/108 yuan Scale of construction land/km2
Actual value Simulation value Deviation% Actual value Simulation value Deviation % Actual value Simulation value Deviation% Actual value Simulation value Deviation %
2001 324.94 324.94 0.00 759.36 759.36 0.00 267.03 267.03 0.00 255.07 255.07 0.00
2002 328.80 335.41 2.01 830.85 860.33 3.55 293.25 304.96 3.99 268.81 272.75 1.47
2003 339.20 344.62 1.60 900.23 884.38 1.76 312.30 314.79 0.80 287.01 290.81 1.32
2004 349.93 352.06 0.61 1104.15 1062.33 3.79 362.60 345.96 4.59 300.22 303.36 1.05
2005 361.00 359.31 0.47 1349.64 1346.61 0.22 421.74 404.36 4.12 314.05 317.31 1.04
2006 372.42 365.93 1.74 1645.18 1591.93 3.24 524.14 503.18 4.00 337.74 331.93 1.72
2007 384.19 370.27 3.62 1953.97 1886.14 3.47 699.25 725.90 3.81 356.55 351.40 1.44
2008 396.34 386.06 2.59 2429.29 2486.22 2.34 881.82 906.61 2.81 386.07 379.91 1.60
2009 408.88 409.72 0.21 2994.94 3144.80 5.00 1212.15 1204.76 0.61 423.04 417.31 1.35
2010 421.81 433.63 2.80 3565.72 3695.42 3.64 1496.52 1458.41 2.55 468.25 461.36 1.47
2011 435.15 447.15 2.76 4513.05 4700.14 4.15 1947.60 2012.52 3.33 496.30 495.61 0.14
2012 448.91 448.52 0.09 5112.73 5308.80 3.83 2281.05 2259.65 0.94 514.47 505.78 1.69
2013 463.11 457.92 1.12 5895.84 5921.24 0.43 2416.18 2442.67 1.10 523.12 516.32 1.30

4 Scheme simulation and results

4.1 Scheme simulation

The three scenario hypotheses of the land supply and demand model were conducted according to the selected standard of control variables for comprehensively understanding the supply and demand of urban construction land based on different development modes (Gu et al., 2010; Xiong et al., 2016). The first scenario hypothesis: based on the development mode of low intensity, it resulted in the low and annually decreased land use intensity, high vacancy rate of land, low structure index of residential land, the structure index of industrial land of high level, housing area per capita, industrial power consumption above designated size, and the number of enterprises above the scale of rapid growth, and housing price and per capita disposable income of slow growth. The second scenario hypothesis: the development mode of medium intensity compared to the development mode of low intensity, it resulted in the medium and annually increased land use intensity, decreased vacancy rate of land, increased structure index of residential land, unchanged structure index of industrial land, housing area per capita, industrial power consumption above designated size, and the number of enterprises above the scale growing slower, and housing price and per capita disposable income growing faster. The third scenario hypothesis: the development mode of high intensity compared to the development modes of low and medium intensities, it resulted in the high and annually increased land use intensity, low vacancy rate of land, the maximum structure index of residential land, structure index of industrial land of rapid decline, annually decreased housing area per capita, industrial power consumption above designated size and the number of enterprises above the scale changing slower, and housing price and per capita disposable income growing fastest. Table 5 shows the index parameters of different prediction scenarios.

4.2 Results

According to the index parameters in Table 5, the index values in 2016-2030 were calculated in Table 6 and then were input in the feedback system of SD with the form of the table function. The prediction results of the scales and supplies of construction, industrial, and residential lands based on different scenarios of intensive development modes and the relationships between supplies and demands of lands were obtained using the simulation model constructed in the Vensim-PLE software.
Table 5 Main prediction indexes in Chang-Zhu-Tan urban agglomeration from 2016 to 2030
Parameter Low intensive development mode Medium intensive development mode High intensive development mode
Total intensity 0-25, assuming the annual decrease and stable of
intensity
25-75, assuming the annual increase and stable
of intensity
75-100, assuming the annual increase and stable of intensity
Population See prediction value in Table 6 See prediction value in
Table 6
See prediction value in Table 6
GDP See prediction value in Table 6 See prediction value in
Table 6
See prediction value in Table 6
Increase value of
industry
See prediction value in Table 6 See prediction value in
Table 6
See prediction value in Table 6
Land reservation Annual average decline
of 1.5%
Annual average decline
of 1%
Annual average decline
of 0.8%
Vacancy rate of
residential land
3%-5% 2%-3% <1%
Housing area per capita Annual average growth
of 2.5%
Annual average growth
of 1.5%
Annual average decline of 2%
Housing price Annual average growth
of 2.5%
Annual average growth
of 5%
Annual average growth of 8%
Per capita disposable income Annual average growth of 4% Annual average growth
of 7%
Annual average growth of 10%
Structure index of
residential land
0.20-0.26 0.26-0.32 0.32-0.40
Vacancy rate of
industrial land
Annual average growth of 2% Annual average decline
of 1%
Annual average decline of 3%
Industrial power
consumption above
designated size
Annual average growth of 7% Annual average growth
of 3%
Annual average growth of 1%
The number of
enterprises above
the scale
Annual average growth of 4% Annual average growth
of 2%
Annual average growth of 1%
Structure index of
industrial land
Annual average growth of 2% Keeping unchanged Annual average decline of 1%
Table 6 Prediction of population, GDP, and industrial production in Chang-Zhu-Tan urban agglomeration from 2016 to 2030
Year Population (104) GDP (108 yuan) Increase value of industry
(108 yuan)
2016 493.33 7639.87 3003.56
2017 505.09 8258.70 3195.79
2018 516.84 8886.36 3397.13
2019 528.60 9499.52 3597.56
2020 540.35 10116.99 3802.62
2021 552.10 10744.24 4004.16
2022 563.86 11388.90 4204.36
2023 575.61 12060.84 4410.38
2024 587.37 12748.31 4617.66
2025 599.12 13462.22 4820.84
2026 610.87 14202.64 5008.85
2027 622.63 14955.38 5194.18
2028 634.38 15703.15 5386.37
2029 646.14 16425.49 5574.89
2030 657.89 17131.79 5758.86
4.2.1 The analysis of the relationship between supply and demand of construction land
(1) The scale prediction of construction land
The prediction results of construction land scale based on the development modes of low, medium, and high intensities are shown in Figure 2. The areas of urban construction land under the three development modes in 2030 were 1003.05 km2, 959.15 km2, and 769.96 km2, respectively. The construction land scale increased rapidly in the development modes of low and medium intensities from 2016 to 2030, and the annual growth rates of land use were 4.2% and 3.7%. The construction land scale increased slowly in the development mode of high intensity from 2016 to 2030, and the annual growth rate of land use was 2.3%.
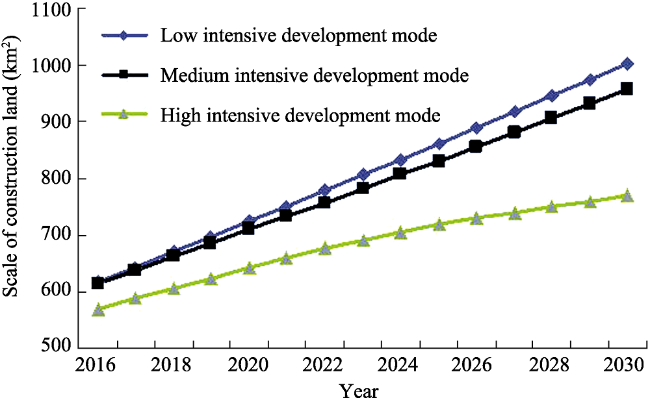
Figure 2 Construction land scale in different intensive development modes
(2) The supply prediction of construction land
The supply changes of construction land based on different development modes are shown in Figures 3-5. In order of the supplies of construction land from low to high, the development modes are as follows: high intensity, medium intensity, and low intensity. The supply change of construction land was stable in the development modes of low and medium intensities, and decreased annually in the high intensive development mode.
(3) The relationship analysis between intensity and land supply and demand in different development modes
The extremum method was used for the dimensionless treatments of the intensity and the proportion of supply to demand to analyze the relationship between intensity and land supply and demand. Figure 3 shows that the demand and supply of urban construction land are increasing in the low intensive development mode. The ever-increasing proportion of supply to demand indicates that the supply of land can meet the demand. The scale of construction land increases rapidly. The increasing land supply and decreasing land intensive use indicate that the extensive land use patterns and inefficient land use will be easy to result in a waste of land supply and the low effective demand of land use. This development mode in the limited land resources will cause the infinite extension of construction land against the control of the scale of construction land.
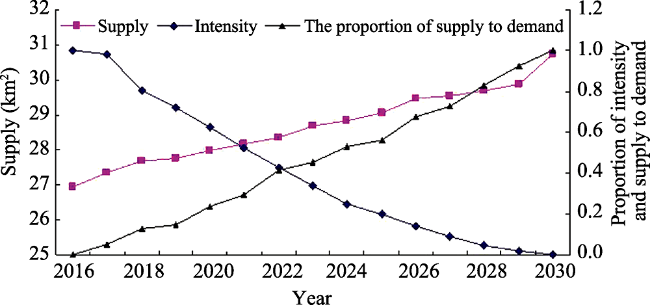
Figure 3 The relationship between land supply and demand in the low intensive development mode
Figure 4 shows the relationship between supply and demand of construction land in the medium intensive development mode from 2016 to 2030. The efficiency of inner urban construction land use is improving and the demand of construction land meets the actual demand in the development mode. Figure 5 shows that the proportion of supply to demand had a trend of decreasing, which indicates that 1) the actual demand of the construction land is controlled in the range of minimum; 2) the scale of land use is controlled effectively in the source of supply; and 3) the supply of land meets the demand of urban construction land. Therefore, the demand of urban land use controlled in a reasonable range, the scale of urban construction land keeping in the stable level without rapid extension, and the improved efficiency and rationalization of land use can be concluded in the medium intensive development mode. Figure 5 shows that the proportion of supply to demand is decreasing and the scale of land use is increasing slowly in the high intensive development mode due to the reduced land supply. Although land supply and the effective demand of construction land keep a basic balance, the construction land area per capita is decreasing because of the increase of urban population in this mode. These will affect the development and promotion of urbanization, as well as the coordinated development of urban-rural integration.
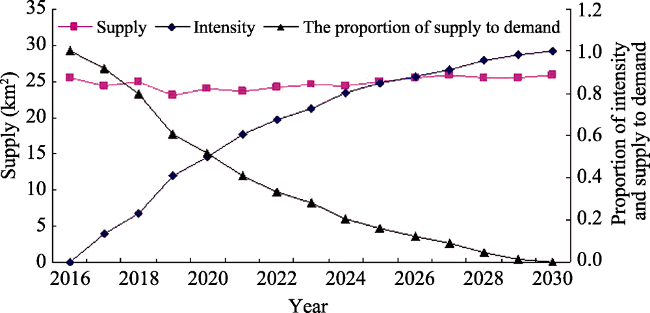
Figure 4 The relationship between land supply and demand in the medium intensive development mode
Figure 5 The relationship between land supply and demand in the high intensive development mode
4.2.2 The analysis of supply and demand of industrial land
(1) The prediction of industrial land scale
The prediction results of industrial land scale in the low, medium, and high intensive development modes are shown in Figure 6. The area of industrial land achieved to 209.67 km2 in 2030, with a high increase rate in the low intensive development mode. The reason is that the annual growth rate of the structure index of industrial land is 2%, which has a significant influence on the proportion of industrial land to urban land in this development mode. The scale of industrial land increased slowly in the medium and high intensive development modes, with 142.72 km2 and 120.68 km2.
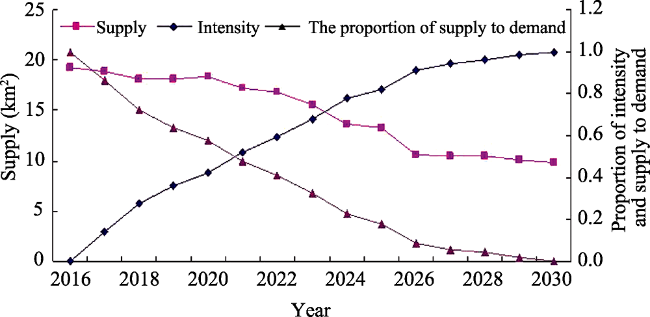
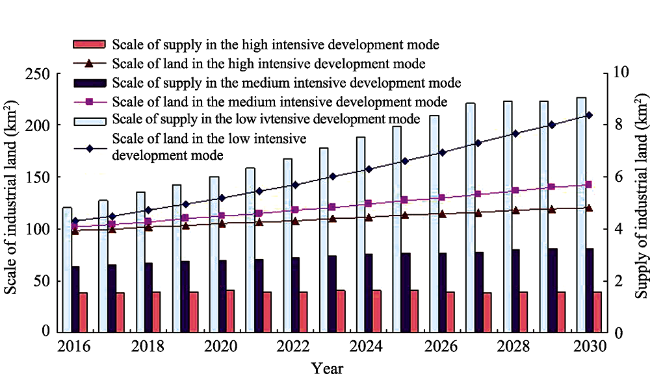
Figure 6 Scale change of industrial land in different intensive development modes
(2) The prediction of industrial land supply
Figure 6 shows the prediction results of industrial land supply of Chang-Zhu-Tan urban agglomeration in 2016-2030. The supply of industrial land increased rapidly year by year and flattened out in the latter period, because the scale of industrial land is closely related with the increases of industrial power consumption and the number of industrial enterprises. The efficiency of urban land use is promoted for eliminating the scale expansion madly with the social economic development. The supply of industrial land in the high intensive development mode was less than that in the medium intensive development mode, and the increases of the supplies in the two modes were slow.
(3) The proportion of industrial land to construction land
Figure 7 shows that the proportions of industrial land to construction land in the three development modes ranged from 15% to 23%. The proportion increased annually in the low intensive development, and decreased slowly and tended to be stable in the medium and high development modes. The high supply of construction land and increased demand of industrial land resulted in more construction land converting to industrial land, with a proportion of 22.89% in the low intensive development mode. The scales of land use in the medium and high intensive development modes were tightly controlled for low proportion of industrial land.
Figure 7 The proportion of industrial land to construction land in different intensive development modes
4.2.3 The prediction of residential land
(1) The prediction of residential land scale
The prediction results of residential land scale in different development modes are shown in Figure 8. The scale of residential land from 2016 to 2030 increased rapidly in the low intensive development mode, increased slowly in the medium intensive development mode, and started to increase slowly from the low level in the latter period in the high intensive development mode. The scales of residential land in the low, medium, and high intensive development modes were 292.11 km2, 266.99 km2, and 262.26 km2, respectively.
Figure 8 Scale change of residential land in different intensive development modes
(2) The prediction of residential land supply
The supply of residential land in the low intensive development mode was larger than that in the medium and high intensive development modes, which resulted in the large scale of residential land. The supplies in the medium and high intensive development modes decreased obviously, but the scale of residential land in the medium intensive development mode was larger than that in the high intensive development mode. The share of residential land is decreasing because the total supply of urban construction land was declining with the increase of the intensity.
(3) The proportion of residential land to construction land
Figure 9 shows that the proportions of residential land to construction land in the three development modes ranged from 27% to 35%. The proportion of residential land to construction land declined in the low and medium intensive development modes, because large supply of urban land resulted in the large scale of construction land. The proportion of residential land to construction land maintained at a high level in the high intensive development mode, because the restricted supply of urban land can control the scale of construction land, and high population density increases the demand of residence. The total residential land in the high intensive development mode was lower than that in the low and medium intensive development modes.
Figure 9 The proportion of residential land to construction land in different intensive development modes

5 Conclusions and discussion

5.1 Conclusions

The improvement of the intensive use level of urban land is the key for implementing the balance of urban land supply and demand and promoting the quality of urbanization. The study on the simulation model of land supply and demand investigated the issue of structural reform of land resource supply for promoting the coordination between the socio-economic development and intensive and efficient uses of land resources. According to the contradiction between land supply and demand and the advantage of system dynamic analyzing the complex problems, the land supply and demand of Chang-Zhu-Tan urban agglomeration were simulated by constructing land supply and demand system model in this study. This model can predict the scenarios and changes of land supply and demand with the low, medium, and high intensities in 2016-2030.
(1) The scale of construction land of urban agglomeration is expanding, with a rapid increase rate. The areas of construction land in 2030 were predicted to be 1003.05 km2, 959.15 km2, and 769.96 km2 in the low, medium, and high intensive development modes respectively. The scales of construction land in the low and medium intensive development modes increase linearly with the annual growth rates of 4.2% and 3.7%. The scale of construction land in the high intensive development mode increases slowly, with the annual growth rate of 2.3%, and increases more slowly in the latter period.
(2) The supply of land increases rapidly in the low intensive development mode, but the intensive use of land is decreasing. This development mode in the limited land resources will cause the infinite extension of construction land against the control of the scale of construction land. The supply of urban land use and the proportion of supply to demand are decreasing in the high intensive development mode. The slow growth of land use scale is incompatible with the rapid urbanization, which is not conducive to the benign development of the social economy. The scale and supply of land in the medium intensive development mode are appropriate to the urban socio-economic development. The efficiency improvement of urban construction land and the effective controlled land scale can present the concept of modern urban development.
(3) The scale and supply of industrial land increase rapidly, especially in the low intense development mode, because the scale of industrial land is closely related with the increases of industrial power consumption and quantity of industrial enterprise. The increase of supply of industrial land tends to be stable in the medium and high intense development modes, but the supply in the high intense development mode is less than that in the medium intense development mode. The proportions of industrial land to construction land in the three development modes range from 15% to 23%. The proportion increases annually in the low intensive development, and decreases slowly and tends to be stable in the medium and high development modes.
(4) The scale of residential land increases rapidly in the low intensive development mode, increases slowly in the medium intensive development mode, and is in the low level in the high intensive development mode compared to the low and medium development modes. The supply of residential land in the low intensive development mode is larger than that in the medium and high intensive development modes. The proportions of residential land to construction land in the three development modes range from 27% to 35%. The proportion of residential land to construction land declines in the low and medium intensive development modes. The proportion of residential land to construction land maintains at a high level in the high intensive development mode, because the restricted supply of urban land controls the scale of construction land, and high population density increases the demand of residence. The total residential land in the high intensive development mode is lower than that in the low and medium intensive development modes.

5.2 Discussion

(1) The influencing factors of urban land supply and demand system include resources and environment, economic development, production and living, and policies and systems, which have a complicated interaction between each other. The dynamic analysis of supply and demand balance of land resources using the SD method can solve the issue of correlation factor separation in static analysis for describing the change trend of land supply and demand system. The influence indicators of supply and demand changes of urban construction land were simulated. The administrative department according to the settings of different indicators can observe the possible land supply and demand occurred in the land market for assessing and analyzing the cause of the contradiction between land supply and demand. Then the scientific and reasonable land control and allocation plan were proposed for promoting conservation and intensive use of land resources, building resource-conserving society, promoting coordination between socio-economic development and the carrying capacity of land resources, and ensuring the steady and rapid socio-economic development.
(2) The simulation model and coordination of urban land supply and demand system from land intensive use perspective are still studied using the SD theoretical method because of the complexity of land supply and demand system. Therefore, the constructions of indicators and models, and scheme simulation have varying degrees of insufficiency and flaw. The development of Chang-Zhu-Tan urban agglomeration has shifted from extension-oriented development to intension-oriented development together with extension-oriented development. The driving force of the development of tertiary industry, ecological construction, and the control of real estate to urban land is being enhanced. The influence of these factors should be considered in the selection of evaluation indicator, and the construction and the parameter settings of dynamic model. The analyses of the association and impact mechanism between supply and demand of land use and the rate and quality of urbanization, urban development orientation, and land ecology policy should be strengthened. In addition, some indicators, e.g., vacancy rates of industrial land and residential land in some years, being calculated because of the limited materials, statistical range change, and the adjustment of administrative district, will affect the accuracy of results. Therefore, the selection of indicator of simulation modeling and the construction of the model need to be optimized. The interactive mechanism between land intensive use and land supply and demand, spatial allocation of land resources, and spatial relationship of land use of urban agglomeration, need to be further studied.
[1]
Chen Y, Chen Y R, Ma W B , 2013. Colligation evaluation of industrial land intensive use in Hubei Province based on 365 valid questionnaires of typical industrial enterprises. Journal of Natural Resources, 28(1):73-80. (in Chinese)

[2]
Deng C X, Xie B G, Li X Q et al., 2012. Analysis on spatial-temporal change of cultivated land intensive use in Changsha. Transactions of the Chinese Society of Agricultural Engineering, 28(1):230-237. (in Chinese)

[3]
Fan H, Liu W D, Wu Z B , 2014. Spatio-temperal characteristics of internal coordination of intensive urban land use: A case study of the downtown of Wuhan. Scientia Geograhica Sinica, 34(6):696-704. (in Chinese)

[4]
Fan J, Zhang Y K , 2012. A preliminary analysis of land resource constraints on urban expansion of Beijing based on land supply and demand. Journal of Resources and Ecology, 3(3):253-261.

[5]
Fang C L, Ma H T , 2013. New city district development and intensive land use in the context of new-type urbanization. China Land Sciences, 27(7):4-10. (in Chinese)

[6]
Gu J R, Chen X W, Yang H L , 2010. System dynamic model of land supply and demand in Chengdu. Geography and Geo-Information Science, 26(4):81-85. (in Chinese)

[7]
He P, Ni P , 2013. Study on the quality of China's urbanization. Statistical Research, 30(6):11-18. (in Chinese)

[8]
He W, Xiu C L , 2011. Analysis of spatial difference in regional urban land intensive utilization: a case study of Jilin Province. Journal of Natural Resources, 26(8):1287-1296. (in Chinese)

[9]
Li J G, Zhang X J, Gao Y M et al., 2012. Dynamic analysis and evaluation on the degree of urban land intensive use based on improved entropy model: A case of Guangzhou City. Areal Research and Development, 31(4):118-123. (in Chinese)

[10]
Li J Z, Zhu X, Li J B , 2013 a. Research on the dynamics analysis and optimization decision-making of water resources supply and demand system in Dongting Lake district. Journal of Natural Resources, 28(2):199-210. (in Chinese)

[11]
Li X X, Xu L, Jiang E C , 2013 b. Multi-objective optimization of land use structure in western Jilin Province based on system dynamics. Transactions of the Chinese Society of Agricultural Engineering, 29(16):247-254. (in Chinese)

[12]
Peng C, Chen L Y, Han F , 2014. The analysis of new-type urbanization and the intensive urban land use: Spatial-temporal evolution and their relationship. Geographical Research, 33(11):2005-2020. (in Chinese)

[13]
Sun Y J, Chen Z G . Coordinated development between urban land intensive use and urbanization level in Jiangsu Province.Resources Science, 34(5):889-895. (in Chinese)

[14]
Susannah G E, Handley J F, Ennos A R et al., 2008. Characterizing the urban environment of UK cities and towns: A template for landscape and urban planning. Landscape and Urban Planning, 87(3):210-222.

[15]
Taleai M, Sharifi A, Sliuzas R et al., 2007. Evaluating the compatibility of multi-functional and intensive urban land uses. International Journal of Applied Earth Observation and Geoinformation, 9(4):375-391.

[16]
Wang J, Zheng Z Y, Huang X Y et al., 2014. Rethinking the current land use strategies of solving the conflicts between land supply and demand in China. China Land Sciences, 25(4):9-12. (in Chinese)

[17]
Wang J T, Ji K W , 2008. Study on dynamic mechanism of urban land intensive use. Urban Problems, ( 8):9-13. (in Chinese)

[18]
Wang Z Y, Fu L P, Chen W D , 2010. Evaluation and empirical analysis of intensive use of urban land in China: Taking three major urban agglomerations as an example. Exploration of Economic Issues, ( 11):96-99.

[19]
Wu Y L, Qu F T , 2007. Mechanism of intensive urban land use in China: Theoretical and practical study. Resources Science, 29(6):106-113. (in Chinese)

[20]
Xie M, Hao J M, Ding Z Y et al., 2006. Study on connotation of intensified urban land use and its evaluation index. Journal of China Agricultural University, 11(5):117-120. (in Chinese)

[21]
Xiong Y, Su T, Li H et al., 2016. Dynamic econometric analysis of the relationship between economic development and land intensive utilization in Chang-Zhu-Tan urban agglomeration. Scientific and Technological Management of Land and Resource, 33(3):1-8. (in Chinese)

[22]
Xiong Y, Yu T, Su T , 2016. Analysis of land supply and demand forecasting and distribution pattern of Chang-Zhu-Tan urban agglomeration. China Population, Resources and Environment, 26(5):222-225. (in Chinese)

[23]
Xiong Y, Zhong M Z, Su et al., 2016. Study on urban land supply and land comprehensive benefit demand of Chang-Zhu-Tan urban agglomeration. Natural Resource Economics of China, ( 3):39-44. (in Chinese)

[24]
Yang S H , 2007. Connotation of intensive use of urban land and the construction of its evaluation index system. Exploration of Economic Issues, ( 1):27-30. (in Chinese)

[25]
Yang Y, Lang Y J , 2011. Impacts of urbanization on land use efficiency and its regional differences in inland area of China regarding the opening reform. China Land Sciences, 25(10):20-26. (in Chinese)

[26]
Yin J, Xie J Q, Wang Li et al., 2007. The evaluation of urban land intensive use based on RS. Journal of Natural Resources, 22(5):775-782. (in Chinese)

[27]
Zhang H H, Zeng Y N, Tan R et al., 2011. A model for regional land use optimization allocation based on multi-agent system and its application. Acta Geographica Sinica, 66(7):972-984. (in Chinese)

[28]
Zhang L Q, Chen S P, Chen B P , 2014. Measurement and analysis of impact of industrial structure evolution on urban land intensive use in Anhui Province in 1996-2011. Scientia Geograhica Sinica, 34(9):1117-1124. (in Chinese)

[29]
Zhang L Q, Chen S P, Wang W Q et al., 2012. Research on the driving factor measurement of the construction land expansion in Chizhou city, Anhui Province: Based on the STIRPAT model. Progress in Geography, 31(9):1235-1242. (in Chinese)

[30]
Zhao X F, Huang X J, Chen Y et al., 2010. Research progress in urban land intensive use. Journal of Natural Resources, 25(11):1979-1996. (in Chinese)

[31]
Zhou G H, He Y H , 2006. Characteristics and influencing factors of urban land expansion in Changsha. A cta Geographica Sinica, 61(11):1171-1180. (in Chinese)

[32]
Zhou L H, Hong Z L, Yu Y L , 2012. Land intensive use assessment in the block economy: A case study in Lianhu district in Xi’an city. China Land Sciences, 26(7):78-83. (in Chinese)

[33]
Zhou W, Cao Y G, Qiao L Y , 2012. Urban land intensive use assessment based on the entire-array-polygon indictor method. China Land Sciences, 26(4):84-90. (in Chinese)

[34]
Zhu Y Z, Cao Y , 2011. Assessment of urban land intensive use based on PSR model: A case study of Guangdong Province. Economic Geography, 31(8):1375-1380. (in Chinese)

Outlines

/