Research Articles

Urban shrinkage and growth: Measurement and determinants of economic resilience in the Pearl River Delta

  • DU Zhiwei 1, 2 ,
  • ZHANG Hongou 1, 2 ,
  • YE Yuyao 1, 2 ,
  • JIN Lixia 1, 2 ,
  • XU Qian 1, 2
Expand
  • 1. Guangzhou Institute of Geography, Guangzhou 510070, China
  • 2. Guangdong Open Laboratory of Geospatial Information Technology and Application, Guangzhou 510070, China

Du Zhiwei (1987-), PhD, specialized in regional development and city planning, urban growth and shrinkage. E-mail: chiwai_do@foxmail.com

Received date: 2018-10-07

  Accepted date: 2019-01-02

  Online published: 2019-12-13

Supported by

National Natural Science Foundation of China(No.41801122)

GDAS’ Special Project of Science and Technology Development(No.2016GDASRC-0101)

GDAS’ Special Project of Science and Technology Development(No.2018GDASCX-0901)

Copyright

Copyright reserved © 2019. Office of Journal of Geographical Sciences All articles published represent the opinions of the authors, and do not reflect the official policy of the Chinese Medical Association or the Editorial Board, unless this is clearly specified.

Abstract

In the aftermath of the global financial crisis of 2008, China witnessed gradual shrinkage of cities in the Pearl River Delta (PRD). In this study, we introduce the concept of economic resilience to analyse urban growth and shrinkage in the context of a rapidly-urbanising region. Multiple regression analysis is performed to explore the determinants of economic resilience in the PRD. By measuring resistance in the shrinking phase and recoverability in the growing phase in a group of cities in the PRD, this study distinguishes four scenarios and investigates their characteristics from a spatial perspective. The results demonstrate that the financial crisis had a severe and asymmetric influence on this area, indicating more than 15% of cities are faced with shrinking. The spatial distribution of economic resilience indicates a centre-periphery pattern, that is, high economic resilience in the inner ring and low economic resilience in the outer ring of the PRD. The service economy is found to play a significant role in promoting urban economic resilience. Results imply that sound economic policies for enhancing resilience: both poor local financial status and a high degree of export concentration adversely impact resistance, while upgrading the manufacturing economy and stimulating of industrial innovation are conducive to improve recoverability.

Cite this article

DU Zhiwei , ZHANG Hongou , YE Yuyao , JIN Lixia , XU Qian . Urban shrinkage and growth: Measurement and determinants of economic resilience in the Pearl River Delta[J]. Journal of Geographical Sciences, 2019 , 29(8) : 1331 -1345 . DOI: 10.1007/s11442-019-1662-6

1 Introduction

Urban growth and shrinkage have attracted increasing attention in the literature due to the synchronised and increasingly frequent cyclical fluctuations in the global economy (Martinez-Fernandez et al., 2012; Hartt, 2017). The phenomenon of shrinking cities, marked by a sharp decrease in urban population, has recently spread to China and has characterised its urbanisation (Long and Wu, 2016; Yang and Dunford, 2018). After the financial crisis of 2008, some cities in the Pearl River Delta (PRD), a representative example of rapid urbanisation in China, experienced typical urban shrinkage phenomena, such as economic recession, population decline, and vacant dwellings (Du and Li, 2017). However, with the rebound and recovery of macroeconomic conditions, the economic performance of cities in the PRD began showing significant asymmetries: some shrinking cities successfully resisted the shock induced by the financial crisis and maintained sustainable economic growth, while others were caught in a development dilemma, facing economic and population shrinkage in the long-term.
There is no agreement in the literature regarding how to address the phenomenon of shrinking cities, but existing research provided theoretical and empirical ground for the identification, patterns, and dynamics of urban shrinkage. A decrease in urban population has been recognised as the primary indicator of urban shrinkage, and different types of shrinking cities are identified by their degree and duration (Häußermann and Siebel, 1988; Oswalt, 2006; Martinez-Fernandez et al., 2012; Wiechmann and Pallagst, 2012; Haase et al., 2014; Bartholomae et al., 2017). Studies conducted in America and Europe regard industrialisation, ageing, suburbanisation, resource depletion, economic crises, and social system transformations as typical dynamics of urban shrinkage (Hollander et al., 2009; Rieniets, 2009; Wiechmann and Pallagst, 2012; Haase et al., 2014; Martinez-Fernandez et al., 2016; Bartholomae et al., 2017), thus providing meaningful insights for interpreting the phenomenon of China’s shrinking cities. However, previous studies have paid little attention to the differences and dynamic transformation of shrinking cities in the same region. From a theoretical perspective, the transformation and recovery of a city after a short-term shrinking phenomenon caused by the financial crisis are now well understood. Therefore, it is urgent to find new theoretical tools to explain the transformation and sustainable development of shrinking cities.
The notion of economic resilience may help explain the regional economic response, adjustment, and changes after an external shock, and it has become the frontier topic of current economic geography research after the exceptional severity of the economic crisis in 2008 (Hudson, 2009; Martin, 2011; Martin and Sunley, 2015; Giannakis and Bruggeman, 2017). Economic resilience explains why some regions can eliminate the difficulties brought about by the crisis and even realise transformation and upgrade the economy, while some regions gradually move toward recession (Simmie and Martin, 2010). Previous research has shown that regions and cities with strong economic resilience managed to overcome the adverse impact induced by the crisis and even achieved long-term development, such as Massachusetts in the United States (Harrison, 1984), the Ruhr region in Germany (Grabher, 1993), and Cambridge in England (Hudson, 2005). Other areas, characterised by weak economic resilience, have suffered from economic shocks and long-term marginalisation, such as the northeast of England (Hudson, 2005), Buffalo and Cleveland in the United State (Cowell, 2013), and Małopolskie in Poland (Dawley et al., 2008). Therefore, the concept of economic resilience can be conducive to a better understanding of the dynamic changes in urban shrinkage due to economic shocks and provide theoretical support for the existence of significant economic differences in the rapidly-urbanising areas.
This study aims to measure economic resilience in a rapidly urbanising area in combination with its growth and shrinkage phases, and investigate the potential determinants of economic resilience. To this end, we utilize a feasible methodology that categorises different scenarios according to shock resistance and recoverability.
The remainder of the paper proceeds as follows. Section 2 discusses the various definitions and dynamics of shrinking cities, and provides an interpretation for understanding economic resilience integrated with growth and shrinkage. After the third section describes in details the research methodology which is used to measure economic resilience and probe its determinants, the following section analyses spatio-temporal characteristics and comparative influencing factors of its resistance and recoverability in the rapid-urbanising PRD. Section 5 provides our concluding remarks and discusses the directions for future research.

2 Literature review

2.1 Shrinking cities - theoretical context

Although the definition of shrinking cities varies among researchers in the literature, population loss is the most common evaluation index for identifying urban shrinkage, along with industrial hollowing-out, rising housing vacancy rate, and declining birth rate (Häußermann and Siebel, 1988; Oswalt, 2006; Turok and Mykhnenko, 2007; Martinez-Fernandez et al., 2012; Haase et al., 2014; Martinez-Fernandez et al., 2016). Demographic change is often considered the essential indicator of urban ‘growth’ or ‘shrinkage’, but different authors employ different thresholds and categories. The Shrinking Cities International Research Network (SCIRN) defines a shrinking city as a densely populated area that has experienced population decline for more than two years, accompanied by a series of economic downturn, employment outflow and social problems (Martinez-Fernandez et al., 2012). According to Oswalt (2006), he regarded the shrinking threshold as 10% of the total population, or more than 1% of the population lost each year. Schilling and Logan (2008) pointed out that shrinking cities underwent 25% or a higher population loss over the last 40 years with some symptoms of vacant and abandoned properties.
Several measures have been used to address the types and trajectories of shrinking cities, mainly based on the degree and duration of the decrease in population. Beauregard (2009) divided American cities into three categories (growing, stable, and shrinking cities) by population change, while Wiechmann and Wolff (2013) followed the SCIRN’s definition and classified four dynamic typologies of shrinking cities in Europe, namely, continuous, episodic, temporary, and no-shrinkage cities. Moreover, Kabisch et al. (2012) identified the following five clusters according to demographic changes in European cities during the period 1991-2008: extreme growth, moderate growth, resurgence, moderate decline, and continuous decline. Turok and Mykhnenko (2007) discovered nine trajectories of urban growth and contraction by observing changes in the demographic data in European cities in the period 1960-2005, which include persistent decline, long-term decline, mid-term recessions, short-term recessions, fluctuating growth, short-term recovery, medium-term growth, long-term growth, and sustained growth. In the Australian context, Martinez-Fernandez et al. (2016) proposed four scenarios for shrinking cities, including shrinkage, stabilised shrinkage, relapse-remission, and growth. In line with these literatures, research on shrinking cities in developed countries can offer some empirical evidences for shrinking cities in rapidly-urbanising areas.
The diversity of urban shrinkage experiences in North American, European, Australian, and East Asian cities has been mirrored as a combination of multidimensional and multifactorial dynamics observed in national and regional contexts. The existing literature has highlighted several possible mechanisms of urban shrinkage, including: (i) deindustrialisation, characterized by massive migration outflows from the old industrial base and resource-based cities, which now suffer from the exhaustion of natural resources, outdated ways of production, and disintegration of the economic structure (Martinez-Fernandez et al., 2012; Wiechmann and Pallagst, 2012; Bartholomae et al., 2017); (ii) suburbanisation, which generally manifests residents shift from central urban areas into peripheral suburbs, leading to a significant loss of inner-city populations (Oswalt, 2006; Hollander et al., 2009; Wiechmann and Pallagst, 2012; Martinez-Fernandez et al., 2016); (iii) demographic change, when falling birth rates and ageing population cause a long-term decrease in population (Martinez-Fernandez et al., 2016; Hattori et al., 2017); and (iv) institutional changes, such as the dramatic political and economic transformations in Eastern European countries, which caused a sudden population loss due to political, economic, and demographic instability (Oswalt, 2006; Turok and Mykhnenko, 2007; Rieniets, 2009). Additionally, negative population growth in cities can be caused by external forces, including the demographic impacts of war, genocides, epidemics, and natural or environmental catastrophes (Rieniets, 2009). In particular, the urban shrinkage phenomenon has been gradually spreading to many previously prosperous cities as a result of the current global financial crisis (Martinez-Fernandez et al., 2012; Hartt, 2017).
In recent years, numerous emerging studies have focused on shrinking cities in conjunction with the globalisation process, especially after the global shock induced by the financial crisis. While some cities kept growing and tolerated the impact of the crisis, and others managed to overcome all sorts of additional shocks, but many have been severely weakened or disrupted in the post-crisis period. However, the existing literature has not reached a consensus yet on how shrinking cities resist shocks and how they recover from recessions; the determinants of these phenomena remain unclear.

2.2 Understanding economic resilience with urban growth and shrinkage

Although there is no consensus in the literature on the definition of resilience, this concept has received significant interest in recent years across various disciplines (Hill et al., 2008; Hudson, 2009; Martin, 2011; Boschma, 2015; Martin and Sunley, 2015; Giannakis and Bruggeman, 2017; Hu and Hassink, 2017). The term resilience comes from the Latin word ‘resilire’, which corresponds to a system’s or an entity’s ablity to recover or leap back from a shock or disruption (Martin, 2011; Martin and Sunley, 2015; Modica and Reggiani, 2015). Three main approaches exist in the literature for addressing the concept of resilience, namely, the engineering, ecological, and evolutionary approaches. The approach of engineering resilience focuses on the ability of resistance to shocks or disturbances and the ability to rebound to its pre-shock equilibrium. In this case, resilience can be measured by the magnitude and speed of the system in moving back to the stability (Holling, 1973; Pimm, 1984; Walker et al., 2006). In the ecological perspective, the word ‘resilience’ assumes a different implication: it highlights the ‘ability to absorb’, which refers to the capacity of a system to tolerate or absorb disturbances and move to a new equilibrium beyond its elasticity threshold (Holling, 1996; Gunderson and Holling, 2002; Walker et al., 2006). Unlike the physical or ecological systems, however, it is impossible to be in equilibrium or prespecify multiple equilibria in the economic system (Metcalfe and Foster, 2006; Martin, 2010). Martin (2011) coined the term ‘evolutionary resilience’, which is based on the complex adaptive systems (CAS) and evolutionary theories; it refers to the capability of a system to minimise disruptions by transforming its structure, and to achieve self-renewal and adjustment as well. The evolutionary approach defines resilience in terms of the ability of a system to ‘bounce-forward’ rather than ‘bounce back’, that is, to retain and transform its structure and functions in response to shocks (Pendall et al., 2010; Pike et al., 2010).
The global financial crisis in 2008 generated a surge in interest and research on the subject of regional economic resilience; it is defined as the ability to resist and recover from shocks and disruption (Briguglio et al., 2009; Martin, 2010; Bristow and Healy, 2014; Boschma, 2015; Sensier and Bristow, 2016; Giannakis and Bruggeman, 2017). A fundamental research conundrums of economic resilience is how it should be reasonably understood. Martin (2011) presented a four interrelated stages for describing a regional economy’s reaction to recession: a) resistance (the vulnerability or sensitivity of regions to disturbances); b) recovery (the extent and speed of bouncing back to the pre-shock state); c) reorientation (the degree of structural and functional change); and d) renewal (the resumption of its pre-shock path). In an effort to measure a resilient region, Christopherson et al. (2010) and Dawley et al. (2010) suggested that it should be analysed in the following four terms: adjustment, adaptation, convergence, and equilibrium. In Martin and Sunleys’ (2015) recent contribution, they highlighted that economic resilience is essential to the analysis of how regional or urban economy undergoes successful structural and functional changes and recovers rapidly from external shocks, and understanding of how such shocks transform the spatial dynamics of regional or urban economic growth.
Moreover, there is no generally accepted methodology for operationalising and empirically measuring economic resilience. Previous research illustrates many possibilities for evaluating the patterns and typologies of economic resilience to a financial shock (Briguglio et al., 2009; Martin, 2011; Sensier and Bristow, 2016; Webber et al., 2018). In general, a resilient economy is one whose economic performance may successfully experience a rebound, or better surpass its pre-shock growth path within a short period, while a non-resilient region would be one that experiences negative economic growth and fails to rebound and transform its previous pathway (Drobniak, 2012; Sensier and Bristow, 2016). Some scholars have pointed out that urban/regional economic trajectories have been subject to regional/national pathways, that is, they define and measure resilience as the capacity of an urban/regional economy to sustain its economic structure and function during a recession and recover to its pre-crisis levels within a specific period, thus capturing the immediate resistance and recoverability of regions to shocks (Martin et al., 2015; Webber et al., 2018). In line with this method, economic resilience can be measured by calculating what proportion of economic indicators (such as employment or output) is lost during the financial turmoil, and how long it takes to recover from shocks (Martin et al., 2015; Sensier and Bristow, 2016).
A growing body of literature seeks to interpret why some cities and regions are more or less resilient than others in the face of shocks. The explanatory factors addressed in the recent literature relate to a specific set of explaining determinants as follows: economic or industrial structures, fiscal arrangements, local institutional capacity, technological innovation and labour market condition (Briguglio et al., 2009; Christopherson et al., 2010; Drobniak, 2012; Martin, 2015; Martin et al., 2016; Giannakis and Bruggeman, 2017). The evolutionary perspective suggests that economic structures have exerted remarkable influence on regional resilience and its evolutionary trajectory (Boschma, 2015). Evidence acknowledges the possibility that regional economic diversity can contribute to enhancing economic resilience, whereas sectoral specialization, economic openness and export concentration are likely to be more vulnerable to external economic shocks (Christopherson et al., 2010; Davies and Tonts, 2010; Boschma, 2015; Giannakis and Bruggeman, 2017). Simmie and Martin (2010) argued that a diversified economic base is more conducive to innovation than a specialised one, and an economy with highly creative individuals, human capital, and innovation is likely to be more resilient (Bristow and Healy, 2014; Martin and Sunley, 2015; Wolfe and Gertler, 2016). Glaeser (2005) highlighted that skilled and educated labour as well as a young workforce are the main drivers for improving regional resilience and recovery. Furthermore, many articles have been keen to emphasize the significant role of governance and local institutions, such as economic policies, local fiscal support, and governance networks, in shaping resilience to economic shocks (Briguglio et al., 2009; Hassink, 2010; Boschma, 2015; Martin et al., 2016).
In sum, when we consider the unique role of economic resilience in interpreting an economic system’s response, adjustment, and changes in the face of external shocks, it is possible to consider and discuss shrinking cities and economic resilience in a coupled approach. By addressing economic resilience, a better understanding of the urban shrinkage phenomenon may be achieved. Particularly, economic resilience may help understand why some cities manage to overcome disturbance from exogenous shocks and achieve sustainable development while others fail, thus providing a suitable research perspective and theoretical tools for addressing the heterogeneous pathways of shrinking cities after the global financial crisis.

3 Materials and methods

3.1 Study area

The PRD is situated within the Guangdong province in the southeast corner of China and has been the country’s most dynamic economic region since the onset of the opening-up reform in 1978. In just over four decades, the PRD has been transformed from an agricultural backwater to one of the world’s leading manufacturing areas, and its urbanisation rate rose from 16% to 84% between 1990 and 2016. With a total area of 54,763 km2 and a permanent population of 58.74 million in 2016, the PRD comprises nine prefecture-level cities (Guangzhou, Shenzhen, Foshan, Dongguan, Zhongshan, Huizhou, Zhuhai, Jiangmen, and Zhaoqing), and it consists of 34 densely populated district-levels, six subordinate county-level cities, and seven counties (Figure 1). Since there is no county-level or district-level division in Dongguan and Zhongshan, prefecture-level units are used in this study, and a total of 49 units are investigated.
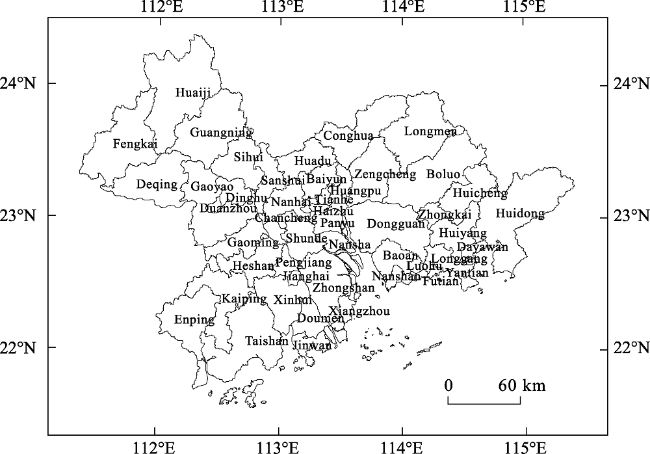
Figure 1 Location and administrative division of the Pearl River Delta

3.2 Measuring economic resilience within two dimensions

In this study, we adopt the methodology proposed by Oswalt (2006) for identifying urban growth and shrinkage by, defining cities that have temporarily or permanently witnessed a negative change in the number of inhabitants. First, we assess the annual permanent population change rate: urban growth means that the rate of annual population change is positive, while urban shrinkage means that the rate of annual population change is negative.
Second, we agree with Martin’s (2011) definition of economic resilience ascertains whether an economy resisted and renewed in response to the economic shock or is yet to recover from the disruption. Drawing upon Sensier et al. (2016) and Martin et al. (2016), we measure two dimensions of economic resilience, namely, resistance and recoverability, in a shrinking phase and growing phase, respectively. As cities’ economic dynamics are significantly affected by region-level impacts, we compare the shrinking or growing phase in the case of expected decline and growth in the economy of the sampled cities. In other words, we expect that each city’s GDP would resist (in a shrinking phase) and recover (in a growing phase) at the same rate as the regional GDP. Thus, the expected changes in the GDP of city r during a growing or shrinking phase in k periods $(\Delta E_{r}^{t+k})$. can be expressed as:
${{(\Delta E_{r}^{t+k})}^{\text{expected}}}={{\Sigma }_{i}}g_{N}^{t+k}E_{r}^{t}$
where $g_{N}^{t+k}$ is the rate of resistance (in the shrinking phase) or recoverability (in the growing phase) of regional GDP, and $E_{r}^{t}$ is GDP in city r at time t, the base year, which is the turning point between the shrinking and growing phases. Subsequently, the measure of resistance and recoverability can be expressed as:
$Resistanc{{e}_{r}}=\frac{(\Delta E_{r}^{\text{Shrinking}})-{{(\Delta E_{r}^{\text{Shrinking}})}^{\text{expected}}}}{|{{(\Delta E_{r}^{\text{Shrinking}})}^{\text{expected}}}|}$
$Recoverabilit{{y}_{r}}=\frac{(\Delta E_{r}^{\text{Growing}})-{{(\Delta E_{r}^{\text{Growing}})}^{\text{expected}}}}{|{{(\Delta E_{r}^{\operatorname{Growing}})}^{\text{expected}}}|}$
By definition, the two measures in Equations (2) and (3) are centred around zero. Thus, a positive value of Resistancer indicates that the city is more resistant in the regional economy; and a negative value indicates a less-resistant city in this region. In similar way, a positive value of Recoverabilityr indicates that the city has a higher capacity of recoverability when compared to the regional economy, and a lower recoverability of the coefficient on this variable is negative.
Following Martin et al. (2016), four possible scenarios may arise according to a city’s resistance and recoverability, as shown in Figure 2. These scenarios are termed high economic resilience (HER), medium economic resilience with high resistance (MER1), medium economic resilience with high recoverability (MER2), and low economic resilience (LER). The HER scenario refers to cities characterised by strong resistance and recoverability, which react positively to economic shocks. Cities classified as MER1 have a high degree of resistance but weak recoverability, which enable them to overcome the adverse impacts of economic shocks. Cities falling under the MER2 scenario are characterised by weak resistance but strong recoverability, thereby rendering them susceptible to external shock. Lastly, the LER scenario applies to cities that do have an inherently low resistance and weak recoverability.
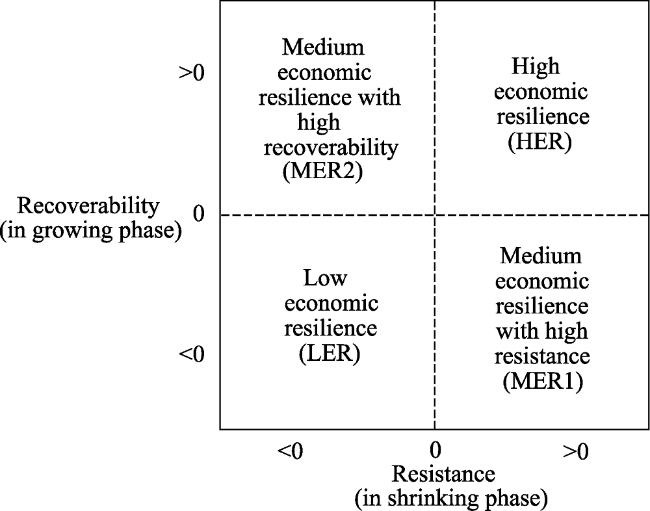
Figure 2 Scenarios categorised by resistance and recoverability

3.3 Exploring the determinants of economic resilience

To investigate the determinants that trigger economic resilience in the PRD, a multiple regression model is applied to explore the effects of potential determinants (local financial status, economic innovation level, foreign investment dependence, human capital quantity, and industrial economic structure) on the probability of economic resilience (resistance and recoverability, both introduced in the model as dependent variables). The local financial status (FINAN) is expressed as the ratio of general budgetary revenue to the general budgetary expenditure of the local government, which reflects the impact of governance and institutions on economic resilience (Briguglio et al., 2009). Economic innovation (INNOV) and human capital (CAPIT) indicate the city’s capacity to obtain invention patent authorisations (per capita) and the proportion of highly-educated workforce, respectively, which can be jointly considered as proxies for capturing the innovative and educational effects in economic resilience (Di Caro, 2015; Giannakis and Bruggeman, 2017). A higher level of foreign investment dependence (FDI) is employed to directly mirror the possibility of being hit by a financial crisis (Briguglio et al., 2009; Xu and Wang, 2017). Moreover, economic resilience is considered to depend on the industrial economic structure (Palaskas et al., 2015; Giannakis and Bruggeman, 2017). Therefore, variables that measure the share of the manufacturing sector (MANUF) and service sector (SERV) in the GDP are also introduced in the regression model.
The present analysis employs data on the Gross Domestic Product (GDP), permanent population, GDP in the manufacturing sector, GDP in the service sector, Foreign Direct Investment (FDI), number of R&D personnel, number of invention patents granted, local government’s general budgetary revenue, and local government’s general budgetary expenditure obtained from the Guangdong Statistical Yearbook, which contains annual observations for 49 units between 2000 and 2016. The share of the labour force with upper tertiary education is derived from the National Population Census in 2010 and the 1% Population Sample Survey in 2015. All definitions and descriptive statistics of the variables are shown in Table 1.
Table 1 Description of independent variables in the Pearl River Delta from 2008-2016
Variables Definition Min Max Average
FINAN Local government’s general budgetary revenue / Local government’s general budgetary expenditure (%) 0.3995 1.5059 0.7725
INNOV Number of invention patents granted / Number of R&D personnel (%) 0 0.0062 0.0002
FDI Share of FDI in the GDP (%) 0.0101 0.1218 0.0431
CAPIT Share of workforce with upper tertiary education (%) 0.0038 0.2505 0.0531
MANUF Share of the manufacturing sector in the GDP (%) 0.0135 0.8752 0.4732
SERVE Share of the service sector in the GDP (%) 0.1190 0.9699 0.4382
The resistance scores (RESIST) of the 49 units in the shrinking phase, as well as the recoverability scores (RECOVER) in the growing phase, are assessed by constructing multiple regression models, where i represents the unit of analysis, and μi is a random disturbance term. All calculations are performed using the STATA 13 econometric software. The regression models read as follows:
$\begin{matrix} & LnRESIS{{T}_{i}}={{\beta }_{0}}+{{\beta }_{1}}LnFINA{{N}_{i}}+{{\beta }_{2}}LnINNO{{V}_{i}}+{{\beta }_{3}}LnCAPI{{T}_{i}}+{{\beta }_{4}}LnFD{{I}_{i}}+ \\ & \ \ \ \ \ \ \ \ \ \ \ \ \ \ \ \ \ \ \ {{\beta }_{5}}LnMANU{{F}_{i}}+{{\beta }_{6}}LnSER{{V}_{i}}+{{\mu }_{i}} \\ \end{matrix}$
$\begin{matrix} & LnRECOVE{{R}_{i}}={{\beta }_{0}}+{{\beta }_{1}}LnFINA{{N}_{i}}+{{\beta }_{2}}LnINNO{{V}_{i}}+{{\beta }_{3}}LnCAPI{{T}_{i}}+{{\beta }_{4}}LnFD{{I}_{i}}+ \\ & \ \ \ \ \ \ \ \ \ \ \ \ \ \ \ \ \ \ \ {{\beta }_{5}}LnMANU{{F}_{i}}+{{\beta }_{6}}LnSER{{V}_{i}}+{{\mu }_{i}} \\ \end{matrix}$

4 Results

4.1 Spatio-temporal characteristics of economic resilience in the PRD

To distinguish between the growing and shrinking phases, a simple linear chronological trajectory of the numbers of growing cities and shrinking cities was first considered. As shown in Figure 3, general growth accompanied by partial shrinkage is characteristic of cities in the PRD between 2000 and 2016. More precisely, most cities (46 of 49 units) achieved continuous growth during this period, and the proportion of shrinking cities accounted for only 6.12% (3 of 49 units). However, urban growth and shrinkage in the PRD appeared to significantly fluctuate, especially after the financial crisis. A period of stability is observed between 2000 and 2007, with one or two shrinking cities per year. The number of shrinking cities sharply increased and peaked in 2010, with Yantian, Doumen, Longmen, Taishan, Guangning, Deqing, Fengkai, and Huaiji representing typical cases of urban shrinkage. Along with the gradual recovery of the macroeconomy, however, the number of growing cities in the PRD significantly rebounded, and its trajectory became V-shaped. Most districts and counties in the PRD achieved recovery after 2010, returning to the upward growth path observed before the crisis.
Figure 3 Trajectory of the number of growing and shrinking cities in the Pearl River Delta (2000-2016)
Therefore, with the turning points in 2007 and 2010, the period between 2000 and 2016 can be split into three phases: stable fluctuation (2000-2007), significant shrinkage (2008- 2010), and recovery growth (2011-2016). To further explore the economic resilience of the cities in the PRD, this study regards 2008-2010 as a shrinking phase for measuring resistance and 2011-2016 as a growing phase for measuring recoverability.
Figure 4 shows that the overall level of economic resilience in the PRD is not high, since the order of the cities number in the scenarios category is: MER2 scenario (17) > LER scenario (12) > HER scenario (11) > MER1 scenario (9). The proportion of cities with low economic resilience (LER) is nearly one quarter (24.48%), mainly concentrated in three prefecture-level cities of Jiangmen (such as Taishan, Xinhui, Kaiping, and Enping), Zhaoqing (such as Gaoyao and Huaiji), and Dongguan. Conversely, the number of cities in the MER2 scenario is 17, which accounts for 34.69% of the whole sample and reflects the fact that most cities have high sensitivity to external economic shocks. In these cities, external shocks may decelerate economic growth and even trigger a recession. Only nine cities belong to the MER1 scenario; these are mainly concentrated in the central part of the PRD, such as Huadu, Zengcheng, Baiyun, and Huangpu in Guangzhou, and Nanhai and Shunde in Foshan. The proportion of cities that belong to the high economic resilience (HER) scenario is only 22.45% (11 cities), and their spatial distribution is geographically dispersed.
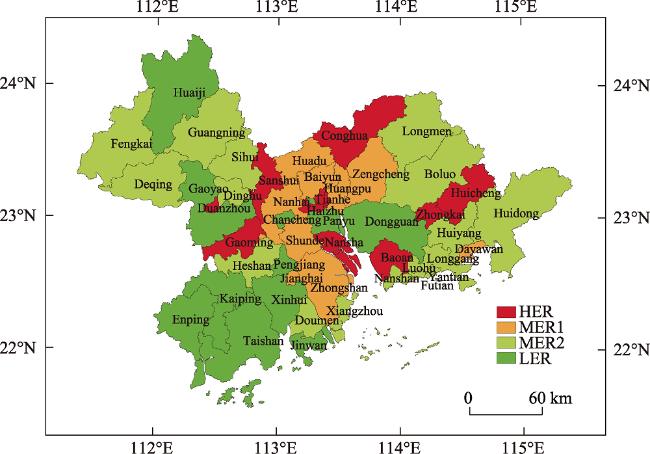
Figure 4 Economic resilience of county- and district-level cities in the Pearl River Delta (2008-2016)

4.2 Main determinants of economic resilience in the PRD

The variance inflation factor (VIF) is used to detect and quantify the severity of multicollinearity in the regression analysis. According to Montgomery, Peck, and Vining (2012), a VIF between 1 and 5 indicates that the lack of multicollinearity among the variables in the model would be as per expectations. The results of stepwise regression analysis (Table 2) show that the determination coefficients (R2) for resistance and recoverability in the model are 0.428 and 0.419, respectively, which indicates that the model fit is reliable.
Table 2 Results of stepwise regression
Variables Resistance Recoverability
FINAN 0.224***
(4.42)
Non-significant
INNOV Non-significant 0.054**
(6.82)
FDI -0.751**
(-2.31)
Non-significant
CAPIT Non-significant Non-significant
MANUF Non-significant -0.364***
(-1.75)
SERV 0.149***
(2.09)
2.271***
(1.48)
_cons -0.077
(-1.30)
0.324
(1.48)
N 49 49
Adj.R2 0.428 0.419
F 7.00 4.10
VIF 1.21 1.67

Note: t statistics in parentheses; * p < 0.05, ** p < 0.01, *** p < 0.001

In the shrinking phase, the local financial situation has a significant and positive correlation (0.224) with resistance, which indicates that cities with less public debt and more revenues have higher resistance and cope better with the impact of an economic crisis. Two prefecture-level areas (Guangzhou and Foshan) have better fiscal revenue and expenditure ratios, while districts and counties located on the outer edge of the PRD face a general public finance deficit problem (such as Huaiji Longmen, Guangning, and Fengkai). Moreover, the correlation coefficient between FDI and resistance is significant and negative (-0.751), which reflects the fact that economic development is highly dependent on foreign investment. Some cities (e.g. Dongguan, Jinwan, and Huiyang) show relatively weak resistance to external shocks and are more likely to suffer from urban shrinkage.
In the growing phase, economic innovation plays a significant role in promoting rapid economic recovery. The variance-covariance between innovation and recoverability is positive (0.054), which suggests that the greater the number of authorised invention patents, the higher the recoverability of these areas (e.g. Longgang and Zhongkai). In addition, the degree of correlation between manufacturing and recoverability is significant and negative, which reflects the fact that the driving forces of manufacturing in the PRD have weakened or even turned negative in the post-crisis period. Due to shutdown and relocation of traditional labour-intensive manufacturing in the PRD after the financial crisis, the so-called ‘world factory’ (e.g. Dongguan and Nanhai) has not been able to continue playing a significant role, thus confirming low recoverability in the traditional manufacturing sector.
More importantly, the service economy made a significant positive contribution to economic resilience in both the resistance and recoverability dimensions after the crisis. Many district-level cities in prefecture cities show relatively high scores in resistance and recoverability, such as Yuexiu and Tianhe in Guangzhou, Futian in Shenzhen, Huicheng in Huizhou, Duanzhou in Zhaoqing, and Xiangzhou in Zhuhai. The results suggest that promoting the shift of the economic structure towards a service economy, and integrating the traditional manufacturing sector especially with modern productive services, helps enhance economic resilience and avoid urban shrinking.

5 Conclusions and discussion

5.1 Conclusions

As a typical example of rapid urbanisation, the PRD experienced significant differences in the development performance of cities after the shock induced by the financial crisis. This study introduces the concept of economic resilience for analysing shrinking cities in the rapidly-urbanising PRD. We measure the economic resilience of 49 district- and county- level units in both the resistance and recoverability dimensions, in growing and shrinking phases.
General growth accompanied by partial shrinkage has been the essential characteristic of urban development in the PRD since 2000. The global economic recession in 2008 had a severe and asymmetric influence on this area, exposing the ability of certain cities to resist disruptive shocks, but also shedding light on the capacity of local economies to revert to the pre-shock performance level. The number of shrinking cities sharply increased from two in 2007 to eight in 2010 in the PRD, and the proportion of shrinking cities was close to 16.32%. Based on the turning points in 2007 and 2010, the trajectory of urban growth and shrinkage can be split into three phases: stable fluctuation, significant shrinkage, and recovery growth. In its spatial distribution, the PRD’s economic resilience presents a visible ‘core-periphery’ pattern as follows: Guangzhou, Foshan, Shenzhen, Zhongshan, and Zhuhai constitute a high economic resilience ‘core’, while Huizhou, Jiangmen, and Zhaoqing represent the low economic resilience ‘periphery’. With four scenarios categorised by resistance and recoverability, nearly one quarter of the sample city units falls within the low economic resilience scenario, while only 22.45% of cities are characterised by high economic resilience.
Multiple regression analysis demonstrated that the service economy is crucial to economic resilience in the PRD, and the PRD improved its economic resilience by shifting the manufacturing economy towards the service sector after the crisis. Cities with a sound local financial situation and low foreign investment dependence tend to have better resistance to external shocks and avoid the urban shrinkage caused by the crisis. Therefore, industrial cities and manufacturing towns need to adopt new technologies to strengthen their recoverability.

5.2 Discussion

Unlike the highly urbanized cities in developed countries like Europe and the United States, the urbanization process in the PRD is just entering maturity. This study is an exploratory analysis of the measurement and determinants of economic resilience integrated with growth and shrinkage in a rapidly-urbanising area, demonstrating that it is a feasible approach to investigate urban transformation in a dynamic perspective. In this case, some manufacturing cities in the PRD enhance their resilience successfully by pushing industrial upgrading and structural transformation, and a healthy monetary situation allows them to resist and adjust their policies in the face of external financial shocks. Without a doubt, institutional arrangements and governance policies exerted strong influence on economic resilience, and it is thus necessary to encourage co-operation between industry and academia as well as increase industry-related education by local government. Essentially, this study contributes to the understanding of economic resilience in the context of urban growth and shrinkage. Future studies should use open data and big data to identify other determinants of economic resilience. In addition, the impacts of industrial economic diversification and institutional arrangements on urban economic resilience in the Chinese context are significant elements that need further exploration.
[1]
Bartholomae F, Nam C W, Schoenberg A , 2017. Urban shrinkage and resurgence in Germany. Urban Studies, 54(12):2701-2718.

[2]
Beauregard R A , 2009. Urban population loss in historical perspective: United States, 1820-2000. Environment and Planning A, 41:514-528.

[3]
Boschma R , 2015. Towards an evolutionary perspective on regional resilience. Regional Studies, 49(5):733-751.

[4]
Briguglio L, Cordina G, Farrugia N et al., 2009. Economic vulnerability and resilience: Concepts and measurements. Oxford Development Studies, 37(3):229-247.

[5]
Bristow G, Healy A , 2014. Regional resilience: An agency perspective. Regional Studies, 48(5):923-935.

[6]
Christopherson S, Michie J, Tyler P , 2010. Regional resilience: Theoretical and empirical perspectives. Cambridge Journal of Regions, Economy and Society, 3(1):3-10.

[7]
Cowell M M , 2013. Bounce back or move on: Regional resilience and economic development planning. Cities, 30:212-222.

[8]
Davies A, Tonts M , 2010. Economic diversity and regional socioeconomic performance: An empirical analysis of the Western Australian grain belt. Geographical Research, 48(3):223-234.

[9]
Dawley S, Pike A, Tomaney J , 2010. Towards the resilient region? Local Economy, 25(8):650-667.

[10]
Dawley S, Stenning A, Pike A , 2008. Mapping corporations, connecting communities: Remaking steel geographies in northern England and southern Poland. European Urban and Regional Studies, 15(3):265-287.

[11]
Di Caro P , 2015. Testing and explaining economic resilience with an application to Italian regions. Papers in Regional Science, 96(1):93-113.

[12]
Drobniak A , 2012. The urban resilience-economic perspective. Journal of Economics and Management, 10:5-20.

[13]
Du Z W, Li X , 2017. Growth or shrinkage: New phenomena of regional development in the rapidly-urbanising Pearl River Delta. Acta Geographica Sinica, 72(10):1800-1811. (in Chinese)

[14]
Giannakis E, Bruggeman A , 2017. Determinants of regional resilience to economic crisis: A European perspective. European Planning Studies, 25(8):1394-1415.

[15]
Glaeser E L , 2005. Review of Richard Florida’s the rise of the creative class. Regional Science and Urban Economics, 35(5):593-596.

[16]
Grabher G , 1993. The Embedded Firm: On the Socio-economics of Industrial Networks. London and New York: Routledge.

[17]
Gunderson L, Holling B , 2002. Panarchy: Understanding Transformations in Human and Natural Systems. Washington: Island Press.

[18]
Haase A, Rink D, Grossmann K et al., 2014. Conceptualizing urban shrinkage. Environment and Planning A, 46(7):1519-1534.

[19]
Harrison B , 1984. Regional Restructuring and ‘Good Business Climates’: The Economic Transformation of New England since World War II. New York: Oxford University Press.

[20]
Hartt M , 2018. The diversity of North American shrinking cities. Urban Studies, 55(13):2946-2959.

[21]
Hassink R , 2010. Regional resilience: A promising concept to explain differences in regional economic adaptability? Cambridge Journal of Regions, Economy and Society, 3:45-58.

[22]
Hattori K, Kaido K, Matsuyuki M , 2017. The development of urban shrinkage discourse and policy response in Japan. Cities, 69:124-132.

[23]
Häußermann H, Siebel W , 1988. Die schrumpfende Stadt und die Stadtsoziologie. In: Friedrichs J, Soziologische Stadtforschung. Wiesbaden: VS Verlag für Sozialwissenschaften.

[24]
Hill E, Wial H, Wolman H , 2008. Exploring Regional Economic Resilience. Working Paper 2008-04. University of California: Institute of Urban and Regional Development.

[25]
Holling C S , 1973. Resilience and stability of ecological systems. Annual Review of Ecology and Systematics, 4(1):1-23.

[26]
Holling C S , 1996. Engineering versus ecological resilience. In: Schulze P et al., Engineering Within Ecological Constraints. Washington: National Academy Press.

[27]
Hu X, Hassink R , 2017. Exploring adaptation and adaptability in uneven economic resilience: A tale of two Chinese mining regions. Cambridge Journal of Regions, Economy and Society, 10(3):527-541.

[28]
Hudson R , 2005. Rethinking change in old industrial regions: Reflecting on the experiences of North East England. Environment and Planning A, 37(4):581-596.

[29]
Hudson R , 2009. Resilient regions in an uncertain world: Wishful thinking or a practical reality? Cambridge Journal of Regions, Economy and Society, 3(1):11-25.

[30]
Hollander J B, Pallagst K, Schwarz T et al., 2009. Planning shrinking cities. Progress in Planning, 72(4):223-232.

[31]
Kabisch N, Haase D, Haase A , 2012. Urban population development in Europe, 1991-2008: The examples of Poland and the UK. International Journal of Urban and Regional Research, 36:1326-1348.

[32]
Long Y, Wu K , 2016. Shrinking cities in a rapidly urbanizing China. Environment and Planning A, 48:220-222.

[33]
Martin R , 2010. Roepke lecture in economic geography-Rethinking regional path dependence: Beyond lock-in to evolution. Economic Geography, 86(1):1-27.

[34]
Martin R , 2011. Regional economic resilience, hysteresis and recessionary shocks. Journal of Economic Geography, 12(1):1-32.

[35]
Martin R, Sunley P , 2015. On the notion of regional economic resilience: Conceptualization and explanation. Journal of Economic Geography, 15(1):1-42.

[36]
Martin R, Sunley P, Gardiner B et al., 2016. How regions react to recessions: Resilience and the role of economic structure. Regional Studies, 50(4):561-585.

[37]
Martin R, Sunley P, Tyler P , 2015. Local growth evolutions: Recession, resilience and recovery. Cambridge Journal of Regions, Economy and Society, 8(2):141-148.

[38]
Martinez-Fernandez C, Audirac I, Fol S et al., 2012. Shrinking cities: Urban challenges of globalization. International Journal of Urban and Regional Research, 36(2):213-225.

[39]
Martinez-Fernandez C, Weyman T, Fol S et al., 2016. Shrinking cities in Australia, Japan, Europe and the USA: From a global process to local policy responses. Progress in Planning, 105:1-48.

[40]
Metcalfe J S, Foster J, Ramlogan R , 2006. Adaptive economic growth. Cambridge Journal of Economics, 30:7-32.

[41]
Modica M, Reggiani A , 2015. Spatial economic resilience: Overview and perspectives. Networks and Spatial Economics, 15(2):211-233.

[42]
Montgomery D C, Peck E A, Vining G G , 2012. Introduction to Linear Regression Analysis. Hoboken NJ: John Wiley & Sons.

[43]
Oswalt P , 2006. Shrinking Cities, International Research. Vol. 1. Ostfildern: Hatje Crantz Verlag.

[44]
Palaskas T, Psycharis Y, Rovolis A et al., 2015. The asymmetrical impact of the economic crisis on unemployment and welfare in Greek urban economies. Journal of Economic Geography, 15(5):973-1007.

[45]
Pendall R, Foster K A, Cowell M , 2010. Resilience and regions: Building understanding of the metaphor. Cambridge Journal of Regions, Economy and Society, 3(1):71-84.

[46]
Pike A, Dawley S, Tomaney J , 2010. Resilience, adaptation and adaptability. Cambridge Journal of Regions, Economy and Society, 3(1):59-70.

[47]
Pimm S L , 1984. The complexity and stability of ecosystems. Nature, 307(5949):321.

[48]
Rieniets T , 2009. Shrinking cities: Causes and effects of urban population losses in the twentieth century. Nature and Culture, 4(3):231-254.

[49]
Schilling J, Logan J , 2008. Greening the rust belt: A green infrastructure model for right sizing America's shrinking cities. Journal of the American Planning Association, 74(4):451-466.

[50]
Sensier M, Bristow G, Healy A , 2016. Measuring regional economic resilience across Europe: Operationalizing a complex concept. Spatial Economic Analysis, 11(2):128-151.

[51]
Simmie J, Martin R , 2010. The economic resilience of regions: Towards an evolutionary approach. Cambridge Journal of Regions, Economy and Society, 3(1):27-43.

[52]
Turok I, Mykhnenko V , 2007. The trajectories of European cities, 1960-2005. Cities, 24:165-182.

[53]
Walker B Gunderson L, Kinzig A et al., 2006. A handful of heuristics and some propositions for understanding resilience in social-ecological systems. Ecology and Society, 11(1):13.

[54]
Webber D J, Healy A, Bristow G , 2018. Regional growth paths and resilience: A European analysis. Economic Geography, 11(2):227-240.

[55]
Wiechmann T, Pallagst K M , 2012. Urban shrinkage in Germany and the USA: A comparison of transformation patterns and local strategies. International Journal of Urban and Regional Research, 36(2):261-280.

[56]
Wiechmann T, Wolff M , 2013. Urban shrinkage in a spatial perspective: Operationalization of shrinking cities in Europe, 1990-2010. AESOP- ACSP Joint Congress, Vol. 1519.

[57]
Wolfe D A, Gertler M , 2016. Growing Urban Economies: Innovation, Creating and Governance in Canadian City-regions. Toronto: University of Toronto Press.

[58]
Xu Y Y, Wang C , 2017. Influencing factors of regional economic resilience in the 2008 financial crisis: A case study of Zhejiang and Jiangsu Provinces. Progress in Geography, 36(8):986-994. (in Chinese)

[59]
Yang Z, Dunford M , 2018. City shrinkage in China: Scalar processes of urban and hukou population losses. Regional Studies, 52:1111-1121.

Outlines

/