Research Articles

Evaluation of the eco-efficiency of four major urban agglomerations in coastal eastern China

  • REN Yufei 1, 2 ,
  • FANG Chuangling , 1, 2 ,
  • LIN Xueqin 3 ,
  • SUN Siao 1 ,
  • LI Guangdong 1 ,
  • FAN Beili 1
Expand
  • 1. Institute of Geographic Sciences and Natural Resources Research, CAS, Beijing 100101, China
  • 2. University of Chinese Academy of Sciences, Beijing 100049, China
  • 3. College of Resource Environment and Tourism, Capital Normal University, Beijing 100048, China
*Fang Chuanglin (1966-), Professor, E-mail:

Ren Yufei (1990-), specialized in sustainable development of urban agglomerations. E-mail: renyuf@126.com

Received date: 2018-09-28

  Accepted date: 2018-11-25

  Online published: 2019-12-13

Supported by

Major Program of National Natural Science Foundation of China(No.41590840)

Major Program of National Natural Science Foundation of China(No.41590842)

National Natural Science Foundation of China(No.41371177)

Copyright

Copyright reserved © 2019. Office of Journal of Geographical Sciences All articles published represent the opinions of the authors, and do not reflect the official policy of the Chinese Medical Association or the Editorial Board, unless this is clearly specified.

Abstract

Urban agglomerations in China have become the strategic core of national economic development and the main component of the new type of urbanization. However, they are threatened by a series of eco-environmental problems and challenges, including the severe overexploitation of natural resources. Eco-efficiency, which is defined as accomplishing the greatest possible economic benefit with the least possible resource input and damage to the environment, is used as an indicator to quantify the sustainability of urban agglomerations. In this work, a traditional data envelopment analysis (DEA) model with a slack-based measurement (SBM) model of undesirable outputs, was used to assess and compare the economic efficiency and eco-efficiency of four major urban agglomerations in eastern China (UAECs) in 2005, 2011, and 2014. The spatio-temporal characteristics of the evolution of urban agglomerations were analyzed. Based on the results of a slack analysis, suggestions for improving the eco-efficiency of the four UAECs are provided. The overall economic efficiency of urban agglomerations located in the Shandong Peninsula, Yangtze River Delta, and Pearl River Delta displayed a V-shaped pattern (decreased and then increased). In contrast, the overall economic efficiency of the Beijing-Tianjin-Hebei urban agglomeration declined during the study period. The Beijing-Tianjin-Hebei urban agglomeration had a considerable loss of economic efficiency due to pollution, whereas the Shandong Peninsula urban agglomeration was less impacted. Overall, the eco-environmental efficiency of the four UAECs declined from 2005 to 2011 and then increased from 2011 to 2014. In addition, the urban eco-efficiency in the four coastal UAECs was characterized by different evolution patterns. The eco-efficiency was higher in the peri-urban areas of the core cities, riverside areas, and seaside areas and lower in the inland cities. The core cities of the Beijing-Tianjin-Hebei, Yangtze River Delta, and Pearl River Delta urban agglomerations were characterized by high resource consumption, economic benefit output, and eco-efficiency. In most of cities in the urban agglomerations, the emission of pollutants declined, leading to a reduction of pollutants and mitigation of environmental problems. In addition, a differential analysis, from the perspective of urban agglomeration, was performed, and concrete suggestions for improvement are proposed.

Cite this article

REN Yufei , FANG Chuangling , LIN Xueqin , SUN Siao , LI Guangdong , FAN Beili . Evaluation of the eco-efficiency of four major urban agglomerations in coastal eastern China[J]. Journal of Geographical Sciences, 2019 , 29(8) : 1315 -1330 . DOI: 10.1007/s11442-019-1661-7

1 Introduction

Urban agglomerations are a highly developed spatial form, resulting from China’s new type of urbanization and industrialization. Urban agglomerations play a key role in global economic competition and the international division of labor. Also, these regions are a core part of The Belt and Road initiative (Fang et al., 2017). As part of economic reform, the Chinese government officially implemented the “T” and “π” shaped development strategies in the 1990s, fostering three major economic zones along the coast and Yangtze River. As a result, the urban agglomerations located in these zones have become the urban agglomerations with the highest level of opening-up and socio-economic development in China (Fang et al., 2005, 2011, 2014). However, with booming development, the coastal urban agglomerations have faced increasingly serious environmental problems. Industrial development patterns that are energy-intensive, pollution-intensive, and a high ecological risk, have resulted in tremendous pressure on ecosystems. As a consequence of rapid economic development in recent years, some urban agglomerations in China have severe ecological problems.
Eco-efficiency plays an increasingly critical role in evaluating the efficiency of economic activity with respect to natural resources and ecological deterioration, and the term has begun to receive more attention from the scholarly community (Schaltegger, 2002; Huppers, 2005; Lu and Yang, 2006). The definition of eco-efficiency from the World Business Council for Sustainable Development (WBCSD, 1999) emphasizes human development: “The delivery of competitively priced goods and services that satisfy human needs and bring quality of life, while progressively reducing ecological impacts and resource intensity throughout the life-cycle to a level at least in line with the Earth's estimated carrying capacity.” With a focus on reducing the use of natural resources, the European Environment Agency (EEA, 1999) views eco-efficiency as creating more benefits with the least natural input. The United Nations Economic and Social Commission for Asia and the Pacific (UNESCAP, 2010) defines the term as an important basic element for improving basic social productivity and reducing changes in resource consumption. The United Nations Conference on Trade and Development (UNCTAD, 2003) emphasizes reducing environmental damage and defines eco-efficiency as increasing, or at least not reducing, shareholder value while reducing environmental damage. In general, the goal of eco-efficiency is to achieve sustainable economic development by efficient allocation of capital and natural resources, minimizing environmental impact and improving the quality of human life. With roots in the ecological economy, the notion of “eco-efficiency” has developed into a valuable instrument for sustainable development analysis. The term refers to the practical relationship between economic development and environmental costs, wherein high eco-efficiency means accomplishing the greatest possible economic benefit with the least possible resource input and damage to the environment.
A wealth of literature evaluating eco-efficiency based on Data Envelopment Analysis (DEA) models is available at a range of scales, spanning the micro level to the macro level. From a national perspective, Rashidi et al. (2015) concluded that countries with high unexpected output have difficulty controlling eco-efficiency and have little potential to achieve optimal energy savings. Considering cost and greenhouse gas efficient production, Wettemann and Latacz-Lohmann (2017) analyzed eco-efficiency for 216 dairy farms in northern Germany, using DEA. At a regional scale, Goto et al. (2016) evaluated eco-efficiency with a DEA model to confirm the Porter hypothesis in Japan’s manufacturing sector and concluded that greenhouse gas emissions, which can be reduced by increasing funding for technological innovation, are the major factor accounting for inefficiency. By utilizing the SBM-DEA model, Lee et al. (2014) used waste gases as undesirable-output indicators, to measure the eco-efficiency of the world's major port cities. They also introduced social and opportunity costs to analyze the impact of emissions generated by ocean-going vessels. Existing literature on eco-efficiency in China focuses mainly on the national and provincial levels. Huang et al. (2018) explored the spatial distribution of 273 cities with the index of urban clustering and evaluated urban eco-efficiency, using DEA, in China from 2003 to 2015. Bai et al. (2018) measured the urban eco-efficiency of 281 prefecture-level cities in China during 2006-2013, using the super-efficiency data envelopment analysis (SEDEA) model and proposed a new comprehensive index system to assess urbanization.
A great deal of work has been done developing DEA and indicators of eco-efficiency, both theoretically and practically. The results have improved the understanding of the relationship between economics, ecology, and natural resources. However, these studies have concentrated on a specific type of eco-efficiency and, for the most part, have been done at either the national or provincial level. Much of the research has neglected the comparative analysis of differences between eco-efficiency and economic efficiency, thus failing to reveal the loss of development efficiency due to pollutant emissions. There are few studies of the eco-efficiency of urban agglomerations composed of cities which have different scales and functions. In addition, emphasis has been placed on numerical analysis of the results, ignoring the mechanism of changes in eco-efficiency patterns, from the perspective of resource input, economic benefits, and environmental impacts. In order to address this deficiency, a traditional DEA model and an SBM model of undesirable outputs were used to perform a comparative evaluation of the economic efficiency and eco-efficiency of the four major urban agglomerations in eastern China (UAECs), in 2005, 2011, and 2014, Also, the spatio-temporal characteristics of evolution of eco-efficiency in the UAECs were analyzed. In addition, the influence mechanisms for the resource input, economic benefits, and environmental impact on eco-efficiency were explored. Finally, we recommend measures that can be taken to improve the eco-efficiency of the four UAECs.

2 Methods and data

2.1 CCR and BCC models

Data Envelopment Analysis (DEA) uses linear programming to estimate production frontiers and measure the efficiency of decision-making units (DMUs) (Charnes et al., 1985). The model evaluates the economic efficiency of N urban agglomerations, with the evaluation index system for L input index, M output index. We assume that xnl (xnl > 0) represents the input of the first resource of the n urban agglomeration and ynm (ynm > 0) represents the output of the M resource of the n urban agglomeration. For the urban agglomerations (n=1, 2, …, N), θ (0<θ≤1) represents the comprehensive technical efficiency index based on input resources; λn (λn≥0) is a weighted variable to determine the size returns of urban agglomerations; ε is a non-Archimedean infinitesimal quantity; s- (s-≥0) is a relaxation, reflecting the need for urban agglomerations to be reduced to reach the DEA effective value; s+ (s+≥0) is the residual variable, which represents the increase in output of the urban agglomeration in order to achieve the DEA effective value.
$\left\{ \begin{matrix} & \min (\theta -\varepsilon (\sum\limits_{l=1}^{L}{{{s}^{-}}+\sum\limits_{m=1}^{M}{{{s}^{+}}))}} \\ & \text{s}\text{.t}\text{.}\sum\limits_{n=1}^{N}{{{x}_{nl}}{{\lambda }_{n}}+{{s}^{-}}=\theta x_{l}^{n}\ \ \ l=1,2,\cdots ,L} \\ & \sum\limits_{n=1}^{N}{{{y}_{nm}}{{\lambda }_{n}}-{{s}^{+}}=y_{m}^{n}\ \ \ m=1,2,\cdots ,M} \\ & {{\lambda }_{n}}\ge 0\ \ \ n=1,2,\cdots ,N \\ \end{matrix} \right.$
The above formula is based on the DEA model of constant returns to scale (CRS model). When θ tends to 1, then urban agglomeration is more effective.
By introducing $\sum\limits_{n=1}^{N}{{{\lambda }_{n}}=1}$ as a constraint into Eq (1), the formula can be transformed into a DEA model with variable returns to scale (VRS). The economic comprehensive efficiency of the nth urban agglomeration is θn; technical efficiency of the urban agglomeration is θTE; and scale efficiency is θSE. Comprehensive efficiency can be obtained by using the VRS model, defined as the product of pure technical efficiency and scale efficiency: θn = θTE × θSE. Similarly, the closer the value of θTE and θSE is to 1, the closer the pure technical efficiency and scale efficiency of urban agglomerations are to being effective and vice versa. When the value is equal to 1, the pure technical efficiency or scale efficiency of the urban agglomeration is optimal.

2.2 SBM model

Based on previous work, this study applied a slack-based measure of efficiency DEA (SBM-DEA) model, which is able to take into account the effects of undesirable output (e.g. pollution) on efficiency (Wu, 2009). In contrast to traditional CCR and BCC models, the slack variables are added into the target function in the SBM model directly. The non-oriented SBM-DEA model with undesirable outputs (Cooper et al., 2007, 2011; Tone, 2004) is used to measure efficiency that is indicated by ρ of DMUo under evaluation (${{{x}'}_{{k}'n}}$, $y_{{k}'m}^{{{t}'}}$, $b_{{k}'i}^{{{t}'}}$) (where o = 1, …, k). This model provides for minimization of the following fractional objective function, which therefore implies the maximization of slack variables $S_{n}^{x}$, $S_{m}^{y}$, $S_{i}^{b}$ (Eq. (2)). Assuming that the DMUs set is k = {1,2, …, K}, where each DMU has N inputs, M desirable outputs, and I undesirable outputs.
$\rho =\min \frac{1-\frac{1}{N}\sum\limits_{n=1}^{N}{\frac{S_{n}^{x}}{{{{{x}'}}_{{k}'n}}}}}{1+\frac{1}{M+I}\left\{ \sum\limits_{m=1}^{M}{\frac{S_{m}^{y}}{y_{{k}'m}^{{{t}'}}}+\sum\limits_{i=1}^{I}{\frac{S_{i}^{b}}{b_{{k}'i}^{{{t}'}}}}} \right\}}$
$\begin{matrix} & \text{s}\text{.t}\text{.}\ \ \ \ \sum\limits_{t=1}^{T}{\sum\limits_{k=1}^{K}{z_{k}^{t}x_{kn}^{t}+S_{m}^{y}=x_{{k}'n}^{{{t}'}},\text{ }n=1,\cdots ,N}} \\ & \ \ \ \ \ \ \ \ \sum\limits_{t=1}^{T}{\sum\limits_{k=1}^{K}{z_{k}^{t}y_{km}^{t}-S_{m}^{y}=y_{{k}'m}^{{{t}'}},\text{ }m=1,\cdots ,M}} \\ & \ \ \ \ \ \ \ \ \sum\limits_{t=1}^{T}{\sum\limits_{k=1}^{K}{z_{k}^{t}b_{ki}^{t}+S_{i}^{b}=b_{{k}'i}^{{{t}'}},\text{ }i=1,\cdots ,I}} \\ & \ \ \ \ \ \ \ \ z_{k}^{t}\ge 0,S_{n}^{x}\ge 0,S_{m}^{y}\ge 0,\text{ }S_{i}^{b}\ge 0,\text{ }k=1,\cdots ,K \\ \end{matrix}$
where: i) ρ, $S_{n}^{x}$, $S_{m}^{y}$, $S_{i}^{b}$ are the efficiency score, excess input, good output deficit, and excess of undesirable output, and the DMUo is defined as efficient in the presence of the eco-environment when ρ=1 and consequently $S_{n}^{x}$=$S_{m}^{y}$=$S_{i}^{b}$=0 and ii) ${{\lambda }_{n}}({{\lambda }_{n}}\ge 0)$ is a weighted variable to determine the size returns of urban agglomerations. The objective function is normalized, allowing for comparison of the efficiency scores between the observations. In addition, the bad output, despite not being transferred, is treated as input in the constraints, but it is treated as output in the objective function, where it is located in the denominator.

2.3 Modified TOPSIS model with entropy technology

The TOPSIS model is a multiple-criteria decision-making method (MCDM), which can be used for selecting the best of a range of options. It considers the shortest Euclidean distance from the positive ideal solution and the farthest distance from the negative ideal solution, at the same time (Mao et al., 2016). Here, we utilize it to assess inputs and outputs in four urban agglomerations. The model can be calculated through several steps:
Step 1: Build the decision matrix:
$X={{({{x}_{ij}})}_{m\times n}}(i=1,2,\cdots m;j=1,2,\cdots ,n)$
where i is the observations and j is the criteria.
Step 2: Normalize the decision matrix via min-max normalization:
$R={{({{r}_{ij}})}_{m\times n}}(i=1,2,\cdots m;j=1,2,\cdots ,n)$
Step 3: Calculate the information entropy:
${{e}_{j}}=-k\sum\limits_{i=1}^{n}{{{p}_{ij}}\ln {{p}_{ij}}}$
where ${{p}_{ij}}=\frac{{{r}_{ij}}}{\sum\limits_{i=1}^{m}{{{r}_{ij}}}}$, $k=\frac{1}{\ln m}$.
Step 4: Define the weight of the index j:
${{w}_{j}}=\frac{1-{{e}_{j}}}{\sum\limits_{j=1}^{n}{(1-{{e}_{j}})}}$
Step 5: Build the weighted normalized decision matrix:
$Z={{({{z}_{ij}})}_{m\times n}},{{z}_{ij}}={{w}_{j}}\cdot {{r}_{ij}}(i=1,2,\cdots ,m;j=1,2,\cdots ,n)$
Step 6: Determine the positive ideal solution ($z_{i}^{+}$) and the negative ideal solution ($z_{i}^{-}$) values:
$\left\{ \begin{matrix} & z_{i}^{+}=\underset{j}{\mathop{\max }}\,({{z}_{ij}})(i=1,2,Lm;j=1,2,L,n) \\ & z_{i}^{-}=\underset{j}{\mathop{\min }}\,({{z}_{ij}})(i=1,2,Lm;j=1,2\text{, }L,n) \\\end{matrix} \right.$
Step 7: Calculate the Euclidean distance between each alternative and ideal solution/negative solution:
$\begin{matrix} & sep_{i}^{+}={{\sqrt{\sum\limits_{i=1}^{m}{(}{{z}_{ij}}-z_{i}^{+}{{)}^{2}}}}_{_{_{_{_{{}}}}}}} \\ & sep_{i}^{-}=\sqrt{\sum\limits_{i=1}^{m}{(}{{z}_{ij}}-z_{i}^{-}{{)}^{2}}} \\ \end{matrix}$
Step 8: Finish by calculating the comprehensive index:
${{C}_{i}}=\frac{sep_{i}^{-}}{sep_{i}^{+}+sep_{i}^{-}}$
where the higher Ci is, the better the observation is.

2.4 Indicators and data

2.4.1 Evaluation of indicators of eco-efficiency
Generally, the number of input and output indicators are less than or equal to 1/3 of the number of decision-making units, in the DEA method. In eco-efficiency literature, the most important input elements are generally considered to be capital, natural resources, and labor factors. In addition, energy consumption, as a prerequisite for urban development, and the added value of tertiary industry, which reflects the characteristics of eastern urban industrial development, are often neglected. Based on the previous study (Zhou et al., 2018), we chose ten factors to investigate their effect on eco-efficiency. The index system of eco-efficiency of urban agglomerations was built, with the input index divided into four first-class indexes: capital input, manpower input, natural input, and energy input. The index was further subdivided into six sub-indexes: the total value of fixed asset investment, the actual value of foreign capital utilization, the built-up area, the total amount of water used, the total number of employees, and the amount of standard coal consumption. Output indicators were divided into two first-class indicators: benefit output and pollution output. These included gross national product (GDP), total industrial output, government revenue, added value of tertiary industry, waste water discharge, exhaust gas emissions, and smoke and dust emissions, for a total of seven second-class indicators (Table 1).
Table 1 Evaluation indicators for eco-efficiency of urban agglomeration
Category Item Indicator
Input Capital Fixed assets investment, disbursement of foreign capital
Natural resources Construction land area, water consumption
Labor Employees
Energy Energy consumption
Output Desirable output GDP, gross industrial output value, local financial revenue, added value of tertiary industry
Undesirable output Total waste water discharge, industrial exhaust gas emission, and industrial smoke and dust emissions
2.4.2 Data sources
Data for this study were provided by the work of Fang et al. (2014), who evaluated eco-efficiency in the urban agglomerations of Beijing-Tianjin-Hebei (BTH), the Shandong Peninsula (SP), the Yangtze River Delta (YRD), and the Pearl River Delta (PRD), in eastern coastal China for prefecture-level cities. Cross-sectional data of 42 cities, as the representative cities of each urban agglomeration, from 2005 to 2014, were used. The original data were from the China City Statistical Yearbook and the Statistical Bulletins on the national economic and social development of Beijing, Tianjin, Shanghai, Hebei, Shandong, Jiangsu, Zhejiang, and Guangdong provinces, in the relevant years.

3 Results and discussion

3.1 Temporal evolution of economic efficiency

We evaluate the economic efficiency of UAECs, which was divided into three parts of comprehensive efficiency, pure technology efficiency and scale efficiency of the economy, via traditional DEA model to compare with eco-efficiency.
3.1.1 Temporal evolution of comprehensive efficiency of the economy
The comprehensive efficiency (CE) embodies the ability to transform resources input into economic benefits. The average economic comprehensive efficiency in 2005, 2011, and 2014 is 0.940, 0.905, and 0.938, respectively, that is, 94%, 90.5%, and 93.8% of the optimal DEA. The overall economic efficiency of urban agglomerations located in the Shandong Peninsula, Yangtze River Delta, and Pearl River Delta displays a V-shaped pattern of “first decrease and then increase.” There are clear differences in the CE of the four urban agglomerations. Figure 1a shows that the CE of the Beijing-Tianjin-Hebei urban agglomeration has a downward trend from 0.934 in 2005 to 0.887 in 2014. The rate of decline is 4.96%, indicating that the rationality of urban agglomeration resource allocation and economic efficiency transformation capacity is relatively low. Although the CE of the Shandong Peninsula, Yangtze River Delta, and Pearl River Delta urban agglomerations declines in 2011, it improves in 2014, particularly in the Yangtze River Delta urban agglomeration, which increases by 8% from 0.898 in 2011 to 0.970 in 2014. Based on the CE of urban agglomeration, it is obvious that the Beijing-Tianjin-Hebei urban agglomeration has a “dual-core” drive development trend. The Beijing-Tianjin economic efficiency (Figure 2a) is relatively prominent. Most of the cities in the Hebei Province 2011 and 2014 DEA are inefficient, highlighting substantial gaps in economic efficiency among urban agglomerations. Although the CE of the Shandong Peninsula urban agglomeration is better, the economic efficiency of low-level cities is far less than that of other cities. Here, Liebig’s law (Figure 2a) is an important factor. The CE of the urban economy in the Yangtze River Delta urban agglomeration improves rapidly after 2011, reaching more than 90% of the optimal frontier of the DEA and maintaining a high level. Even though more than 50% of the cities in the Pearl River Delta urban agglomeration are at the optimal frontier of the DEA in three time sections, the average level is lower because of the low CE of some cities.
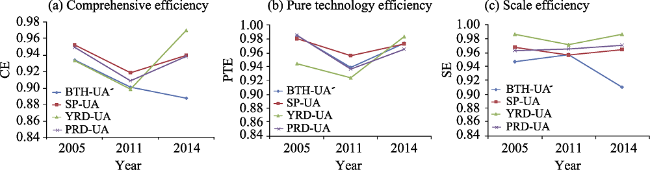
Figure 1 Economic efficiency of UAECs: BTH-UA refers to Beijing-Tianjin-Hebei urban agglomeration; SP-UA to Shandong Peninsula urban agglomeration; YRD-UA to Yangtze River Delta urban agglomeration; PRD-UA to Pearl River Delta urban agglomeration
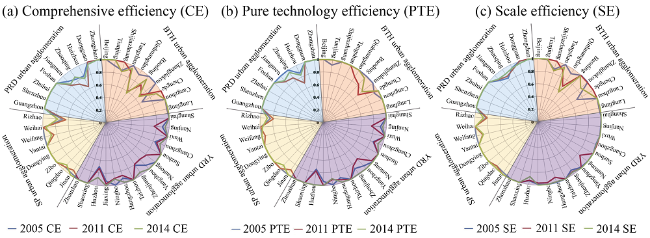
Figure 2 Radar charts of economic efficiency of cities in UAECs
3.1.2 Temporal evolution of pure technology efficiency of the economy
The pure technology efficiency (PTE) reflects the rational allocation and utilization level of input resources. Figure 1b illustrates that, although the PTE of the four UAECs declines in 2005-2011, it improves significantly in 2011-2014, showing a V-shaped overall pattern of evolution. The PTE of the Beijing-Tianjin-Hebei urban agglomeration and the Pearl River Delta urban agglomeration declines by 4.6% and 4.9% in 2005-2011, and that of the Yangtze River Delta urban agglomeration increases by 6.4% in 2011-2014. This shows that the urban agglomeration in the Yangtze River Delta is a leader in improving pure technical efficiency. From the perspective of pure urban economic efficiency, most of the core cities and regional core cities in the four UAECs reach more than 90% of the frontier and change relatively little in the three time periods, with strong stability. Among the three time periods, the cities whose economic and technological efficiency does not reach the optimal frontier of the DEA are mainly small and medium-sized cities, with secondary industries (Figure 2b).
3.1.3 Temporal evolution of scale efficiency of the economy
The scale efficiency (SE) reflects the scale and agglomeration level of urban agglomeration economies. As shown in Figure 1c, there are large differences in the evolution patterns of SE among the four UAECs. Only the Pearl River Delta urban agglomeration shows an upward trend during the study period, where the SE increases from 0.963 in 2005 to 0.970 in 2014. There is a slight downward trend of SE in the urban agglomerations of the Shandong Peninsula and Yangtze River Delta, from 2005 to 2011, but this changes to an upward trend after 2011. The SE pattern in the Beijing-Tianjin-Hebei urban agglomeration is an inverted V-shaped pattern, which shows an upward trend between 2005 and 2011 and then decreases from 0.957 in 2011 to 0.911 in 2014. Thus, the SE of most prefectural-level cities is effectively raised and maintained at a high level (Figure 2c).

3.2 The spatio-temporal evolution of eco-efficiency (EE) based on an SBM model with undesirable outputs

The traditional DEA models, i.e. CCR and BBC, neglect the effect of undesirable outputs on efficiency. To actually measure the effect of environmental factors on efficiency, the SBM model with undesirable outputs was used. The results, presented in Figure 3, show that taking into account the impact of environmental factors, the average eco-efficiency of the four eastern urban agglomerations in 2005, 2011, and 2014 is 0.897, 0.847, and 0.892, respectively, which is 89.7%, 84.7%, and 89.2% of the optimal production frontier of the DEA. Compared with the CE calculated by the traditional DEA model, the average eco-efficiency of the four UAECs decreased by 4.4% (2005), 5.8% (2011), and 4.6% (2014), indicating that environmental factors cause a loss of efficiency. Figure 3 shows that at the beginning of the observation period, the eco-efficiency of the Beijing-Tianjin-Hebei urban agglomeration is relatively low. Efficiency loss due to environmental factors is the largest in this area. In contrast, the eco-efficiency of the Shandong Peninsula urban agglomeration is relatively high, because there, eco-efficiency is the least affected by environmental factors.
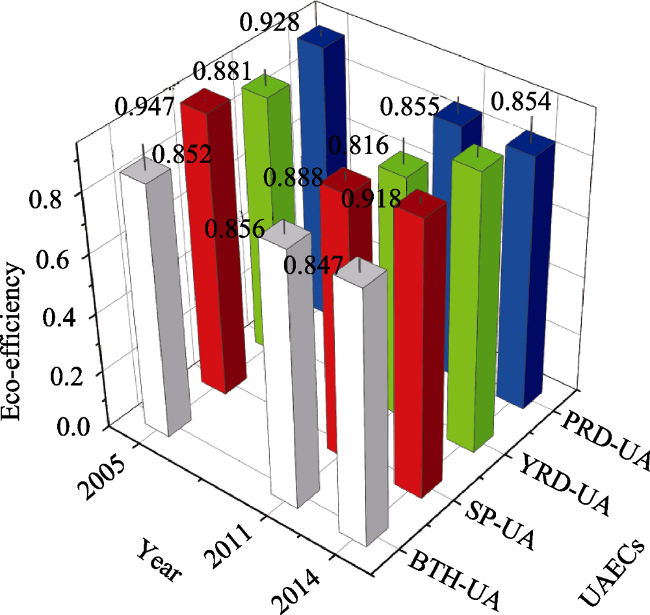
Figure 3 Evaluation of eco-efficiency based on a DEA- SBM for China’s four eastern urban agglomerations
From 2005 to 2011, the eco-efficiency of the Shandong Peninsula, Yangtze River Delta, and Pearl River Delta urban agglomerations decreases. The Pearl River Delta urban agglomeration decreases the most, by 0.073. Although the eco-efficiency of the Beijing- Tianjin-Hebei urban agglomeration increases slightly, from 0.852 to 0.856, the value of eco-efficiency remains low. The explanation for this phenomenon is that during this period of rapid urbanization in China, large and medium-sized cities in the eastern region expanded, which led to a continuous increase in resource development, environmental pollution, and ecological service function pressure. Thus, the overall eco-efficiency of urban agglomerations is relatively low.
From 2011 to 2014, the eco-efficiency of the Shandong Peninsula and Yangtze River Delta urban agglomerations increases, from 0.888 and 0.816 to 0.918 and 0.931. The Yangtze River Delta urban agglomeration has the most significant improvement. The eco- efficiency of the Beijing-Tianjin-Hebei and Pearl River Delta urban agglomerations remain largely stable. The rapid downward trend of the eco-efficiency of the Pearl River Delta urban agglomeration is reversed. There is no doubt that eco-efficiency improved because of the lagged effect of economic stimulus plan. It also improved because the local government promoted industry upgrades and transformations, thereby eliminating a number of highly polluting, unproductive industries. Overall, the eco-efficiency of the four UAECs decreases in 2005-2011 and is restored in 2011-2014. The Shandong Peninsula and Pearl River Delta urban agglomerations are relatively efficient areas.
Figure 4 illustrates clear differences in the spatio-temporal evolution of the eco-efficiency of the four UAECs. The spatial pattern of eco-efficiency of the Beijing-Tianjin-Hebei urban agglomeration starts with a high in the middle and low in the south, and it evolves to a high along the axis of Chengde-Cangzhou and a low mainly located in the east-west cities. For the Shandong Peninsula urban agglomeration, the distribution pattern of urban eco-efficiency remains stable, with high value areas located in the northern and eastern coastal zones, while the low value areas are located in the central and southern parts. The spatial pattern of the eco-efficiency of the Yangtze River Delta urban agglomeration gradually decreases from the high value areas along the eastern coast to lower values to the west. In particular, low value areas exist along the border with Anhui Province. Moving east, west, and north, the eco-efficiency of the urban agglomeration in the Pearl River Delta generally decreases from the high value areas along the coast of the Pearl River Estuary and the cities along the Yangtze River.
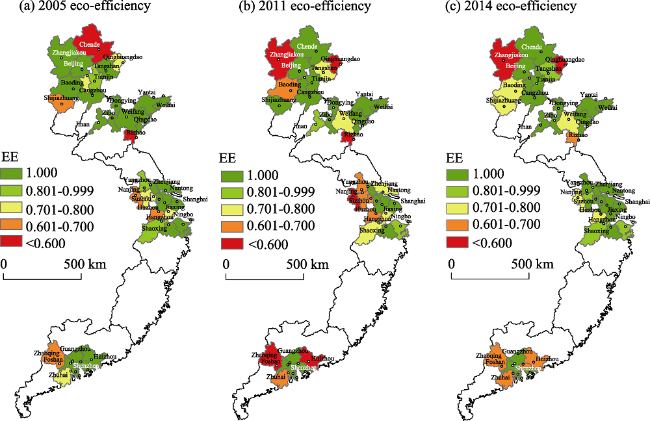
Figure 4 Spatial pattern of eco-environmental efficiency based on SBM for UAECs
In order to analyze the temporal variation of eco-efficiency of urban agglomerations, the coefficient of variation (CV) and Gini coefficient, which can reflect the change and trend of eco-efficiency in time, were calculated. From 2005 to 2014, the coefficient of variation of the Beijing-Tianjin-Hebei urban agglomeration (0.204-0.228), Shandong Peninsula urban agglomeration (0.160-0.170), and Pearl River Delta urban agglomeration (0.155-0.204) increases continuously, and the difference in eco-efficiency among the inner cities increases gradually. Only the coefficient of variation (0.161-0.116) of the Yangtze River Delta decreases continuously, showing a relatively reasonable trend of reducing the difference in eco-efficiency. The Gini coefficient from 2005 to 2014 for the Beijing-Tianjin-Hebei urban agglomeration (0.102-0.114), Shandong Peninsula urban agglomeration (0.049-0.069), and Pearl River Delta urban agglomeration (0.061-0.098) increases, while the Yangtze River Delta urban agglomeration (0.082-0.053) decreases.

3.3 Analysis of the coupled relationship between eco-efficiency and comprehensive factor input: economic benefits and environmental impact

China’s continued urbanization and industrialization has led to intense use of resources, but the development model for some regions is still “intense resource consumption, high economic benefits, and high pollution.” This irrational use of resources has caused economic sub-health problems and affected sustainable development. It is important to analyze how eco-efficiency is related to resource consumption, economic benefits, and pollution emissions. First, the TOPSIS model supported by entropy technology was used to synthesize the urban agglomeration eco-efficiency measurement indicators into three indicators: resource input (RI), economic benefit (EB), and environmental pollution (EP) index (Figure 5). As a result, the urban integration indicators in the urban agglomeration corresponded to their eco-efficiency. Finally, we utilized the K-means clustering method to divide the three comprehensive indicators into three categories: high, medium, and low (Figure 6).
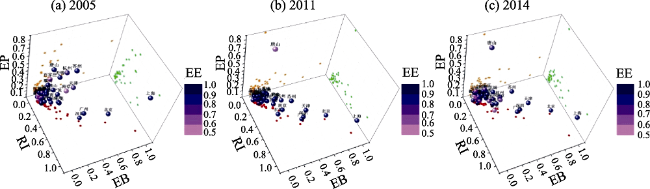
Figure 5 Comprehensive evaluation of resources, economic benefits, and environmental impact of UAECs
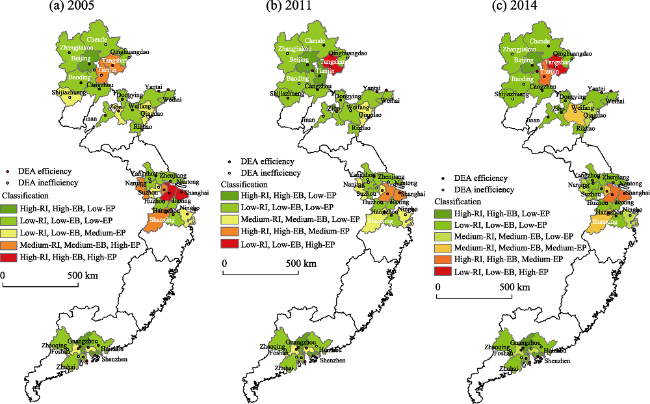
Figure 6 Classification of resources, economic benefits, and environmental impact of the four UAECs
The results demonstrate the following:
(1) Cities with a distribution pattern of high RI and high EB that remains basically unchanged, EP level that gradually shifts to low EP, and eco-efficiency that remains at the DEA optimal frontier (referred to as DEA efficient) are often core areas of UAECs, with high levels of social and economic development. The ability of these cities to convert resource investment into economic efficiency far exceeds that of other cities, and the accumulation of financial resources is focused on environmental governance and technological transformation. The cities with these characteristics are Beijing, Shanghai, Suzhou, Guangzhou, and Shenzhen.
(2) Medium-RI and medium-EB cities are usually regional core cities. The level of pollutant emissions has a downward trend, medium-level resources are consumed, and medium economic benefits are produced. At the same time, we should focus on reducing pollutant emissions, but due to the unreasonable allocation of factors in some cities, the eco-efficiency of the cities with these characteristics does not reach the optimal frontier of the DEA, include Nanjing, Hangzhou, and Wuxi. This type of city can turn into a “high-RI, high-EB, low-EP” city by increasing the input of resources, improving the production technology level, reducing pollutant emissions, and optimizing the allocation of input factors. This will lead to an improvement in eco-efficiency and the DEA optimal frontier can be achieved. Tianjin is an example of this type of city.
(3) There are many cities (50%) with low-RI, low-EB, and low-EP, and most of these cities reach the optimal frontier of the DEA. With economic development, some of these cities change to medium-RI, medium-EB, and medium-EP. Although the economic benefit improves with increasing resource consumption and increasing production capacity, the eco-efficiency declines because of the increase of pollutant emissions. Jinan is an example of this type of city.

3.4 Analysis and optimization of factors affecting the inefficiency of eco-efficiency

According to the principles of the SBM model, if the effective value (ρ) of DMU is less than 1, then the size of the slack variables, such as ${{S}^{-}},\,{{S}^{g}},\,{{S}^{b}}$reflects the reason for urban ecological inefficiency in the four eastern urban agglomerations. The change in slack value reflects the improvement potential of energy input allocation to a certain extent. We analyzed the average values of slack variables ${{S}^{-}},\,{{S}^{g}},\,{{S}^{b}}$about the input factors of the four UAECs in 2014, and the results are shown in Table 2.
Table 2 Optimization of eco-environmental efficiency in China’s four eastern urban agglomerations
Urban agglomeration Improvement potential of slack variables (δij / %)
Fixed assets investment Disbursement of foreign capital Employees Construction land area Energy consumption Water consumption
BHT 10.74 17.72 26.17 12.75 15.03 9.29
SP 4.23 17.64 12.22 3.93 9.93 1.28
YRD 5.43 13.60 8.49 4.84 5.58 3.70
PRD 2.85 26.47 22.55 18.98 4.144 12.74
The results demonstrate the following:
(1) There is a relatively high improvement potential for energy consumption and employment in the Beijing-Tianjin-Hebei urban agglomeration. The output value proportion of high energy-consuming industries such as ferrous metals smelting and rolling, petroleum processing, and non-ferrous metals is still high in the Beijing-Tianjin-Hebei urban agglomeration. However, the efficiency of human resource utilization in the Beijing Tianjin-Hebei urban agglomeration is low. A number of national programs could provide support to increase production innovation and apply new materials, new technologies, and advanced methods to traditional industrial production. This would enhance production efficiency, reduce energy consumption, and achieve clean production. It is also necessary to be guided by sustainable development and promote the development of an industrial circular economy in central and southern Hebei. In addition, to reduce the environmental problems caused by heavy industry, it would be helpful to utilize production process automation and intelligent control, by using modern electronic information technology and strengthening the monitoring of resource and energy consumption.
(2) The potential for improvement of foreign direct investment (FDI) utilization in the Shandong Peninsula urban agglomeration is relatively high, which indicates that the efficiency of FDI allocation in this urban agglomeration is low. A large amount of foreign capital does not bring corresponding economic benefits. The main reason for this is that the foreign capital attracted by the Shandong Peninsula urban agglomeration is concentrated in secondary industries, particularly labor-intensive and low value-added general processing manufacturing, which, to a certain extent, restricts the upgrading and transformation of the economic structure. Therefore, the Shandong Peninsula urban agglomeration should actively guide the industrial direction of FDI, focusing on capital and technology-intensive advanced manufacturing, high-tech industries, and modern service industries, in order to enhance the economic benefits created by foreign capital. Also, to attract foreign capital, emphasis should be placed on absorbing and integrating foreign advanced technology, promoting the transformation of industry from traditional resource-intensive to technology-intensive, and accelerating the construction of China's advanced manufacturing industry and strategic emerging industrial base. Finally, we should accelerate the development of marine economic industry, focusing on promoting the development of new projects such as marine clean energy, a modern marine service industry, and marine science and education innovation, in order to reduce the ecological risks of economic development and improve eco-efficiency.
(3) Foreign investment mainly affects the industrial scale. In the past, scholars believed that expanding the industrial scale had a positive effect on eco-efficiency. However, the proportion of secondary industry in some cities of the Yangtze River Delta urban agglomeration is still high, so expanding the industrial scale may not have a positive effect on eco-efficiency. The majority of secondary industries have high energy consumption and generate a large amount of pollution. The development scale of industry is proportional to the consumption of resources and energy, so the larger the scale of the industry the greater the demand for resources. Also, as investment in economic factors increases, so do pollution emissions. The efficiency of resource utilization varies significantly because of different technological processes, technical levels, and production modes. Therefore, we should make rational use of funds, control the scale of industries, and guide foreign investment to focus on improving production technology, such as improving clean production capacity, reducing energy consumption, and reducing pollutant emissions.
(4) The total number of employees and the built-up area has a higher improvement potential in the Pearl River Delta urban agglomeration. This shows that there are a considerable number of labor-intensive industries in the Pearl River Delta urban agglomeration. These industries have outdated equipment and technology and mainly rely on a large pool of cheap labor. The Pearl River Delta urban agglomeration should make use of its advantages, such as having many high-tech, electronic information, and communication industries, and independent research and development capabilities. In this way, the area can provide scientific and technical guidance, enhance the overall quality of the labor force, rationally use human resources, improve efficiency, and increase the added value of products. The high improvement potential of the urban area indicates that land resources are wasted. During rapid industrialization and urbanization, the intensive use of land should be a priority. Eco-friendly land use can be achieved by improving the marketing and operation of land and introducing advanced new land planning concepts.
In addition, there is a high potential for improvement in the foreign capital utilization of the four UAECS, indicating that the allocation proportion of direct foreign investment is unbalanced. In absorbing foreign capital, China has always emphasized production-oriented investment, resulting in foreign investment concentrated in industries. It is difficult to produce greater economic benefits during a global economic downturn and with excessive domestic capacity. In the future, we should actively increase the proportion of foreign investment in industries that attract the most investment in other developed countries, such as finance, insurance, commerce, and foreign trade. In addition, we should avoid the practice of “attaching importance to quantity rather than quality, attaching importance to import rather than management” and further optimize the allocation efficiency of foreign investment.

4 Conclusions

A traditional DEA model was used to measure the CE of four UAECs. The CE of the Shandong Peninsula, Yangtze River Delta, and Pearl River Delta urban agglomerations showed a V-shaped evolution pattern, which declined in 2005-2011 and increased in 2011-2014. The CE of the Yangtze River Delta urban agglomeration improved rapidly after 2011, and the CE of the inner cities generally reached over 90% of the optimal frontier of the DEA. However, the CE of the Beijing-Tianjin-Hebei urban agglomeration declined, and the level of resource allocation and economic efficiency transformation was relatively low. The overall efficiency of the four UAECs was optimized.
The undesirable SBM model was used to measure the eco-efficiency of four UAECs. The results showed that the economic efficiency of the urban agglomerations, measured with a traditional DEA model, was higher than that of the SBM model with undesirable outputs. Environmental factors caused a loss of eco-efficiency that varied by region. The Beijing-Tianjin-Hebei urban agglomeration had the biggest loss, due to the environmental impact. The eco-efficiency of the four urban agglomerations decreased and then increased. The eco-efficiency of the Yangtze River Delta urban agglomeration had the most significant improvement, increasing from 0.816 to 0.931, from 2011 to 2014. The spatio-temporal evolution pattern of urban eco-efficiency in the four UAECs was different. In general, the eco-efficiency of urban agglomerations around the core cities and the coastal areas along the Yangtze River, was higher than that of the inland cities. With the exception of the Yangtze River Delta urban agglomeration, the CV and Gini coefficient of eco-efficiency of the urban agglomerations increased, indicating that the gap in eco-efficiency between cities in this area is gradually increasing.
The TOPSIS model and the K-means clustering model were used to synthesize and classify the indicators, to establish a superposition relationship. Taking 42 cities in the four UAECs as an example, we found that the core cities in Beijing-Tianjin-Hebei, the Yangtze River Delta, and the Pearl River Delta urban agglomerations had high resource consumption intensity, large economic output, and high eco-efficiency. Most cities in the urban agglomerations had a downward trend in pollutant emissions, indicating that environmental regulations are having an effect.
We analyzed the slack of the SBM model with undesirable outputs and found that the causes for the eco-efficiency of the four UAECs varied. We conducted a differential analysis at the urban agglomeration scale and proposed reasons for these differences.
[1]
Bai Y P, Deng X Z, Jiang S J et al., 2018. Exploring the relationship between urbanization and urban eco-efficiency: Evidence from prefecture-level cities in China. Journal of Cleaner Production, 195:1487-1496.

[2]
Bozoğlu M, Ceyhan V , 2009. Energy conversion efficiency of trout and sea bass production in the Black Sea, Turkey. Energy, 34(2):199-204.

[3]
Camarero M, Castillo J, Picazo-Tadeo A J et al., 2013. Eco-efficiency and convergence in OECD countries. Environmental and Resource Economics, 55(1):87-106.

[4]
Charnes A, Cooper W W, Golany B et al., 1985. Foundations of data envelopment analysis for Pareto-Koopmans efficient empirical production functions. Journal of Econometrics, 30(1/2):91-107.

[5]
Cooper W W, Seiford L M, Tone K , 2007. Data Envelopment Analysis: A Comprehensive Text with Models, Applications, References, and DEA-solver Software. Springer.

[6]
Cooper W W, Seiford L M, Zhu J , 2011. Data Envelopment Analysis: History, Models, and Interpretations. Springer.

[7]
EEA, 1999. Making Sustainability Accountable: Eco-Efficiency, Resource Productivity and Innovation. European Environment Agency Publication.

[8]
EEA, 2000. Environmental Signals, Copenhagen. European Environment Agency Publication.

[9]
Fang C L , 2014. Important research progress and development directions of China’s urban agglomeration. Acta Geographica Sinica, 69(8):1130-1144. (in Chinese)

[10]
Fang C L, Guan X L , 2011. Comprehensive measurement and spatial distinction of input-output efficiency of urban agglomerations in China. Acta Geographica Sinica, 66(8):1011-1022. (in Chinese)

[11]
Fang C L, Mao Q Z, Ni P F , 2015. Discussion on the scientific selection and development of China’s urban agglomerations. Acta Geographica Sinica, 70(4):515-527. (in Chinese)

[12]
Fang C L, Song J T, Zhang Q et al., 2005. The formation, development and spatial heterogeneity patterns for the structures system of urban agglomerations in China. Acta Geographica Sinica, 60(5):827-840. (in Chinese)

[13]
Fang C L, Yu D L , 2017. Urban agglomeration: An evolving concept of an emerging phenomenon. Landscape & Urban Planning, 162:126-136.

[14]
Goto M, Otsuka A, Sueyoshi T , 2014. DEA (Data Envelopment Analysis) assessment of operational and environmental efficiencies on Japanese regional industries. Energy, 66:535-549.

[15]
Huang Y, Li L, Yu Y T , 2018. Does urban cluster promote the increase of urban eco-efficiency? Evidence from Chinese cities. Journal of Cleaner Production, 197:957-971.

[16]
Huppes G, Ishikawa M , 2005. A framework for quantified eco-efficiency analysis. Journal of Industrial Ecology, 9(4):25-41.

[17]
Lee T, Yeo G, Thai V , 2014. Environmental efficiency analysis of port cities: Slacks-based measure data envelopment analysis approach. Transport Policy, 33(4):82-88.

[18]
Liu Yong, Wang W, Li X Q et al., 2010. Eco-efficiency of urban material metabolism: A case study in Xiamen, China. International Journal of Sustainable Development & World Ecology, 17(2):142-148.

[19]
Lu B, Yang J X , 2006. Review of methodology and application of eco-efficiency. Acta Ecologica Sinica, 26(11):3898-3906. (in Chinese)

[20]
Mao N, Song M J, Deng S M , 2016. Application of TOPSIS method in evaluating the effects of supply vane angle of a task/ambient air conditioning system on energy utilization and thermal comfort. Applied Energy, 180:536-545.

[21]
Rashidi K, Shabani A, Saen R F , 2015. Using data envelopment analysis for estimating energy saving and undesirable output abatement: A case study in the Organization for Economic Co-operation and Development (OECD) countries. Journal of Cleaner Production, 105:241-252.

[22]
Schaltegger S, Synnestvedt T , 2002. The link between 'green' and economic success: environmental management as the crucial trigger between environmental and economic performance. Journal of Environmental Management, 65(4):339-346.

[23]
Shabani A, Torabipour S M R, Farzipoor Saen R et al., 2015. Distinctive data envelopment analysis model for evaluating global environment performance. Applied Mathematical Modelling, 39(15):4385-4404.

[24]
UNESCAP, 2010. Eco-efficiency Indicators: Measuring Resource-use Efficiency and the Impact of Economic Activities on the Environment. United Nations Publication.

[25]
United Nations Conference on Trade and Development, 2003. Integrating Environmental and Financial Performance at the Enterprise Level: A Methodology for Standardizing Eco-efficiency Indicators. United Nations Publication, 29-30.

[26]
WBCSD, 2001. Eco-efficient Leadership for Improved Economic and Environmental Performance. World Business Council for Sustainable Publication.

[27]
Wettemann P J C, Latacz-Lohmann U , 2017. An efficiency-based concept to assess potential cost and greenhouse gas savings on German dairy farms. Agricultural Systems, 152:27-37.

[28]
Wu Q, Wu C Y , 2009. Research on evaluation model of energy efficiency based on DEA. Journal of Management Sciences, 22(1):103-112. (in Chinese)

[29]
Zhang B, Bi J, Fan Z Y et al., 2008. Eco-efficiency analysis of industrial system in China: A data envelopment analysis approach. Ecological Economics, 68(1/2):306-316.

[30]
Zhang J R, Guo Y H , 2004. The relationship between the number of factors and DEA efficiency. Systems Engineering: Theory Methodology Applications, 13(6):520-523. (in Chinese)

[31]
Zhou C S, Shi C Y, Wang S J et al., 2018. Estimation of eco-efficiency and its influencing factors in Guangdong province based on super-SBM and panel regression models. Ecological Indicators, 86:67-80.

Outlines

/