
Journal of Geographical Sciences >
Innovation-based urbanization: Evidence from 270 cities at the prefecture level or above in China
|
Lyu Lachang (1963-), PhD and Professor, specialized in the geography of innovation, new economies and urban development. E-mail: lachanglu@163.com |
Received date: 2019-01-28
Accepted date: 2019-03-06
Online published: 2019-12-13
Supported by
National Natural Science Foundation of China(No. 41471136)
Copyright
With the rapid development of knowledge economy, a number of important shifts are emerging in urbanization pattern across the world. Traditional urbanization theory has become hard to interpret these changes on a global scale, and “innovation” is a core concept to explain the new changes of the urbanization dynamics. As one of the important contents of urban geography, urbanization dynamic needs to turn from the general population flows between rural and urban areas into emphasizing high skilled migrants flow among cities and regions research. Against this background, we propose a conception of innovation-based urbanization. Using this concept, this study analyzes the spatial distribution characteristics of high skilled migrants and cultural diversity on urban innovation in China, based on the data of the sixth census of 270 cities at the prefecture level or above in China. This study measures the extent to which highly skilled migrants and cultural diversity increase urban innovation, by using spatial Durbin method to construct urban innovation regression model, to support the concept of innovation-based urbanization. The result shows that: first of all, the concept of innovation-based urbanization conforms to the development of knowledge economy, which emphasizes the migration process of highly skilled labor to cities. It helps to promote the changes in urban functions and landscapes and the expansion of urban knowledge activities, which undelines new dynamics of urban development, innovative landscape. Secondly, innovation urbanization based on highly skilled migrants flow is an important driving force for the development of Chinese cities, especially for eastern coastal cities and capital cities. Thirdly, the scale of highly skilled migrants flow and the level of urban cultural diversity in China both have been demonstrated of having positive effect on urban innovation output. With other conditions unchanged, a 10% increase in the number of urban highly skilled migrants and urban cultural diversity will directly result in an increase of 3% and 2% in urban innovation output respectively. This research has deepened our understanding and awareness of the openness and dynamics of the regional innovation system, and it has also provided an important theoretical basis for the formulation of urbanization and urban development policy under knowledge economy.
LYU Lachang , SUN Feixiang , HUANG Ru . Innovation-based urbanization: Evidence from 270 cities at the prefecture level or above in China[J]. Journal of Geographical Sciences, 2019 , 29(8) : 1283 -1299 . DOI: 10.1007/s11442-019-1659-1
Table 1 Urban innovation variables declaration |
| Variable | Variable definitions | Expected symbol | |
|---|---|---|---|
| Urban innovation output level | P | Patent applications | + |
| R&D investment | RD | Research and Experimental Development (R&D) Expenditure | + |
| High skilled migration population | HIGH | Migration population with college degree or above | + |
| Cultural diversity | DIV | Cultural diversity index | + |
| Industrial scale | INDUSTRY | Number of industrial enterprises above designated size | + |
| Human capital level | HC | The number of university students per 10,000 population | + |
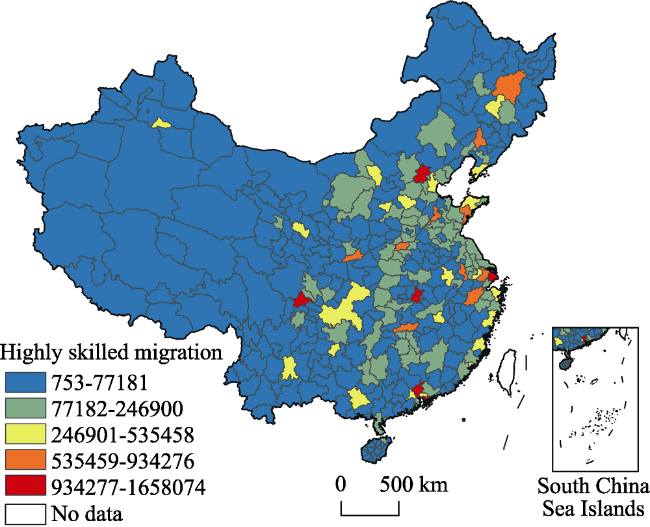
Figure 1 The spatial distribution of intercity highly skilled migration of China in 2010 |
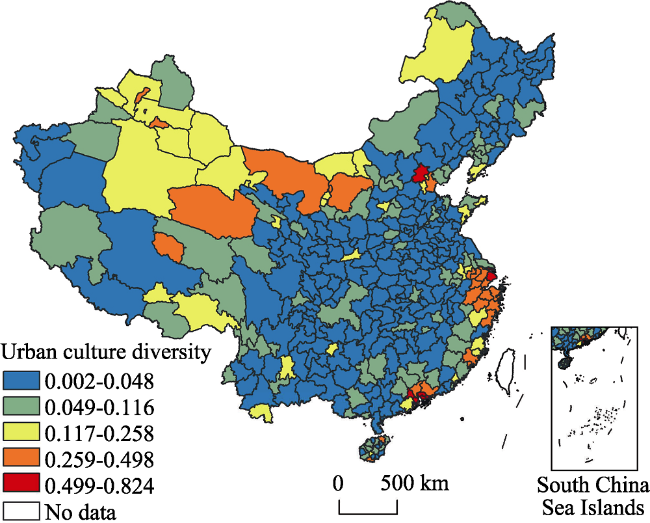
Figure 2 The spatial distribution of cultural diversity of China in 2010 |
Table 2 Moran's I value |
| Variable | Moran's I | Z value | P value |
|---|---|---|---|
| P | 0.351 | 9.177 | 0 |
| RD | 0.23 | 6.048 | 0 |
| HIGH | 0.105 | 2.829 | 0.002 |
| DIV | 0.572 | 14.894 | 0 |
| INDUSTRY | 0.437 | 11.409 | 0 |
| HC | 0.043 | 1.205 | 0.114 |
Table 3 Parameter estimates of SDM |
| Variable | Coefficient of elasticity | t value | Variable | Coefficient of elasticity | t value |
|---|---|---|---|---|---|
| RD | 0.248*** | 6.985 | W*RD | -0.137* | -1.944 |
| HIGH | 0.283** | 4.390 | W*HIGH | -0.045 | -0.666 |
| DIV | 0.214*** | 4.241 | W*DIV | -0.243*** | -4.309 |
| INDUSTRY | 0.507*** | 7.651 | W*INDUSTRY | -0.074 | -0.681 |
| HC | 0.094*** | 2.139 | W*HC | -0.116 | -1.468 |
| Constant term | -1.465 | -6.834 | |||
| ρ(W*P) | 0.496*** | 8.229 | |||
| Adjust R2 | 0.885 | ||||
| Log likelihood | 132.309 |
Note: ***, 1% levels are significant;**,5% levels are significant;*,10% levels are significant. Same below |
Table 4 Direct and indirect effect estimates of SDM |
| Variable | Direct effect | t value | Indirect effect | t value | Total effect | t value |
|---|---|---|---|---|---|---|
| RD | 0.246*** | 6.487 | -0.030 | -0.237 | 0.215 | 1.473 |
| HIGH | 0.297*** | 4.475 | 0.190 | 1.321 | 0.487*** | 2.742 |
| DIV | 0.196*** | 4.211 | -0.257*** | -3.425 | -0.061 | -0.877 |
| INDUSTRY | 0.530*** | 8.418 | 0.333** | 2.100 | 0.863*** | 5.274 |
| HC | 0.084* | 1.821 | -0.138 | -0.932 | -0.055 | -0.320 |
| [1] |
|
| [2] |
|
| [3] |
|
| [4] |
|
| [5] |
|
| [6] |
|
| [7] |
|
| [8] |
|
| [9] |
|
| [10] |
|
| [11] |
|
| [12] |
|
| [13] |
|
| [14] |
|
| [15] |
|
| [16] |
|
| [17] |
|
| [18] |
|
| [19] |
|
| [20] |
|
| [21] |
|
| [22] |
|
| [23] |
|
| [24] |
|
| [25] |
|
| [26] |
|
| [27] |
|
| [28] |
|
| [29] |
|
| [30] |
|
| [31] |
|
| [32] |
|
| [33] |
|
| [34] |
|
| [35] |
|
| [36] |
|
| [37] |
|
| [38] |
|
| [39] |
|
| [40] |
|
| [41] |
|
| [42] |
|
| [43] |
|
| [44] |
|
| [45] |
|
| [46] |
|
| [47] |
|
| [48] |
|
| [49] |
|
| [50] |
|
| [51] |
|
| [52] |
|
| [53] |
|
| [54] |
|
| [55] |
|
| [56] |
|
| [57] |
|
| [58] |
|
| [59] |
|
| [60] |
|
| [61] |
|
| [62] |
|
/
| 〈 |
|
〉 |