
Journal of Geographical Sciences >
Assessing China’s human-environment relationship
|
Yang Yu (1984-), Professor, specialized in energy geography and regional studies. E-mail: yangyu@igsnrr.ac.cn |
Received date: 2018-09-10
Accepted date: 2018-11-01
Online published: 2019-12-13
Supported by
National Natural Science Foundation of China(No.41430636)
National Natural Science Foundation of China(No.41571159)
Copyright
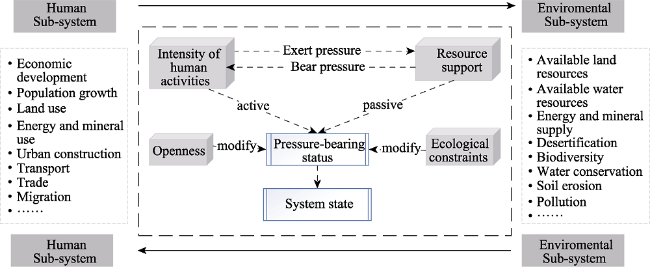
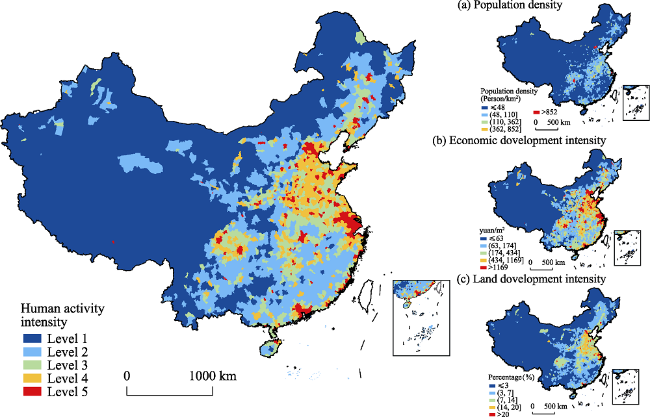
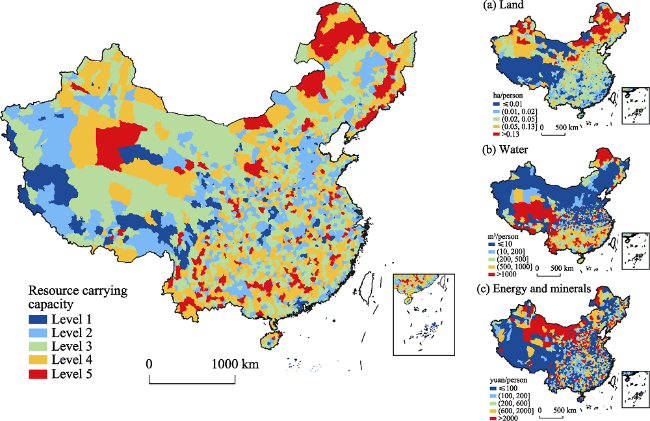
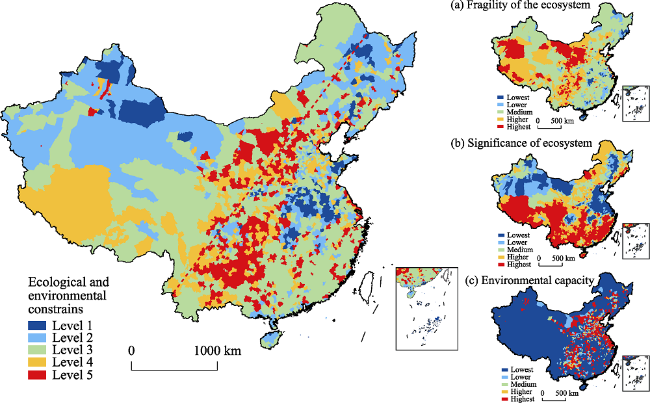
China’s coupled human-environment system (CHES) is assessed here via a systems schema that emphasizes the complex interactions of components and their attributes. In addition to the human and environment components, we identified two other components to evaluate the relationship. The four components are human activity intensity, resource carrying capacity, ecological constraints and system’s openness. Based on their interactions, we derived a cognitive schema for classifying the level of strain or stress of an area. The analysis draws on 11 indicators and 29 sub-indicators including remote sensing data and statistical data that are used to estimate the four components. The findings indicate that human activities are highly intense in a few geographical areas, particularly large urban systems and trade and investment zones on the eastern coastal areas. Nonetheless, these areas are also well-endowed in water resources and fertile soils although urban systems are increasingly stressed from negative pollution externalities. They are also open systems which allow them to bear a higher level of pressure and adjust accordingly. Desertification and soil erosion point to relatively fragile biophysical systems in the west and southwest, but human activities are still relatively less intense compared to their coastal counterparts. As a whole, only 14% of areas may be said to be relatively or highly strained. This however belies another one-third of areas that are currently unstable, and likely to become strained and thereby vulnerable in the near future.
YANG Yu , LI Xiaoyun , DONG Wen , POON P H Jessie , HONG Hui , HE Ze , LIU Yi . Assessing China’s human-environment relationship[J]. Journal of Geographical Sciences, 2019 , 29(8) : 1261 -1282 . DOI: 10.1007/s11442-019-1658-2
Appendix 1 H-E system components and their indicators |
| Main components | Indicators | Sub-indicators | Notes |
|---|---|---|---|
| Human Activities Intensity (HAI) | Population intensity (PI) | Total population of permanent residents (P) | i. Statistical data ii. Use area as the denominator to estimate intensity |
| Economic development intensity (EI) | Economic output (E) | ||
| Land development intensity (LI) | Land area under construction (C) | ||
| Resource Carrying Capacity (RCC) | Land area suitable for construction per capita (L(P)) | Gradient (G), Altitude (A), Area of water (Aw), Area of woodland (Awl), Area of grassland (Ag), Area of desert (Ad), Area of restricted development zones (Ar), Area of forbidden development zones (Af) | i. Intersect G and A to get alternative land, based on remote sensing data ii. Remove Aw, Awl, Ag, Ad, Ar and Af to estimate available land iii. Evaluate per capita land area |
| Available water per capita (W(P)) | Surface water (Wsf), Groundwater (Wg) | i. Sum average annual Wsf and Wg to estimate available water ii. Evaluate per capita available water resources | |
| Energy and mineral resources per capita (M(P)) | Available energy and mineral resource measured in industrial outputs (Ms) | i. Based on ten categories of energy and mineral resources ii. Calculate by output value to eliminate dimensional effects of various energy and mineral resources. | |
| Ecological Constraints (EC) | Fragility of the ecosystem (ECOf) | Soil erosion vulnerability (SE), Stony desertification vulnerability (SD), Desertification vulnerability (D), Soil salinization vulnerability (SS) | Methodology based on references 38 & 39 |
| Significance of the ecosystem (ECOs) | Importance of water conservation (WC), Importance of soil conservation (SC), Importance of wind prevention and sand fixation (WSC), Importance of biodiversity (B), Importance of special ecosystems (SE) | Methodology based on references 38 & 39 | |
| Environmental capacity (ENC) | National standard for environmental performance(ENCs), Environmental quality of the areas based on the presence of typical atmospheric pollutants (ENCp) | Estimated from the difference between ECs and ECc | |
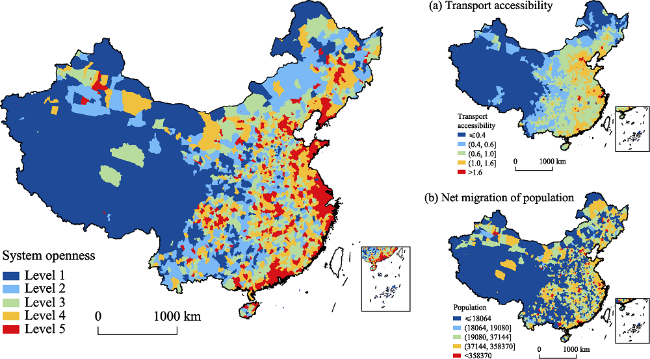
| Openness of the System (SO) | Transport accessibility (T) | Road network density (RD), Grade level of trunk route (LTR), | i. D is a composite index of main transportation infrastructure (rail, highway, fairway, airport and port). Infrastructure grade and distance to trunk routes are used to estimate the road network density. ii. See references of 42&43. |
| Net migration (NMP) | Migration in-flow (IMP) Migration outflow (OMP) | Statistical data |
Figure 1 Components of the process of CHES well-being |
Figure 2 Framework for evaluating the H-E well-being |
Figure 3 Spatial distribution of human activity intensity (2015) |
Table 1 Human activity intensities (HAI) of major urban areas (%) |
| Name of urban agglomerations | Level 1 | Level 2 | Level 3 | Level 4 | Level 5 |
|---|---|---|---|---|---|
| West Coast of the Taiwan Strait | 0 | 46 | 30 | 12 | 12 |
| Beijing-Tianjin-Hebei | 33 | 30 | 9 | 20 | 9 |
| Shandong Peninsula | 0 | 0 | 23 | 63 | 14 |
| Yangtze River Delta | 1 | 18 | 33 | 27 | 21 |
| Pearl River Delta | 2 | 48 | 23 | 9 | 18 |
| Central China Plains | 3 | 25 | 24 | 40 | 7 |
| Chengdu-Chongqing | 32 | 25 | 24 | 16 | 3 |
| Middle Reaches of the Yangtze River | 6 | 44 | 34 | 12 | 4 |
| Hohhot-Baotou-Ordos-Yulin | 68 | 28 | 2 | 1 | 1 |
| Central Guizhou | 29 | 61 | 7 | 3 | 0 |
| Lanzhou-Xining | 66 | 33 | 0 | 1 | 0 |
| Northern Slope of the Tianshan Mountains | 89 | 9 | 2 | 0 | 0 |
| Ningxia-Yellow River | 87 | 9 | 1 | 3 | 0 |
Figure 4 Spatial distribution of resource carrying capacities (2015) |
Figure 5 Geography of ecological constraints (2015) |
Figure 6 Geography of openness (2015) |
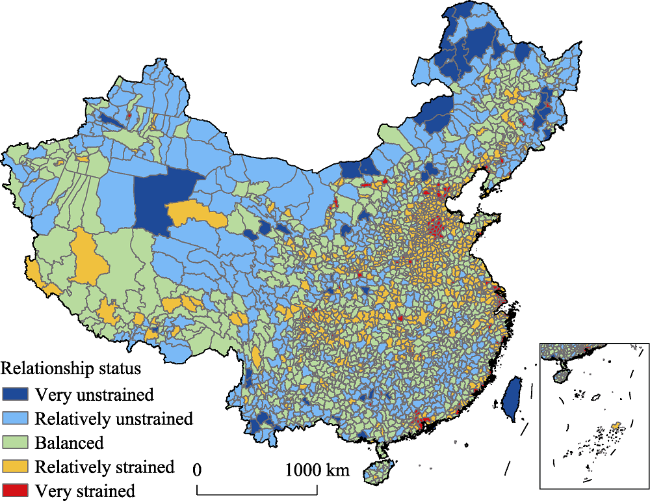
Table 2 H-E integration: distribution of counties |
| Level | Count | Total area (km2) | Proportion (%) |
|---|---|---|---|
| Very unstrained | 42 | 666810 | 7.0 |
| Relatively unstrained | 527 | 3795953 | 39.9 |
| Balanced | 976 | 3671385 | 38.6 |
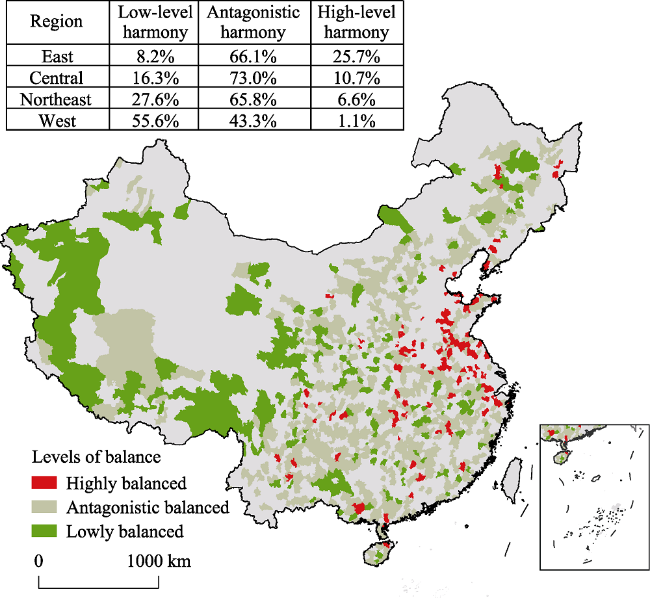
| Highly balanced | 112 | 186130 | 1.96 |
| Antagonistic balanced | 626 | 1865094 | 19.62 |
| Lowly balanced | 238 | 1620161 | 17.04 |
| Relatively strained | 689 | 1266533 | 13.3 |
| Very strained | 153 | 106345 | 1.1 |
| Total | 2387 | 9507026 | 100.0 |
Note: Total area is less than China’s national territorial land area because it excludes Taiwan, Hong Kong, Macao and islands. |
Figure 7 Geography of H-E systems |
Figure 8 Balanced H-E relationships (2015) |
| [1] |
|
| [2] |
|
| [3] |
|
| [4] |
|
| [5] |
|
| [6] |
|
| [7] |
|
| [8] |
|
| [9] |
|
| [10] |
|
| [11] |
|
| [12] |
|
| [13] |
|
| [14] |
|
| [15] |
|
| [16] |
Ministry of Environment Protection of the People’s Republic of China, Chinese Academy of Sciences, 2014. The Remote Sensing Investigation and Evaluation of National Ecological Environment Decade Changing (2000-2010). Beijing: Science Press. (in Chinese)
|
| [17] |
|
| [18] |
|
| [19] |
National Research Council of the National Academies, US ( NRCNA), 2010. Understanding the Changing Planet Strategic Directions for the Geographical Sciences. California: National Academies Press.
|
| [20] |
|
| [21] |
|
| [22] |
|
| [23] |
|
| [24] |
|
| [25] |
|
| [26] |
|
| [27] |
|
| [28] |
|
| [29] |
|
| [30] |
|
| [31] |
|
| [32] |
|
| [33] |
|
| [34] |
|
| [35] |
|
| [36] |
|
| [37] |
|
| [38] |
|
| [39] |
|
/
| 〈 |
|
〉 |
