Research Articles

The evolution of the spatial-temporal patterns of global energy security since the 1990s

  • WANG Qiang 1 ,
  • XU Linglin 1, 2 ,
  • LI Na 3 ,
  • DU Xue 4 ,
  • WU Shidai 1, 5 ,
  • TIAN Lanlan 1 ,
  • WU Chenlu 1
Expand
  • 1. School of Geographical Science, Fujian Normal University, Fuzhou 350007, China
  • 2. Department of Geography, University of Lethbridge, Lethbridge T1K6T5, Canada
  • 3. Collage of Finance and Economics, Jimei University, Xiamen 361021, China
  • 4. Jilin Province City & Town Planning & Designing Institute, Changchun 130012, China
  • 5. College of Tourism, Fujian Normal University, Fuzhou 350108, China

Wang Qiang, Associate Professor, specialized in energy geography, regional sustainable development. E-mail: wangqiang_1102@126.com

Received date: 2018-02-08

  Accepted date: 2018-10-08

  Online published: 2019-12-13

Supported by

National Natural Science Foundation of China(No.41671126)

National Natural Science Foundation of China(No.41171147)

Special Funds for Scientific Research Institutes from Science & Technology Department of Fujian Province(No.2016R1032-5)

Copyright

Copyright reserved © 2019. Office of Journal of Geographical Sciences All articles published represent the opinions of the authors, and do not reflect the official policy of the Chinese Medical Association or the Editorial Board, unless this is clearly specified.

Abstract

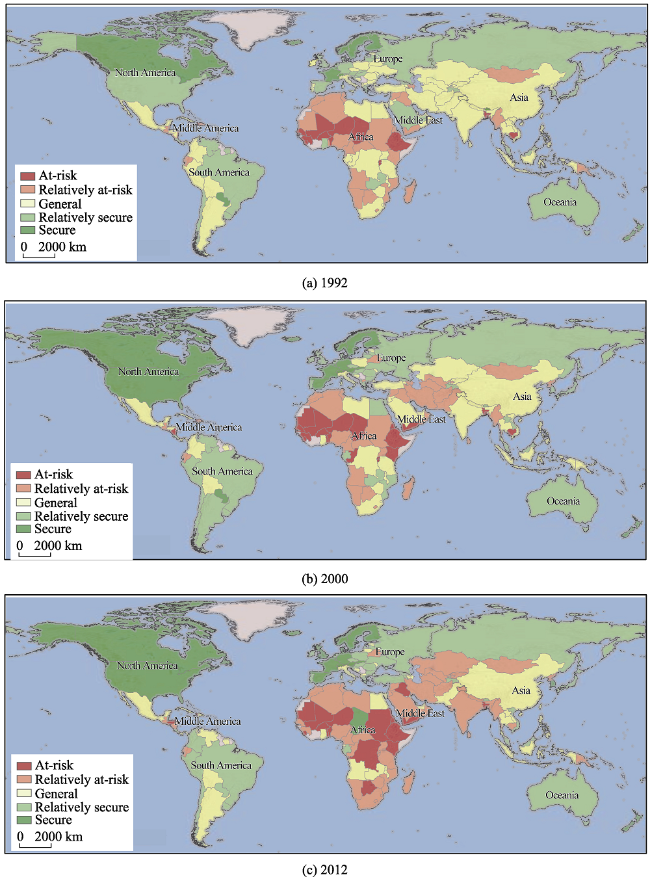
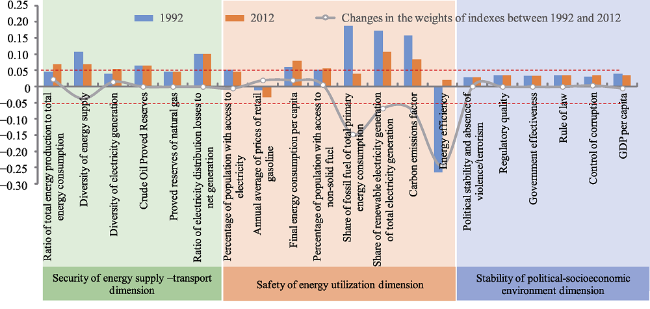
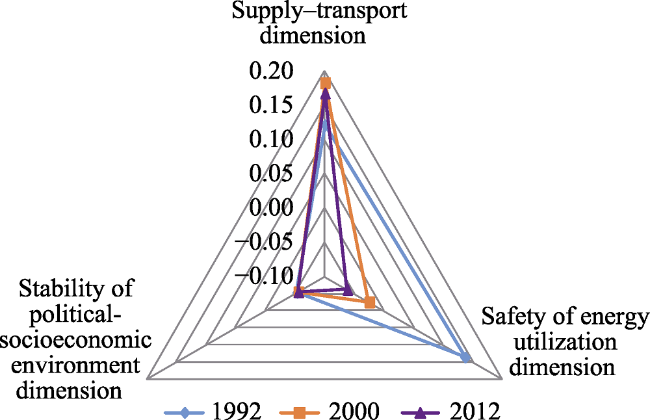
In this study, we developed an energy security evaluation model (ESEM) from three dimensions, energy supply-transport security, safety of energy utilization, and stability of political-socioeconomic environment, based on the integrated application of subjective and objective weight allocation technique. Then the spatial-temporal evolution of global energy security pattern and its driving mechanism was analyzed with the method above, and the results are shown as follows: (1) since the 1990s, the spatial patterns of global energy security have shown a deteriorating trend, with the growth of countries in at-risk type and relatively at-risk type. (2) The spatial distribution of countries with secure energy system shows a strong stability, and these countries are concentrated persistently in Western Europe and North America. The spatial evolution of countries with relatively secure energy system also presents a strong stability, which are mainly distributed in the periphery of the secure ones, namely Central and Southern Europe, South America and Eurasia, while countries with general energy system are mainly distributed in Asia, Africa and Southern Europe, and the spatial-temporal evolution of this type is the main cause for the deterioration of world energy security pattern. Countries with at-risk and relatively at-risk energy system are mainly concentrated in Africa, Asia, the Middle East and Eurasia, rendering spatial extension to the east and south. (3) In the past 20 years, the mechanism for world’s energy security pattern formation gradually transforms from the ‘unitary dimension dominated’ to the ‘binary dimension-dominated’, and the main factors influencing the global energy security pattern become more diverse. (4) In the pattern of world’s energy security, China’s performance on energy security has been the global average since the 1990s, which shows a decreasing trend in safety of energy utilization dimension. Findings in this study can provide a reference for the government in terms of formulating strategic responses and policy options.

Cite this article

WANG Qiang , XU Linglin , LI Na , DU Xue , WU Shidai , TIAN Lanlan , WU Chenlu . The evolution of the spatial-temporal patterns of global energy security since the 1990s[J]. Journal of Geographical Sciences, 2019 , 29(8) : 1245 -1260 . DOI: 10.1007/s11442-019-1657-3

1 Introduction

At present, the intricate geographical relations, economic patterns, and international order with regard to energy among nations and regions have become more turbulent and changeable (Zhang, 2004; Zhang and Guan, 2007; Wang et al., 2011; Wang, 2013; Yang et al., 2013; Yang and Liu, 2013). As a result, the issue of energy security has become a key focus of international research, attracting an increasing amount of attention in the last 40 years (Ang et al., 2015a; Zhao et al., 2015). As early as the beginning of the 1970s, the International Energy Agency (IEA) took the lead in proposing the concept of ‘energy security’, based on the importance of the steady supply and price of crude oil (IEA, 1985), which has since led to a surge in energy security research on a global scale. For example, Bohi and Toman (1996) stated that ‘energy security is the loss of economic welfare that may occur as a result of a change in the price or availability of energy’; Dorian et al. (2006) defined energy security as ‘the sustainable supply of energy ensured at reasonable prices to support the normal operation of industry and the economy’; and similar concepts were also set forth in the research findings of Bielecki (2006), Müller-Kraenner (2008), Chester (2010), Cabalu (2010), and Badea et al. (2011). In addition, because the level of security of the energy supply is also affected by the energy supply chain and infrastructure, scholars have further defined energy security as covering the security of this supply chain and infrastructure (Yergin, 2005; APERC, 2007). However, these types of definitions focus primarily on the single dimension of the security of the energy supply, which is favourable to the assessment of the degree of energy security in energy exporting countries but unfavourable to the objective assessment of the degree of energy security in energy importing countries. In recent years, global climate change and atmospheric pollution have garnered broad attention from the global community, and ecological and environmental sustainability and economic efficiency with regard to energy consumption have become important components of the concept of energy security. For example, Bang (2010) suggested that climate change and energy security were equally important and inseparable propositions and that climate change should be included in any framework for energy security evaluation; similar viewpoints were also proposed in the research of Brown et al. (2011), Sovacool (2012) and Liu et al. (2012a). In addition, the term of energy security has also gradually incorporated the field of energy services. For example, Lesbirel (2004) and Vivoda (2010) suggested that the concept of energy security should consider a nation’s energy service level. Some research institutions and scholars have also integrated existing research results to propose multidimensional definitions of energy security. For example, the Asia Pacific Energy Research Centre (APERC) expanded the definition of energy security to four dimensions by summing up previous studies, namely, availability, accessibility, acceptability, and affordability. Similar concepts were also found in the research results of Narula (2013), Chuang et al. (2013), and others. Moreover, Vivoda (2010) further proposed a seven-dimensional concept involving energy supply, demand management, energy efficiency, the economy, the environment, human security, and military-social culture. In 2011, on the basis of Vivoda’s research, Sovacool (2011) further extended the concept of energy security to 20 dimensions through extensive solicitation of expert opinions. In short, although scholars at home and abroad have extensively discussed the definition of energy security as an important attribute of regional energy systems, a unified and clear academic definition is still lacking.
On the basis of the aforementioned conceptual framework of energy security, scholars at home and abroad have also initiated research on methods to evaluate regional energy security. At present, there are a total of 11 widely applied methods for assessing the degree of regional energy security (Hill, 1973; Stirling, 1994; McFalls Michael, 1997; Gupta, 2008; Kruyt, 2009; Le Coq and Paltseva, 2009; Cabalu, 2010; Liu et al., 2012b; Yu et al., 2014; Kisel, 2016; Radovanović et al., 2016), including the Shannon-Wiener Index (SWI), the Herfindahl-Hirschman Index (HHI), the Supply/Demand Index for the long-term Security of Supply, the Oil Vulnerability Index, the Risky External Energy Supply Index, the Socioeconomic Energy Risk Index, the US Energy Security Risk Index, the Energy Sustainability Index, the Model of Short-term Energy Security (MOSES) adopted by the IEA, the Energy Security Index (ESI) put forward by the European Union (EU) Joint Research Centre, and the Global Energy Architecture Performance Index produced by the World Economic Forum. In addition, to eliminate the linear connexions among the various indices of energy security evaluation, Ang et al. (2015b) applied the banding approach in evaluating changes in Singapore’s energy security level. In examining existing research on evaluation methods and models, it was found that: (1) comprehensive, multidimensional evaluation methods have been applied increasingly broadly in energy security evaluation; (2) the subjective weight distribution method is increasingly applied in the integration of indices and has presently become the most popular method internationally for the evaluation of regional energy security; and (3) there is additional room for research on energy security evaluation methods due to differences in spatial and temporal scales and in the selection of indices.
At present, the evolution of the world’s energy security patterns based on a geographical perspective still awaits further study. In particular, few studies investigate the spatial differences in the energy security of different regions as well as the main elements driving such differences. To this end, 158 countries were selected in this paper, and the changes in the world’s energy patterns were described from a geographical perspective, revealing their driving mechanisms and providing suggestions with regards to China’s scientific planning in terms of energy diplomacy strategies and energy security development policies. In addition, due to limitations with regard to data availability, 1992, 2000, and 2012 were selected as the points in time to perform a comparative analysis of the changes in the world’s energy security patterns and such changes’ influencing factors. Based on the aforementioned research objective, energy security is defined in this paper as the degree and state to which a nation’s energy system guarantees the provision of energy in the way that would not produce unacceptable or irreversible effects on the environment in sufficient quantities and at reasonable prices for the development of society, the economy, and the population within a designated time period and under certain technical and economic conditions.

2 Methods and data sources

In this paper, an energy security evaluation framework was first proposed, then a combined qualitative and quantitative weight assignment method was used to comprehensively integrate all indices, and finally each country’s ESI was obtained.

2.1 Index system

Existing research mainly uses the following seven dimensions to quantitatively evaluate a certain country’s energy security level: energy availability, energy facilities, energy prices, energy efficiency, environmental effects, social effects, and management level. In this paper, on the basis of existing research models and taking into account the availability and continuity of data, the above seven dimensions were merged; that is, an energy security evaluation index system was constructed based on three dimensions - an energy supply-transport security dimension, a usage security dimension, and a social development environment (Table 1).
Table 1 Framework and indicators for the construction of national energy security evolution across the globe
Among these dimensions, the energy supply-transport security dimension was used to describe and evaluate the ability of the regional energy system to respond to imbalance in the energy supply-demand relationship, which can be divided into the two measurements: energy supply and transport. In this paper, the ratio between primary energy production and consumption, the energy supply diversity coefficient, the electric power diversity coefficient, crude oil reserves, and natural gas reserves were selected to quantitatively measure energy supply capability. In that regard, the SWI index was used to infer the energy supply diversity coefficient and the electric power diversity coefficient, based on the following formula:
$SWI=-\sum\limits_{t=\text{1}}^{k}{{{P}_{t}}\ln {{P}_{t}}}$
where k represents the type of energy, and Pt represents the proportion of energy t in the total amount of energy production or electric power generation. In addition, quantitative measurements of the reliability and safety of the electric power grid were carried out to characterise regional energy transport capability internationally (Ang et al., 2015a; 2015b; WEC, 2013). Such measurement indices include the mean time of electric power transmission interruption, the frequency of power transmission interruption, ratio of electricity distribution losses to net generation, and other indices. However, due to limitations with regard to data availability, only the index of ratio of electricity distribution losses to net generation was selected in this paper to characterise regional electric power transport capability.
The safety of energy utilization dimension was used to characterise the comprehensive ability of the regional energy system to satisfy regional production and living energy use demands (WDI, 2015), and it included two aspects: equity of energy service and environmental-economic sustainability. In this paper, four indices - percentage of population with access to electricity, annual average prices of retail gasoline, final energy consumption per capita, and percentage of population with access to non-solid fuel - were selected to quantitatively determine the characteristics of equity of energy service, and four indices - share of fossil fuel of total primary energy consumption, share of renewable electricity generation of total electricity generation, carbon emissions factor, and energy efficiency - were used to quantitatively measure the environmental-economic sustainability of energy consumption. Among the latter, the carbon emissions factor refers to the amount of carbon emissions in a regional unit of energy consumption, and it was used to characterise the degree of environmental impact stemming from regional energy consumption behaviour (Ang et al., 2015a).
In addition, a nation’s social, political, and economic environment significantly affects energy policy-making and investment in the energy sector, which then affect the regional energy security performance. From this perspective, a nation’s social development environment should be included in the energy security evaluation system. To this end, we selected six indices, including political stability and absence of violence/terrorism, regulatory quality, government effectiveness, rule of law, control of corruption, and per capita gross domestic product (GDP), to quantitatively measure the national and regional social development environment. Among these indices, the first five, which characterise political and social stability, originate mainly from the World Development Indicators (WDI, 2015) released by the World Bank and are not repeated here again.

2.2 Integrated approach

The issue of ascertaining the weight of indices in energy security evaluation is an important factor in determining the evaluation’s results (Bohi and Toman, 1996; Zhang and Guan, 2007; Wang, 2013). In the past, many studies applied the subjective weighting approach to integrate the various indices. To improve the credibility of the evaluation results, an attempt was made in this paper to use an approach that combined subjectivity and objectivity of assessment to ascertain index weight - that is, the weight value of each index was determined by using principal component analysis on the basis of the various dimensions and the weights proposed by predecessors - to ultimately amend the objective weights of various indices in accordance with the subjective weights of the measurements.
(1) Data standardisation. In this paper, the standard deviation standardisation method was used to standardise the data, based on the following formula:
${{Z}_{in}}=\frac{{{X}_{in}}-\overset{\text{ }\!\!\_\!\!\text{ }\!\!\_\!\!\text{ }}{\mathop{{{X}_{i}}}}\,}{\sigma ({{X}_{i}})}$
where Zin is the post-standardisation data for index i of nation n; Xin is the original data for index i of nation n; $\overset{\text{ }\!\!\_\!\!\text{ }\!\!\_\!\!\text{ }}{\mathop{{{X}_{i}}}}\,$ is the mean value of index i; and σ(Xi) is the standard deviation of index i. As the three indicators of ratio of electricity distribution losses to net generation, annual average prices of retail gasoline, and carbon emissions factor had a negative effect on energy security, negation processing was performed on these three indices before the data were standardised.
(2) Index integration processing. In contrast to existing studies, in order to overcome the singular disadvantage of subjective and objective weighting, a method combining subjective and objective weighting was proposed in this paper.
First, Kaiser-Meyer-Olkin (KMO) and Bartlett’s spherical tests were used to determine suitability for factor analysis. Based on eigenvalues greater than 1, the common factors (Fj, j = 1, 2, 3, , p, p is the number of common factors) are extracted, and using the following formula, indicator i can be weighed based on objective evidence:
${{W}_{i}}=\sum\limits_{j=1}^{p}{\frac{{{M}_{ij}}}{\sqrt{{{R}_{j}}}}\times \frac{{{C}_{j}}}{C}}$
where Wi is the weight of the i-th index; Mij is the load coefficient of indicator i to the principal component j; Rj and Cj represent the characteristic root and the variance contribution rate of the principal component j, respectively; and C is the cumulative variance contribution rate of the various principal components.
Second, referring to the methods of Ang (2015b) and WEC (2013), the weights of the three dimensions were determined to be 40%, 40%, and 20%, respectively. Furthermore, the weights of the two component layers - supply and transport - within security of energy supply-transport dimension were 30% and 10%, respectively, and the weights of the two component layers of the safety of energy utilization dimension - energy equity and environmental sustainability - were 15% and 25%, respectively. At this point, the weights of the five component layers could be determined; that is, Wd, d=1, 2, 3, 4, 5.
Third, we performed standardisation processing on the indices of each measurement layer, as follows:
$W_{i}^{*}=\frac{{{W}_{i}}}{\sum\limits_{i=1}^{m}{{{W}_{i}}}}\times {{W}_{d}}$
where $W_{i}^{*}$ is the weight of the amended index i; m is the number of indices contained in the component layer d; and Wd is the weight of the component layer d. The amended index weights at various points in time are shown in Table 1.
Finally, nation n’s $ESI_{tot}^{n}$ was obtained via the following formula:
$ESI_{tot}^{n}=\sum\limits_{i=1}^{20}{W_{i}^{*}\times {{Z}_{in}}}$

2.3 Sources of data

The energy data in this paper was sourced from the US Energy Information Administration (EIA, 2014); the data on the economy, population, power-on rate, and non-solid fuel access rate was sourced from the World Bank Open Data (WBOD, 2015). The data on the social development environment originated from the World Development Indicators (WDI, 2015) was issued by the World Bank.

3 Results

Based on the results of factor analysis, the 158 countries were divided into five categories - secure, relatively secure, general, relatively at-risk, and at-risk - on the ArcGIS10.1 platform using the natural breaks classification method (Jenks) (Figure 1).
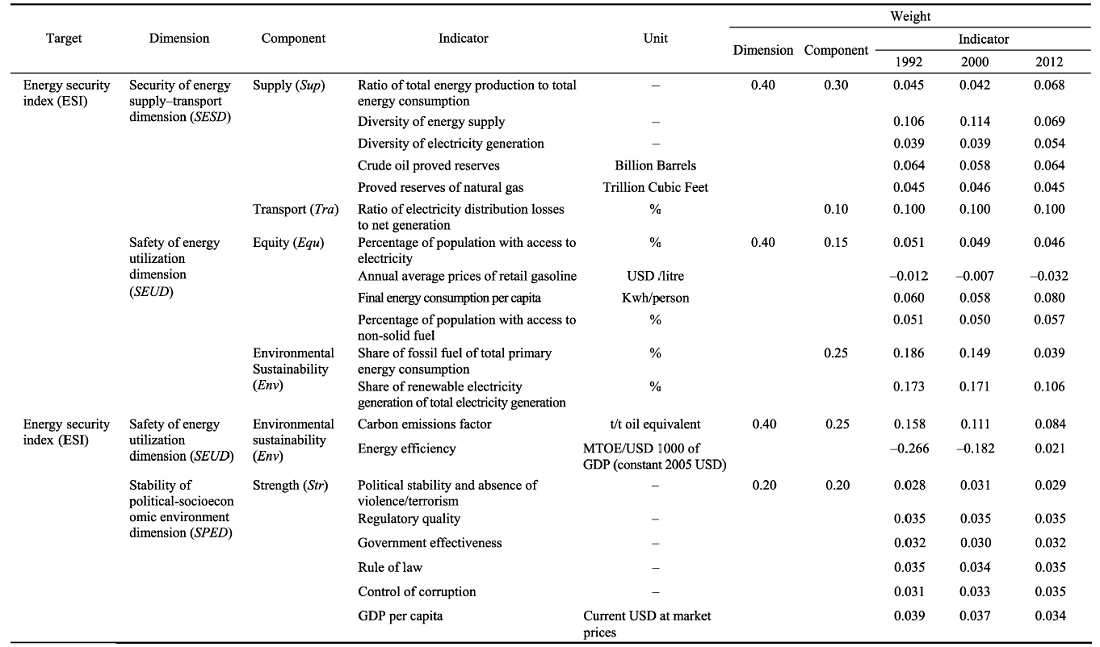
Figure 1 Global energy security patterns in 1992, 2000, and 2012

3.1 Temporal change

Overall, from 1992 to 2012, the number of countries with secure energy system increased from 9 in 1992 to 17 in 2012 globally, the number of countries with relatively secure energy system decreased from 36 to 27, and the number of countries with general energy system decreased from 64 to 37 (Table 2). During the same period, the number of countries with relatively at-risk energy system increased from 36 to 57, and the number of countries with at-risk energy system increased from 13 to 20. In a word, since the 1990s, the spatial patterns of global energy security have shown a deteriorating trend, i.e., the sum of countries with relatively at-risk and at-risk energy system presents a growth trend.
Table 2 Changes of numbers of countries in different types of energy security performance since 1992
Types 1992 2000 2012 Changes of numbers
2012-1992 2000-1992 2012-2000
Secure 9 11 17 8 2 6
Relatively secure 36 34 27 -9 -2 -7
General 64 48 37 -27 -16 -11
Relatively at-risk 36 42 57 21 6 15
At-risk 13 23 20 7 10 -3

3.2 Pattern evolution

Specifically, the spatial patterns of global energy security performance exhibited the following evolution characteristics:
(1) The spatial distribution pattern of countries with secure energy system was more stable, which was concentrated in the economically developed regions of Western Europe and North America. Specifically, against the backdrop of increasing tension in global energy supply and demand, EU countries continued to expand energy import channels and to vigorously develop a low-carbon economy, thereby achieving substantial advancement in their level of regional energy security. The number of countries with secure energy system in Europe increased from 6 in 1992 to 11 in 2012, on average accounting for two-thirds of the total number of energy secure countries globally, becoming a region with a concentrated distribution of secure energy system during the 20-year period. In addition, in contrast to Western European countries, Russia, Qatar, and the United States significantly strengthened their energy supply capabilities, thereby advancing the optimisation of their national energy systems, and they entered the phalanx of most secure countries in 2012.
(2) The spatial pattern of countries with relatively secure energy system also showed strong stability, with such countries mainly distributed in Central and Southern Europe and in South American and Asian regions. In 1992, the total number of countries in this category was 36, of which 13 countries were distributed in Central and Southern Europe, accounting for 36% globally. In addition, 5 countries in both Asia and South America belonged to this category. This pattern basically remained unchanged in 2012. In that year, of the 27 countries with relatively secure energy system, and 16 of them were economically developed countries, and the other 11 were developing countries. Economically developed countries thus accounted for approximately 60% of the total number of countries in this category, and these countries’ performance on the three dimensions was relatively balanced (Figure 2). In contrast to economically developed countries, there were significant differences in the performance of the developing countries on the three dimensions. For example, Paraguay, Brazil, Costa Rica, and Uruguay in South America, and Croatia in Europe performed outstandingly with regard to the safety of energy utilization dimension, which was the main factor that pushed these countries into the relatively secure phalanx; for energy-rich countries such as Malaysia, Saudi Arabia, Venezuela, the United Arab Emirates, Bulgaria, and Chad, a significant upgrade in their energy supply capabilities was the key dimension that improved their overall energy security performance.
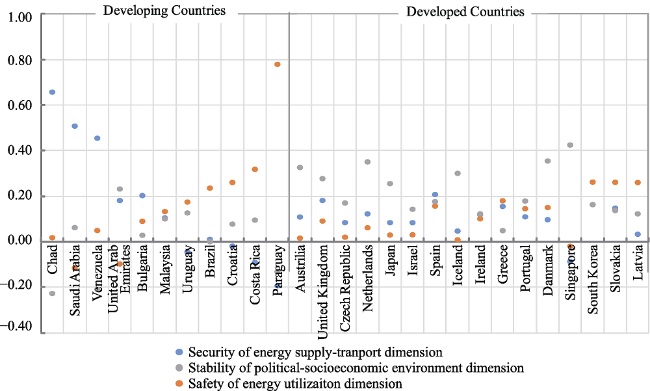
Figure 2 National performances on energy security in the ‘Relatively Secure Group’ in 2012
(3) Countries with general energy system were mainly distributed in Southern Europe, Asia, Africa, and the Eurasian region. In 1992, the total number of countries with general energy system in the four major regions reached 57, accounting for 89% of the total number of countries in this category globally. However, due to the intensified environmental effect of energy consumption in Asian, African and Eurasian countries, obvious changes had occurred in this pattern by 2012. Countries in this category were evenly distributed among regions lacking in economic development in Africa, Asia, Central America, the Eurasian region, the Middle East, and South America, and the total number of countries decreased from 64 in 992 to 37 in 2012. It is worth noting that the general energy systems presented the transitional characteristic, and it is also a key category affecting the overall trend in energy security patterns in the world. Looking at the transformation matrix in energy security categories from 1992 to 2012 (Table 3), there was a net decrease of 27 in the total number of generally secure countries, and the energy security performance of 31 countries worsened. Thus, it has become the category area with the largest number of countries with energy security downgrades.
Table 3 Transformation matrix of energy security types between 1992 and 2012
1992 2012
Secure Relatively secure General Relatively at-risk At-risk Sum
Secure 8 1 0 0 0 9
Relatively secure 8 19 7 2 0 36
General 1 6 26 27 4 64
Relatively at-risk 0 0 4 24 8 36
At risk 0 1 0 4 8 13
Sum 17 27 37 57 20 158
(4) The distribution of countries with relatively at-risk or at-risk energy system was concentrated in Asia, Africa, the Eurasian region, and Central America, and on the whole showed spatial evolution featuring ‘expansion to east and south’. Although Africa contains rich energy resources, due to its backwardness in social development, political unrest, and lack of infrastructure, the levels of overall energy development and utilisation was relatively low, and the security of national energy systems was often in a relatively at-risk or at-risk state. In 1992, of the 36 countries with relatively at-risk energy system and 13 countries with at-risk energy system globally, 21 and 10, respectively, were located in the African region, making it the worst region in the world in terms of energy security. By 2012, the countries in these two groups in the African region had grown to 24, and the number of countries with at-risk energy system had also increased to 14; it remained the worst region in the world in terms of energy security. In addition, Asia, Central America, and the Eurasian region were also the regions with a concentrated distribution of at-risk countries with regard to energy security. Asia was the region with the greatest energy consumption in the world; it also exhibited the greatest contradiction between energy supply and demand in the world and a harsher social development environment. Afghanistan, India, Indonesia, Nepal, Pakistan, the Philippines, and Sri Lanka, were subject to armed conflicts, gaps between rich and poor, ethnic and religious conflicts, and other complex contradictory influences, and their energy security performance continued to deteriorate; by 2012, these countries had gone backwards from the general category to relatively at-risk category. North Korea, due to a more closed political and economic environment, had an at-risk energy system. In Asia, the total number of relatively at-risk countries increased from 2 in 1992 to 10 in 2012, and the total number of countries in at-risk category remained at 2. In the Central American region, the use of fossil and firewood fuel grew rapidly along with continuous economic development, thereby the pressures from energy supply-transport and environmental degradation became intense; at the three research time points, 7 countries entered the ranks of the relatively at-risk, and 2 countries entered the ranks of the at-risk. The Eurasian region is one of the richest regions in the world in terms of proved reserves of petroleum and natural gas resources, but it was affected by old and backwards infrastructure, low energy use efficiency, an unstable social development environment, and the number of countries with relatively at-risk energy system in this region grew from 1 in 1992 to 7 in 2012.

3.3 Driving mechanism analysis

To further explain the mechanism of the world’s energy security patterns, comparative analysis was performed in this paper on the weights of the 20 index factors at the two time nodes of 1992 and 2012. Through the identification of key indices and an analysis of the degree of change in their contributions, the mechanism was preliminarily constructed.
(1) In the last 20 years, nine factors - share of renewable electricity generation of total electricity generation, ratio of electricity distribution losses to net generation, final energy consumption per capita, diversity of energy supply, ratio of total energy production to total energy, crude oil proved reserves, percentage of population with access to non-solid fuel, diversity of electricity generation - were the main driving factors in the formation of the world’s energy security patterns, and the absolute values of their weights were all greater than 0.05 (Figure 3). However, it is worth noting that the impact of energy efficiency on energy security shifted from negative inhibition in 1992 to positive promotion in 2012; this shows that along with the increasing acceleration in the globalisation of primary energy trade in the world since the 1990s and the large-scale development of social industrialisation, urbanisation, and modernisation, the spillover effect on energy security due to technological innovation and industrial upgrades had started to appear in some economically developed countries and regions. In the future, the positive promotion effect of energy efficiency on regional energy security should continue to expand.
Figure 3 Changes in weights of indices affecting national energy security between 1992 and 2012
(2) On the whole, the weight distribution for various indices in 2012 tended to be more balanced than in 1992. During the study period, the magnitude of change was greater in the absolute values of the weights of nine index factors, namely, share of renewable electricity generation of total electricity generation, diversity of energy supply, ratio of total energy production to total energy, crude oil proved reserves, percentage of population with access to non-solid fuel, diversity of electricity generation, energy efficiency, carbon emissions factor, and share of fossil fuel of total primary energy consumption. Among these factors, the absolute values of the weights of four indices - energy efficiency, share of fossil fuel of total primary energy consumption, share of renewable electricity generation of total electricity generation, and carbon emissions factor - showed significant decreases. In 1992, the weights of these four indices were -0.266, 0.186, 0.173, and 0.158, respectively, and their absolute values were far higher than those of the other indices, that indicated that they were the dominant factors affecting the world’s energy security patterns. However, this pattern had changed by 2012; the weights of these four indices changed to 0.021, 0.039, 0.106, and 0.084, respectively, and the gap between the weights of these four factors and those of other key factors narrowed.
(3) From the distribution of the absolute values of the index weights, we can recognize the contribution and the degree of influence of each index to a country’s overall level of energy security. In 1992, the sum of the absolute weights of the eight indices in the safety of energy utilization dimension was 0.957, which was far higher than that of the other two dimensions; it was the dominant mechanism affecting the formation of the world’s energy security patterns (Figure 4). By 2012, along with significant decreases in the absolute values of the weights of the four indices, share of fuel of total primary energy consumption, share of renewable electricity generation of total electricity generation, carbon emissions factor, and energy efficiency, significant changes had occurred in this driving mechanism, which gradually shifted from a ‘one-dimensional dominant type’ to a ‘two-dimensional composite type’.
Figure 4 Changes in the sum of absolute values of weights of indices between 1990 and 2012

3.4 Implications for China’s energy security policies

Since the 1990s, China’s energy security performance has remained at general level in the world (Figure 5) and has shown a continuously decreasing trend in the safety of energy utilization dimension; at the same time, environmental sustainability problems in the course of energy consumption have become increasingly prominent. In addition, although China’s energy supply-transport security performance continues to improve, it is undeniable that the degree of foreign dependence on mainly fossil energy has increased. For example, in 2012, China’s annual petroleum consumption capacity reached 518 million t, net petroleum imports were 308 million t, and the degree of foreign dependence reached 59.5%, far exceeding the security warning line. One can see that for a long period of time in the future, China’s energy security situation may remain quite grim. To address this, the following policy implications are proposed in this paper to provide a reference for the government in terms of formulating strategic responses and policy options.
Figure 5 China’s performances on energy security in 1992, 2000 and 2012
(1) Keep a foothold in China’s realities, accelerate the advancement of supply-side structural reform in the energy field and structural optimisation of the industrial economy, improve energy consumption efficiency, and reduce the effect on environment. Based on the research above, safety of energy utilization is the dimension with the greatest impact on a country’s overall performance in energy security; at the same time, it is also the greatest constraint on China’s position with regard to the world’s energy security patterns. Moreover, the key to improving the safety of energy utilization in China is energy savings through structure and not energy savings through technology. The proportion of fossil energy has long been relatively large in the national energy consumption; its structural proportion grew from 75.71% in 1992 to 87.9% in 2012, far higher than the world average (81.1%), and the share of renewable electricity generation of total electricity generation was 19.1%, which was slightly lower than the world average (20.9%) and only increased by one percent since 1992. The proportion of renewable energy in the energy structure awaits further improvement. In addition, China’s economy is in a stage of rapid industrialisation towards heavy industry with accelerated growth in industrial energy demands and a higher degree of energy dependence. In this regard, China should take energy-supply structure and industrial structure as a focus to promote the optimisation of energy systems and the sustainable development of the industrial economy: on one hand, the government should introduce policies on the mandatory purchase of energy-saving products, spur society to produce and use energy-saving products, and encourage consumers to purchase power products from renewable energy resources; on the other hand, the government should actively guide the optimisation and adjustment of the industrial structure, restrain the excessively rapid growth of high-energy-consumption and high-emissions industries, accelerate the elimination of backwards production capacity, promote the reform and upgrade of traditional industries, and increase the proportion of service industries and strategic emerging industries in the national economy.
(2) With a view to the international energy market, to draw support from the Belt and Road Initiatives to create ‘win-win’ situations in which resources are supplied continuously and steadily with the rapid development of a foreign economy. At present, oil producing countries in Middle East are China’s foremost source of crude oil imports. The amount of crude oil imported from that region accounted for 50% of the total amount of imported crude oil, but the conflicts breaking out continuously in this region have increased the potential risk to the continuous and steady export of crude oil to China. Thus, it is essential for China to participate in international cooperation with regard to energy supply security and establish friendly dialogue mechanisms with the world’s energy exporting countries. Along with the thorough promotion of the Belt and Road Initiatives, the energy trade and industrial cooperation between China and energy-rich countries in Central Asia, Russia, Africa and other regions will usher in a brand-new era. In this respect, the Chinese government should improve the strategic reserve system for energy resources, implement the strategy of ‘going out and getting it back’, actively join international organisations or establish strategic cooperative relationships, deepen friendly and cooperative relations with these countries, speed up the exploration and development of overseas energy resources, and promote international energy trade and industrial cooperation by fostering a group of multinational corporations with international competitiveness, make efforts to enhance China’s position in the global energy industrial value chain, and participate in the division of labour for international industries at a higher level.

4 Conclusions and discussion

Based on energy supply, energy transport, energy utilization, and social development data for 158 countries in 1992, 2000 and 2012, the evolution characteristics of the world’s energy security patterns, mechanisms, and their implications for China’s energy policies were systematically analysed in this paper, with the following results.
(1) Since the 1990s, the spatial patterns of global energy security have shown a deteriorating trend, i.e., the sum of countries with relatively at-risk and at-risk energy system presents a growth trend.
(2) From the point of spatial evolution, the spatial distribution of countries with secure energy system has strong stability, and these countries are concentrated persistently in Western Europe and North America. The spatial evolution of countries with relatively secure energy system also presents a strong stability, which are mainly distributed in the periphery of the secure ones, namely Central and Southern Europe, South America and Eurasia, while countries with general energy system are mainly distributed in Asia, Africa and Southern Europe, and the spatial-temporal evolution of this type is the main cause for the deterioration of world energy security pattern. Countries with at-risk and relatively at-risk energy system are mainly concentrated in Africa, Asia, the Middle East, Europe and Asia, rendering spatial extension to the east and south.
(3) Mechanism of the world’s energy security patterns has shifted from a ‘one-dimensional dominant type’ to a ‘two-dimensional composite type’, and the factors affecting the level of regional energy security have become increasingly diverse.
(4) With regard to China, its energy security situation has remained at the general level in the world since the 1990s, nevertheless showing a continuously declining trend in the safety of energy utilization dimension, indicating that environmental sustainability problems in the course of energy consumption have become increasingly prominent.
The issue of energy security is a core area in the research on the sustainable development of society, the economy and the eco-environment in various countries in the world. Faced with changes in the world’s energy security patterns, clear recognition of national energy security characteristics and determining possible changes in international energy patterns have become an important basis and reference for all countries at present in planning energy strategies, diplomatic strategies, development strategies, and security strategies with forward-looking strategic thinking. Based on the foundation of existing research and keeping a foothold in the geographical perspective, this paper focused on research scale and methods to explore the application of subjective and objective weighting methods in studying the evolution of the world’s energy security patterns. However, due to data continuity and availability limitations, the three time nodes of 1992, 2000, and 2012 were selected to depict world energy security patterns, and the objective depiction of the formation and evolution of the world’s energy patterns is a complex project. In this regard, there is still much room for improvement in the construction of the evaluation system in this paper and for innovation with respect to its integration methods. In the future, there is still a need for added support from more long-term and continuous data accumulation and methodological innovation in striving to conduct research with more academic value.
[1]
Ang B W, Choong W L, Ng T S , 2015 a. A framework for evaluating Singapore’s energy security. Applied Energy, 148:314-325.

[2]
Ang B W, Choong W L, Ng T S , 2015 b. Energy security: Definitions, dimensions and indexes. Renewable & Sustainable Energy Reviews, 42:1077-1093.

[3]
Asia Pacific Energy Research Centre (APERC), 2007. A quest for energy decurity in the 21st century [R/OL], .

[4]
Badea A C, Tarantola S, Bolado R , 2011. Composite indicators for security of energy supply using ordered weighted averaging. Reliability Engineering & System Safety, 6(6):651-62.

[5]
Bang G , 2010. Energy security and climate change concerns: Triggers for energy policy change in the United States? Energy Policy, 38(4):1645-1653.

[6]
Bielecki J , 2002. Energy security: Is the wolf at the door? The Quarterly Review of Economics and Finance, 42:235-250.

[7]
Bohi D R, Toman M A , 1996. The Economics of Energy Security. Boston: Kluwer Academic Publishers.

[8]
Brown M A, Dworkin M , 2011. The environmental dimension of energy security. In: Sovacool B (ed.). The Routledge Handbook of Energy Security. London: Routledge.

[9]
Cabalu H , 2010. Indicators of security of natural gas supply in Asia. Energy Policy, 38(1):218-225.

[10]
Chester L , 2010. Conceptualising energy security and making explicit its polysemic nature. Energy Policy, 38(2):887-895.

[11]
Chuang M C, Ma H W , 2013. An assessment of Taiwan’s energy policy using multidimensional energy security indicators. Renewable & Sustainable Energy Reviews, 17:301-311.

[12]
Dorian J P, Franssen H T, Simbeck D R , 2006. Global challenges in energy. Energy Policy, 34(15):1984-1991.

[13]
Ghao C F, Liu G Y, Chen B , 2015. Advances in theories and methods of enemy forecasting and early warning. Acta Ecologica Sinica, 35(7):2399-2413. (in Chinese)

[14]
Gupta E , 2008. Oil vulnerability index of oil-importing countries . Energy Policy, 36(3):1195-1211.

[15]
Helen C , 2010. Indicators of security of natural gas supply in Asia . Energy Policy, 38(1):218-225.

[16]
Hill M , 1973. Diversity and evenness: A unifying notation and its consequences. Ecology, 54(2):427-432.

[17]
International Energy Agency ( IEA), 1985. Energy Technology Policy. Paris: OECD/ IEA.

[18]
Kisel E, Hamburg A, Härm M et al., 2016. Concept for energy security matrix. Energy Policy, 95:1-9.

[19]
Kruyt B, van Vuuren D P, de Vries H J M et al., 2009. Indicators for energy security. Energy Policy, 37(6):2166-2181.

[20]
Le Coq C, Paltseva E , 2009. Measuring the security of external energy supply in the European Union. Energy Policy, 37(11):4474-4481.

[21]
Lesbirel S H , 2004. Diversification and energy security risks: The Japanese case. Japanese Journal of Political Science, 5(1):1-22.

[22]
Liu L, Shen L, Gao T et al., 2012 a. Evaluation and spatial-temporal evolution of energy security in China. Acta Geographica Sinica, 67(12):1634-1644. (in Chinese)

[23]
Liu L, Shen L, Liu X , 2012 b. Theories, methods and progress of energy security research. Progress in Geography, 31(4):403-411. (in Chinese)

[24]
McFalls M S , 1997. The role and assessment of classical market power in joint venture analysis. Antitrust Law Journal, 66:651-735.

[25]
Müller-Kraenner S , 2008. Energy Security: Re-measuring the World. London: Earthscan Publications.

[26]
Narula K , 2013. Is sustainable energy security of India increasing or decreasing? International Journal of Sustainable Energy, 33:1054-1075.

[27]
Radovanović M, Filipović S, Pavlović D , 2017. Energy security measurement: A sustainable approach. Renewable & Sustainable Energy Reviews, 68:1020-1032.

[28]
Sovacool B K , 2011. Evaluating energy security in the Asia pacific: Towards a more comprehensive approach. Energy Policy, 39(11):7472-7479.

[29]
Sovacool M J P B K , 2012. The importance of scale to energy security. Journal of Integrative Environmental Sciences, 9(3):167-180.

[30]
Stirling A , 1994. Diversity and ignorance in electricity supply investment: Addressing the solution rather than the problem. Energy Policy, 22(3):195-216.

[31]
The World Bank. World Bank Open Data (WBOD). [accessed 15.04.2017].

[32]
The World Bank. World Development Indicators ( WDI). .

[33]
U.S. Energy Information Administration (EIA). International Energy Statistics. .

[34]
Vivoda V , 2010. Evaluating energy security in the Asia-Pacific region: A novel methodological approach. Energy Policy, 38(9):5258-5263.

[35]
Wang H Y , 2013. Changes in world energy pattern and their influence on China’s energy security. Journal of Shanghai University (Social Sciences), 30(6):1-11. (in Chinese)

[36]
Wang Q, Zheng Y, Wu S D et al., 2011. Mechanism of energy efficiency response to industrial restructuring and energy consumption structure change. Acta Geographica Sinica, 66(6):741-749. (in Chinese)

[37]
World Energy Council (WEC), 2013. Energy Sustainability Index [Data File]. .

[38]
Yang Y, Liu Y, Jin F J , 2013. Distribution of world oil refining capacity and its evolution based on different regional scales. Word Regional Studies, 22(3):1-9. (in Chinese)

[39]
Yang Y, Liu Y , 2013. Progress and prospect of world energy geography in China. Progress in Geography, 32(5):818-830. (in Chinese)

[40]
Yergin D , 2005. Energy security and markets. In: Kalicki J H, Goldwyn D L (eds.). Energy and Security: Toward a New Foreign Policy Strategy. Washington: Woodrow Wilson Press.

[41]
Yu J, Wang X Q, Zhang L , 2014. 2AST Conceptual framework and integrated evaluation of energy security . Journal of China University of Geosciences (Social Sciences Edition), 14(3):70-77. (in Chinese)

[42]
Zhang L , 2004. Mineral Resources Exploitation and National Industrialization. Beijing: The Commercial Press. (in Chinese)

[43]
Zhang Y Y, Guan Q Y , 2007. World energy patterns and energy security of China. World Economy, ( 9):17-30.

Outlines

/