The impact of land use and cover change on soil organic carbon and total nitrogen storage in the Heihe River Basin: A meta-analysis

  • TONG Jinhui ,
  • HU Jinhua ,
  • LU Zheng ,
  • SUN Haoran ,
  • YANG Xiaofan , *
Expand
  • State Key Laboratory of Earth Surface Processes and Resource Ecology, Faculty of Geographical Science, Beijing Normal University, Beijing 100875, China
*Yang Xiaofan, PhD and Professor, specialized in subsurface hydrology. E-mail:

Tong Jinhui, PhD, E-mail: jhtong@mail.bnu.edu.cn

Received date: 2018-10-23

  Accepted date: 2019-02-28

  Online published: 2019-12-11

Supported by

The Strategic Priority Research Program of Chinese Academy of Sciences(No.XDA20100104)

Copyright

Copyright reserved © 2019. Office of Journal of Geographical Sciences All articles published represent the opinions of the authors, and do not reflect the official policy of the Chinese Medical Association or the Editorial Board, unless this is clearly specified.

Abstract

Land use and cover change (LUCC) is an important indicator of the human-earth system under climate/environmental change, which also serves as a key impact factor of carbon balance, and a major source/sink of soil carbon cycles. The Heihe River Basin (HRB) is known as a typical ecologically fragile area in the arid/semi-arid regions of northwestern China, which makes it more sensitive to the LUCC. However, its sensitivity varies in a broad range of controlling factors, such as soil layers, LUCCs and calculation methods (e.g. the fixed depth method, FD, and the equivalent mass method, ESM). In this study, we performed a meta-analysis to assess the response of soil organic carbon (SOC) and total nitrogen (TN) storage to the LUCC as well as method bias based on 383 sets of SOC data and 148 sets of TN data from the HRB. We first evaluated the calculation methods and found that based on the FD method, the LUCC caused SOC and TN storage to decrease by 17.39% and 14.27%, respectively; while the losses estimated using the ESM method were 19.31% and 18.52%, respectively. The deviations between two methods were mainly due to the fact that the FD method ignores the heterogeneity of soil bulk density (BD), which may underestimate the results subsequently. We then analyzed the response of SOC and TN storage to various types of the LUCC. In particular, when woodland and grassland were converted into cultivated land or other land types, SOC and TN suffered from heavy losses, while other LUCCs had minor influences. Finally, we showed that increasing the depth of the soil layers would reduce the losses of SOC and TN storage. In summary, we identified a series of controlling factors (e.g. soil layer, the LUCC and calculation method) to evaluate the impact of the LUCC on SOC and TN storage in the HRB, which should be considered in future research.

Cite this article

TONG Jinhui , HU Jinhua , LU Zheng , SUN Haoran , YANG Xiaofan . The impact of land use and cover change on soil organic carbon and total nitrogen storage in the Heihe River Basin: A meta-analysis[J]. Journal of Geographical Sciences, 2019 , 29(9) : 1578 -1594 . DOI: 10.1007/s11442-019-1678-y

1 Introduction

Land use and land cover change (LUCC) is the most important indicator for quantifying dynamic changes in natural environment under perturbations such as extreme events and human activities (Mendoza et al., 2011; Gerard et al., 2010). The LUCC may reshape the original structure and balance of the ecosystem, causing severe losses of soil organic carbon (SOC) and total nitrogen (TN) (Ali, 2006; Covaleda et al., 2011; Gamboa and Galicia, 2011; Shirvani et al., 2010; Lal, 2005). Studies in other regions have also shown that changes in land use patterns will change soil carbon and nitrogen storage in local areas (Yang et al., 2017). Previous studies have clearly shown that land use changes (especially forest destruction) will directly change soil carbon pool, thus causing environmental degradation and global climate change (Harris et al., 2012; Mukhopadhyay et al., 2016; Wiesmeier et al., 2015). Houghton et al. (2012) showed that the amount of SOC loss due to the LUCC was as high as 12.5% of the anthropogenic carbon emissions from 1990 to 2010. In parallel, land degradation caused by SOC loss may damage ecosystem structure and function (Costantini et al., 2016) and directly influence the hydrological and biogeochemical cycles in the earth system (García Díaz et al., 2016; Sonneveld et al., 2016). In summary, the changes in SOC and TN due to the LUCC are critical for maintaining ecosystem sustainability, which should be evaluated scientifically.
The LUCC inevitably has major influence on SOC and TN storage, however, which varies in a wide range of conditions driven by specific controlling factors. Previous studies demonstrated that there exists obvious bias in characterizing the impact of the LUCC on SOC and TN storage if only sampling in selected soil layers (Hu et al., 2016). For example, sampling from shallow soil layers are still widely adopted today (Wei et al., 2014; Olson and Al-Kaisi, 2015; Jiang et al., 2015; Niu et al., 2013), including those completely ignored the response of SOC and TN to the LUCC in deeper soil layers (Lozano-García and Parras Alcántara, 2014), which, however, may not be sufficient subsequently accurate to analyze the effects of the LUCC on SOC and TN storage. Therefore, it is necessary to evaluate the impact of soil layers on the SOC and TN response to LUCC. In addition, deviations caused by the selection of the calculation methods should attract more attention. The fixed depth (FD) and the equivalent mass (ESM) methods are two well-acknowledged methods for estimating SOC and TN storage. Typically, SOC or TN calculated based on the FD method are quantified by soil bulk density (BD), soil depth and concentration. Due to the approximate estimation of soil properties (such as density), the FD method may overestimate the soil organic contents (Du et al., 2017). Both the LUCC and soil depth can lead to BD changes, which requires more precise methods (e.g. ESM) to capture such behaviors (Lee et al., 2009; Don et al., 2011).
The Heihe River Basin (HRB) is located in the arid and semi-arid regions of northwestern China, which plays an irreplaceable role in maintaining ecological and environmental functions in the area (Song et al., 2017). However, in recent years, land degradation/desertification has become a serious environmental crisis that plagues the regional development and sustainability. Since the late 1980s, the land use has been significantly reduced in the HRB, the area of forest land and grassland, switching to cultivated land and construction land (Qi and Luo, 2006). Such reformation directly leads to the lapse of nutrients such as SOC and TN and land degradation (Qi et al., 2007; Qi and Luo, 2007; Wang et al., 2007, 2011). Few studies have focused on the impact of the LUCC on SOC and TN in the HRB, however, if not all, were mostly based on specific sampling points, under certain environmental and soil conditions (Lv et al., 2014; Li et al., 2017). In addition, the selection of the soil layers and experimental methods were not consistent in those studies, which may further influence the associated analysis. It would thus be interesting to integrate independent studies and perform further analysis to investigate the overall response of SOC and TN to the LUCC in the HRB.
As a powerful statistical method for integrating multiple studies based on published literature and data, meta-analysis has been successfully applied to assess the impact of the LUCC on SOC and TN storage (Powlson et al., 2016; Shi et al., 2013, 2016; Virto et al., 2012). Powlson et al. (2016) conducted a meta-analysis of changes in SOC storage under conservation tillage practices in two tropical regions, the Indo-Gangetic plain and sub-Saharan Africa, seeking to mitigate climate pressures by increasing the soil C pool. Shi et al. (2013) believed that afforestation can alleviate climate pressure, but the response of C pool in deep soil to afforestation is still unclear, therefore, conducted a preliminary discussion on the C sink response of deep soil by searching relevant literatures and followed by worldwide study (Shi et al., 2016). Virto et al. (2012) conducted a meta-analysis of changes in soil C storage under different tillage practices and different C input levels through 92 paired studies. In summary, meta-analysis provides a comprehensive way by obtaining large amounts of data, which helps explain the general trend of SOC and TN response to the LUCC and compensates for the deficiencies of individual studies. However, insufficient or missing data may lead to a series of uncertainties. Therefore, it is necessary to investigate the effect of the LUCC on both SOC and TN in an integrated way. In particular, to our best knowledge, such large-scale integrated analysis has not been conducted in the HRB related to the LUCC. In this study, a meta-analysis was performed based on literature data to quantify the effects of the LUCC on SOC and TN storage in the HRB. The objectives include (1) evaluation of the calculation methods (FD and ESM) and (2) quantitatively analyzing the impact of specific LUCC and soil layers on SOC and TN storage in the HRB.

2 Materials and methods

2.1 Data collection

Based on a comprehensive search through CAB Abstract, CNKI, Elsevier and China Knowledge Resources Comprehensive Database, we compiled a series of peer-reviewed literature with the subject of the impact of the LUCC on SOC and TN storage in the HRB from 2000 to 2018 (Table 1). We excluded studies before the year 2000 because the land use pattern did not change much before the new millennium. Selected keywords used for literature search are listed as follows: “The Heihe River Basin”, “Land Use Change”, “Soil Organic Carbon”, “Total Nitrogen”, “Soil Quality”, “Soil Nutrient”, and “Soil Physical and Chemical Properties”. In addition, each study was further screened for integrity, relevance and scientific merits based on the following steps: (1) Pick a proper category for each study: experiment group or control group; (2) Make sure all studies are independent and published after 2000; (3) The sampling depth was more than 10 cm (the minimum soil stratification in this study); (4) In several studies, the change in land use patterns was not obvious. Therefore, such studies conducted special experiments with less disturbance intensity (usually forest land and grassland) would be considered as the control group; (5) The publication should explicitly present results on SOC or TN concentrations. If only soil organic matter (SOM) concentrations were recorded in the study, a conversion factor of 0.58 was used to convertthe data to SOC concentration (Pan et al., 2004). In addition, if the reported data was expressed graphically, all the data were extracted using the Get Data Graph Digitizer (Version 2.22, Russian Federation).
Table 1 Sources and conditions of the dataset used in this study
Number Author Year Data points Journal
SOC TN
1 Cao J J, Shang Z H, Guo R Y et al. 2011 4 4 Journal of Arid Land Resources and Environment
2 Chang Z Q, Pei W, Feng Q et al. 2011 6 6 Mountain Research
3 Gao H N, Li C X, Sun X M et al. 2016 6 0 Acta Prataculturae Sinica
4 Jiang P, Cheng L, Li M et al. 2015 4 4 Science of the Total Environment
5 Li D, Gao G, Lü Y et al. 2016 18 0 Catena
6 Li F R, Feng Q, Liu J L et al. 2013 10 10 Ecosystems
7 Li Y L 2008 12 12 Lanzhou University (Master Thesis)
8 Lv Y H, Ma Z M, Zhao Z J et al. 2014 16 16 Environmental Management
9 Ma S H, Mou C C, Guo H et al. 2018 27 0 Journal of Glaciology and Geocryology
10 Ma Z M, Lv Y H, Sun F Y et al. 2013 15 15 Acta Ecologica Sinica
11 Niu R X, Zhao X Y, Liu J L et al. 2013 16 0 Polish Journal of Ecology
12 Qin J H, Zhang Y, Zhao Y C et al. 2013 32 0 Agricultural Research in the Arid Areas
13 Qin J H, Zhang Y, Zhao Y C et al. 2014 18 0 Journal of Glaciology and Geocryology
14 Shang Z, Cao J, Guo R et al. 2012 1 2 Journal of Soils & Sediments
15 Su Y Z, Yang R, Yang X et al. 2012 8 8 Scientia Agricultura Sinica
16 Su Y Z, Liu W J, Yang R et al. 2009 12 10 Acta Ecologica Sinica
17 Su Y H 2007 6 8 Northwest Institute of Eco-Environment and Resources (Doctoral Dissertation)
18 Sun M M, Wang X F, Ma M G et al. 2016 24 0 Acta Pedologica Sinica
19 Wang C, Zhao C Y, Xu Z L et al. 2013 9 0 Journal of Arid Land
20 Wang F, Xiao H L, Su Y Z et al. 2010 2 6 Journal of Arid Land Resources and Environment
21 Wang G, Ma H, Qian J et al. 2010 12 0 Soil Use and Management
22 Wang G, Ma H, Qian J et al. 2012 6 6 Journal of Desert Research
23 Wang F, Meng H F, Hou D M et al. 2015 36 0 Pratacultural Science
24 Wang F, Xiao H L, Su Y Z et al. 2011 1 1 Journal of Desert Research
25 Yong Z S 2007 9 0 Soil and Tillage Research
26 Zhao R F, Zhang L H, Zhao H L et al. 2013 8 8 Scientia Geographica Sinica
27 Zhang J H, Li G D, Nan Z R 2012 18 30 Acta Ecologica Sinica
28 Zhang J H, Li G D, Nan Z R 2012 15 0 Journal of Natural Resources
29 Zhang J H, Li G D, Wang Y S 2012 2 2 Chinese Journal of Applied Ecology
30 Zhao J M, Liu C Z, Zhang D G 2012 21 0 Agricultural Research in the Arid Areas
31 Zhu P, Chen R S, Song Y X et al. 2017 9 0 Acta Ecologica Sinica
As a result, a total of 31 scientific journal articles were screened (Table 1), with 383 sets of SOC data and 148 sets of TN data extracted/downloaded, loading into a complete data base for further analysis. All the sampling sites/points summarized from the database are marked in Figure 1. According to the land use status classification criteria issued (GB/T21010- 2017) by the Ministry of Land and Resources on November 1, 2017, the land cover in the HRB was categorized into forest land (natural forest land and plantation land), shrub, grassland (including natural grassland, artificial grassland and abandoned farmland), and agricultural land (including dry land, paddy fields), gardens (including vegetable gardens and orchards) and other land (including desert, Gobi, bare land, saline-alkali land).
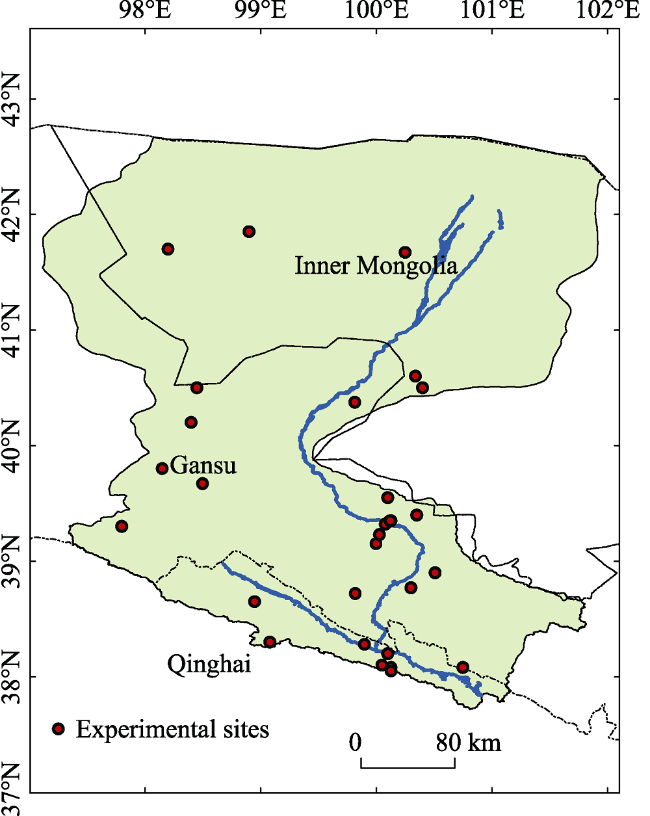
Figure 1 Study site and the locations of the land use change experimental sites (marked with red dots) in the Heihe River Basin
To explain the changes in SOC storage affected by the LUCC, the associated field measurements were partitioned into three subcategories corresponding to: (1) different study sites (upstream, midstream and downstream of the HRB); (2) response of SOC and TN storage to land use change within multiple soil layers (0-10, 10-20, 20- 40, 40-60, 60-80 and 80-100 cm); (3) the relationship between other physical and chemical properties of soil and SOC/TN storage.

2.2 SOC and TN estimation and statistical analysis

Both the fixed-depth (FD) and equivalent soil mass (ESM) methods are commonly adopted to estimate SOC and TN storage. Most of the SOC or TN storage results in previous studies were based on the FD. The current study aims to apply the ESM method to recalculate the SOC and TN storage for comparison purposes. According to the principles of the ESM method introduced in Li et al. (2009), given non-uniform distribution of SOC and TN within soil profile, the treatment with the lightest soil mass was designated as the equivalent soil mass.
$FDstoc{{k}_{SOC~or~TN}}=Co{{n}_{SOC~or~TN}}*Soi{{l}_{BD}}*h*{{10}^{-1}}$
$ESMstoc{{k}_{SOC~or~TN}}=FDstoc{{k}_{SOC~or~TN}}-{{M}_{ex}}*\frac{{{C}_{sn}}}{1000}$
${{M}_{ex}}=\underset{1}{\overset{n}{\mathop \sum }}\,Soi{{l}_{BD}}*100-{{M}_{ref}}$
where $FDstoc{{k}_{SOC~or~TN}}$ and $ESMstoc{{k}_{SOC~or~TN}}$ represent the SOC or TN storage estimated based on the FD and ESM methods, respectively; $Co{{n}_{SOC~or~TN}}$ indicates the concentration of SOC or TN;$Soi{{l}_{BD}}$ and h represent soil bulk density and soil thickness, respectively; Mref is the lightest soil mass as the reference mass, and Mex is the excess soil mass.
However, not all the data in the literature are ideal. If, for example, SoilBD is missing, it is empirically estimated using the following nonlinear correlation (Song et al., 2005):
$Soi{{l}_{BD}}=1.3770\text{*Exp}\left( -0.0048\text{*}Co{{n}_{SOC}} \right)$
The responses of SOC and TN storage to the LUCC depend on the soil depths, however, the classifications of soil layers are inconsistent among studies. In order to make SOC and TN storage change comparable at the same sample depth, it is necessary to adjust the storage variation of the irregular sample depth (h) to a storage change of 20 cm close to the top of the sample (Yang et al., 2011; Shi et al., 2016):
$Y=1-{{\beta }^{h}}$
${{C}_{20}}=\frac{1-{{\beta }^{20}}}{1-{{\beta }^{h}}}*{{C}_{h}}$
where Y is the cumulative ratio of SOC or TN storage from the soil surface to the depth h (cm); β is the relative reduction rate of SOC or TN within the soil layer (SOC for 0.9928, TN for 0.983) (Jobbágy and Jackson 2000; Jobbágy and Jackson 2001); C20 is the expected SOC or TN storage adjusted to 0-20 cm soil layer at a specific depth; ħ is the original soil depth (cm) available in each study; Ch is measured at a specific sample depth h (cm) for SOC or TN storage.
The current meta-analysis used the natural logarithm of the response ratio (R) to quantify the effect as (Hedges et al., 1999):
$\text{ln}R=\ln ({{R}_{d}}/{{R}_{c}})=\text{ln}{{R}_{d}}-\text{ln}{{R}_{C}}$
where Rd and Rc are the values of control and experimental groups.
The variances (V) were calculated as:
$V=\frac{SD_{d}^{2}}{{{n}_{d}}M_{d}^{2}}+\frac{SD_{c}^{2}}{{{n}_{c}}M_{c}^{2}}$
where SDd and SDc represent the standard deviation of the control group and the experimental group, respectively; nd and nc are the numbers of control and experimental groups; Md is the average of SOC or TN storage in the control group, and Mc is the average of the SOC or TN storage corresponding to the experimental group.
The reciprocal of the variance was used as the weight (W) for each lnR:
$W=1/V$
The overall mean response ratio (lnR+) and the SE of lnR+ were then calculated as:
$\text{ln}{{R}_{+}}=\frac{\mathop{\sum }_{i=1}^{m}\mathop{\sum }_{j=1}^{k}{{W}_{ij{{R}_{ij}}}}}{\mathop{\sum }_{i=1}^{m}\mathop{\sum }_{j=1}^{k}{{W}_{ij}}}$
$SE\left( \text{ln}{{R}_{+}} \right)=1/\sqrt{\underset{i=1}{\overset{m}{\mathop \sum }}\,\underset{j=1}{\overset{k}{\mathop \sum }}\,{{W}_{ij}}}$
The lnR+ and 95%CI can be converted by [EXP (lnR+) - 1] × 100%. We defined that if the 95%CI is larger than zero, the effect of the treatment is considered as significant.

3 Results and discussion

3.1 General dataset information

After the screening procedure, 31 articles and 531 sets of data (383 sets of SOC data and 148 sets of TN data) were selected (Table 1). SOC data from the upper, middle, and downstream of the HRB occupied 25.6%, 56.9%, and 17.5% of the total data volume, respectively. In contrary, only the upstream and midstream data were obtained for TN data, accounting for 41.9% and 58.1%, respectively. The study also explored the response due to the LUCC (regardless of soil depth differences) and soil depth, as well as the verification of SOC and TN storage by different LUCCs within different soil layers. Specific data distribution is shown in Table 2 and Figure 1.
Table 2 SOC and TN database in the Heihe River Basin
Overall 0-10 cm 10-20 cm 20-40 cm 40-60 cm 60-80 cm 80-100 cm Up Mid Down
SOC 383 115 137 59 33 21 18 98 218 67
TN 148 52 57 21 15 3 - 62 86 -
SOC TN SOC TN SOC TN SOC TN SOC TN SOC TN SOC TN
WL-SL 41 20 20 6 11 8 4 3 4 3 1 - 1 - - - -
WL-GL 109 31 34 9 46 11 18 7 8 3 2 1 1 - - - -
WL-CL 35 21 13 9 13 8 4 2 2 1 2 1 1 - - - -
WL-PL 11 - 4 - 7 - - - - - - - 6 - - - -
GL-CL 76 29 15 9 24 12 19 - 6 1 6 - - - - - -
CL-PL 29 12 8 6 9 6 3 - 3 - 3 - 3 - - - -
SL-GL 76 6 3 3 5 3 3 - 3 - - - - - - - -
WL-OL 26 17 10 6 12 6 2 2 1 7 1 1 - - - - -
GL-OL 34 - 4 - 6 - 2 - 6 - - - - - - - -
CL-OL 6 6 3 3 3 3 - - - - 6 - 6 - - - -

*In the table, 0-10 cm, 10-20 cm, 20-40 cm, 40-60 cm, 60-80 cm and 80-100 cm represent different soil layers. WL, SL, GL, CL, PL, OL represent woodland, shrub land, grassland, cultivated land, plantation and other land types, respectively. Up, Mid and Down represent the upper, middle and lower reaches of the Heihe River Basin. Other numbers indicate the number of samples.

3.2 Responses ration of SOC, TN storage and soil bulk density (BD) due to LUCC

The overall mean response ratio, lnR, is weighted according to the mean and standard deviation of each sample. Prior to the meta-analysis, the normality of the data was tested using the Shapiro-Wilk test (Shapiro and Wilk, 1965). In general, the lnR of SOC, TN storage and BD well-matched the normal distribution, using both the FD and the ESM methods (Figure 2).
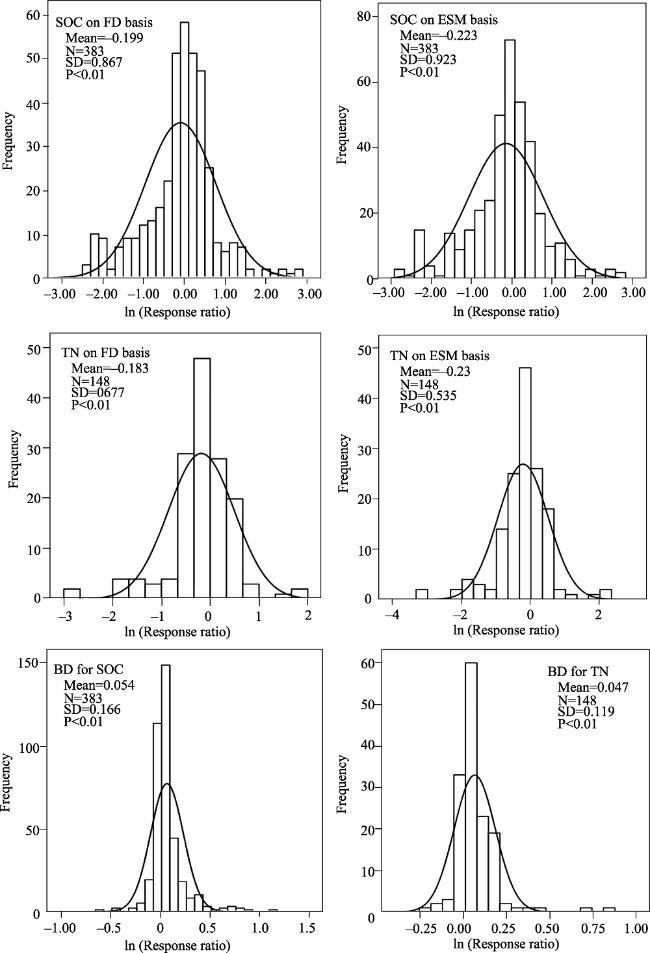
Figure 2 Distributions of the lnR (logarithmic of the response ration) for SOC and TN storage using the FD and ESM methods, with soil BD response to LUCC. The solid curves are the Gaussian distributions fitted to the frequency data. P indicates whether the value is statistically significant.
However, since several datasets failed to meet the assumptions underlying parametric statistical tests (e.g. the distribution of data on various types of LUCCs within different soil layers), nonparametric procedures were then applied to conduct further analysis. In the current study, one-sample Wilcoxon signed rank was used to determine whether lnR+ was deviated from zero.
It is noted that the transformation of land use patterns has key impact on SOC and TN storage (Figure 2). For the 383 paired datasets of SOC, lnR+ (overall mean response ratio) calculated by the FD and ESM methods were -0.199 and -0.223, respectively, which indi-cates that the LUCC led to losses of 17.39% and 19.31% of the total SOC storage. Similar to SOC, for the 148 paired datasets of TN, lnR+ calculated by the FD and ESM methods were -0.154 and -0.205, meaning that the TN storage decreased by 14.27% and 18.52%. We could then conclude that the meta-data clearly indicated that the LUCC caused significant losses of both SOC and TN storage (P < 0.05, the value of P indicates the significance), either using the FD or ESM method. From the long-term perspective, any LUCC that undermines the previous equilibrium process would change the SOC storage (Batjes, 2014; Janzen, 2015). Especially in the conversion of forest land or grassland into cultivated land, most of which lead to the losses of C and N (Don et al., 2011; Wei et al., 2014; Lv et al., 2014). This change directly declines the soil quality, which is consistent with the current status of land desertification in the arid and semi-arid regions of northwestern China. Studies in the southwestern Karst region have shown that the C and N losses caused by the LUCC are closely related to Karst rocky desertification (Xie et al., 2015). Therefore, the LUCC has always been seen as a key process affecting C and N. However, also shown in Figure 2, it is worth noting that the soil bulk density (BD) has dramatic changes through the years. Soil BD corresponding to SOC and TN increased by 5.56% and 4.81%, respectively. Those changes in soil BD also results in significant differences between the FD and ESM methods. Specifically, these data imply that the SOC and TN storage calculated using the FD method may influence the interpretation of the results (Toledo et al., 2013).

3.3 SOC and TN storage calculated using the FD and ESM methods

Under the influence by the calculation methods (i.e., FD and ESM), the deviation of the SOC estimation caused by the variability in the soil BD has attracted more attention recently (Lee et al., 2009; Toledo et al., 2013). In the current study, SOC and TN storage calculated based on the FD and ESM methods are presented in Figure 3. The results showed that the SOC storage lost 17.39% and 19.31%, while the TN storage lost 14.27% and 18.52%, respectively. Although the calculation results of the FD and ESM methods are not statistically different, the FD method underestimates the loss of SOC and TN storage, which cannot be ignored. The ESM method proposed in this study, in which the fixed depth can be normalized to spe cific soil quality within a certain layer, is expected to be more precise than the FD method. More specifically, also confirmed by previous studies, the ESM is better than the FD method to clarify the changes in SOC and TN data (Don et al., 2011; Lee et al., 2009; Hu et al., 2016). The inconsistencies between the FD and ESM methods may be related to the soil quality (Vandenbygaart and Angers, 2006; Wiesmeier et al., 2015). To look into the differences between the calculation methods, we collected the soil BD data from the literature as comprehensively as possible and applied both methods with results summarized in Figure 3. The lnR+ of soil BD corresponding to SOC and TN storage were 0.054 and 0.047, respectively. Moreover, both SOC-BD and TN-BD showed significant changes (P < 0.05), which inevitably leads to deviations in SOC and TN storage estimates by the FD method, and this was supported by other studies (Don et al., 2011; Lee et al., 2009). In summary, our study showed that the ESM is superior to the FD method in estimating SOC and TN storage. Therefore, we adopted the ESM in the following analysis to assess SOC and TN storage.
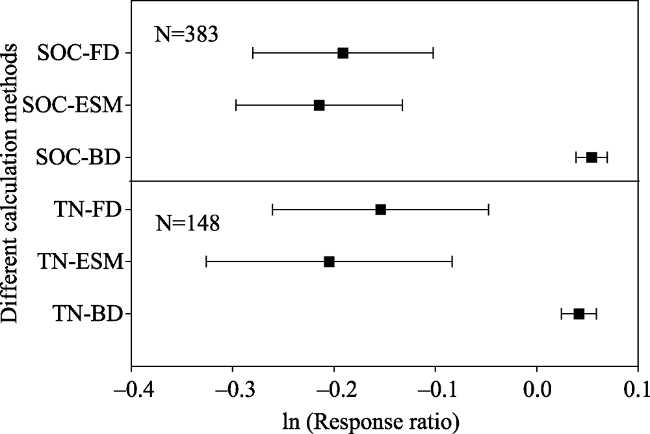
Figure 3 SOC and TN storage calculated using the FD and ESM methods, with changes in soil BD. N indicates the number of samples

3.4 Responses of SOC and TN storage to the LUCC in the upper, middle and lower reaches of the Heihe River Basin

In this study, the experimental data of the HRB were classified into three categories as the upstream, midstream and downstream, and the volumes of the SOC data were 98, 218, and 67, respectively. Due to the LUCC, the lnR+ of SOC storage were -0.192, -0.173 and -0.480, which means huge SOC losses throughout the entire HRB. In particular, the loss in the downstream area was about 38.13%, while less SOC loss was 15.92% in the midstream area, which was statistically significant (P < 0.05). By far, we have only obtained the TN data from the upstream and middle reaches, so the data is divided into two groups: upstream and midstream. As expected, the TN storage also experienced significant losses in the upstream and midstream areas after the LUCC. The lnR + of the upstream and midstream are -0.26 and -0.18, which means that 26.06% and 16.59% of the TN storage have been lost. Concluded from the results, although there are noticeable location-related differences, there is no doubt that the LUCC has caused serious losses in the SOC and TN storage (Figures 3 and 4).
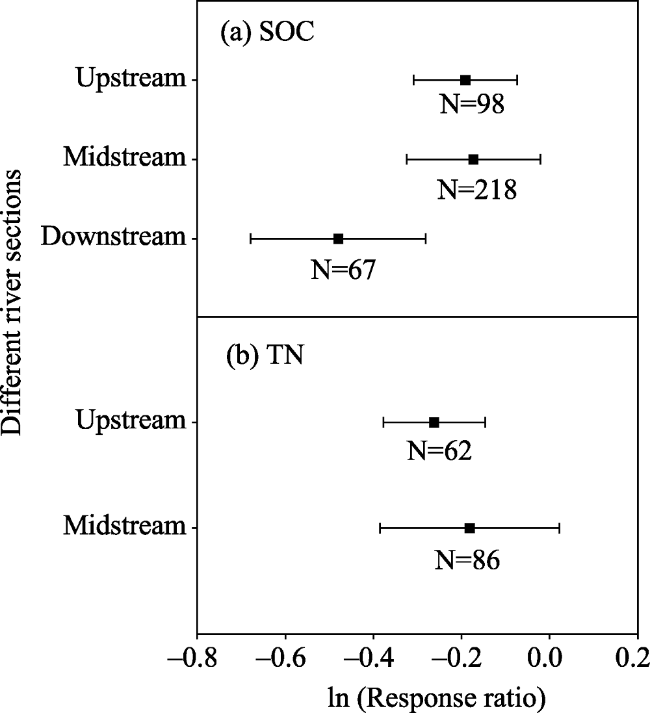
Figure 4 The SOC (a) and TN (b) storage affected by changes in the LUCC in the upper, middle and lower reaches of the Heihe River Basin

3.5 Responses of SOC and TN storage to different LUCCs

We further explored the response of SOC and TN storage to different types of the LUCC. Results from the meta-analysis are shown in Figure 5. The effects of different LUCCs on SOC and TN storage were largely different in the HRB (P < 0.01). For the SOC database (Figure 5a), it can be seen that almost opposite patterns were found among different LUCCs (lnR+ varies between -1.32 and 1.00). The SOC storage increased sharply after the conver sion from cultivated land (CL) to plantation land (PL, lnR+ = 1.01, P < 0.05). When woodland (WL) was converted into shrub land (SL, lnR+ = 0.60, P < 0.05) or plantation land (lnR+ = -1.32, P < 0.05), woodland (lnR+ = -0.78, P <0.05) or grassland (GL, lnR+= -1.00, P <0.05) or cultivated land (lnR+ = -0.76, P < 0.05) were degraded to other land types (OL), SOC storage exhibit serious losses due to the LUCC. When forest land (FL, lnR+ = -0.15) or shrub land (SL, lnR+ = 0.04) was converted into grassland, and the forest land (FL, lnR+ = 0.05) or grassland (lnR+ = 0.04) was converted into cultivated land, the SOC storage was slightly disturbed, leading to minor SOC loss or increase (P > 0.05). Similar to the SOC data, the TN storage also showed inconsistent behaviors in response to different LUCCs (P < 0.01). The lnR+ value of TN storage mainly lies at intervals of -0.60 to 0.30, except the scenario when cultivated land was converted to other land types (lnR+ = -1.78, N=6).
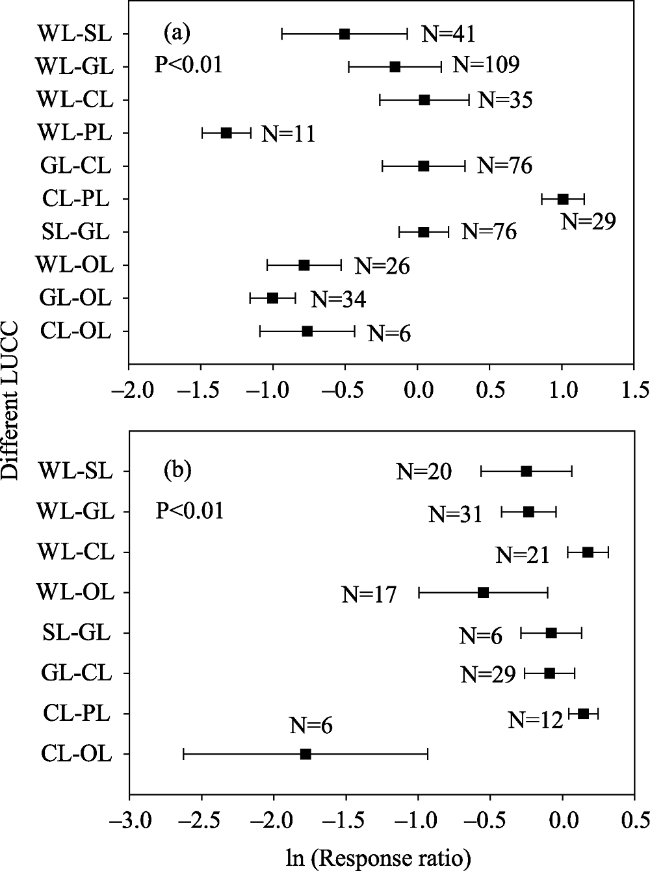
Figure 5 Effects of different LUCCs on SOC (a) and TN (b) storage (WL, woodland; SL, shrub land; GL, grass land; CL, Cultivated land; PL, Plantation land; OL, Other land types)
In particular, the conversion of woodland to cultivated land (lnR+ = 0.17, P < 0.05) and the conversion of cultivated land to plantation land (lnR+ = 0.14, P < 0.05) both increased the storage by 13.93% and 10.58%, respectively. On the other hand, the conversion of woodland to grassland (lnR+ = -0.23, P < 0.05) or other land types (lnR+ = -0.55, P < 0.05) caused much more losses (20.09% and 30.66%). There was no statistical significance in the conversion of woodland into shrubs (lnR+ = -0.25, P > 0.05), conversion of shrubs into grassland(lnR+ = -0.08, P > 0.05) and grassland into cultivated land (lnR+ = -0.09, P > 0.05), resulting in losses of 38.42%, 10.3% and 23.79% respectively.
In summary, the LUCC (unless specific LUCC, such as the conversion from cultivated land to plantation land) leads to remarkable losses in the SOC and TN storage in the entire HRB, especially as forest land and grassland degraded into other land types. This has become a major issue for improving the fragile eco-environment in the HRB (Lv et al., 2012). Similar results have been reported in the research conducted in the Loess Plateau, the southwest karst and other regions of China (Zhang et al., 2014; Hu et al., 2016; Chang et al., 2017). Converting land types with higher/denser plant cover (such as forest land and grassland) into cultivated land or other land types (mainly referred to as desert, Gobi and bare land in this study) would reduce the accumulation of soil organic matter (SOM) into the soil system, whether above or below ground (Guo and Gifford, 2002). On the other hand, the LUCC would destroy the stability of soil structure and SOM, change soil temperature andhumidity, enhance microbial activity, and accelerate the decomposition of soil C and N (Bouwman et al., 1995). In addition, our research indicates that the uncertainties in the conversion of forest land to grassland and grassland to cultivated land are closely related to
human activities (Davis et al., 2007; Liu et al., 2016) and the year of the LUCC (Zhang et al., 2015). Due to the significant impact of the LUCC on SOC and TN storage, strict control and regulation of land use change, especially forest land and grassland, will help prevent the subsequent losses. Simultaneously, engineering projects (such as afforestation) to mitigate SOC and N losses should be considered in arid and semi-arid areas, which is particularly important in Northwest China, as large areas of woodland and grassland are increasingly and rapidly turning to cultivated field and other human- regulated ecosystems.

3.6 The response of SOC and TN storage to LUCC in different soil layers

Besides the overall response of SOC and TN storage to LUCC and methodological differences, it is worth noting that soil depth is another key impact factor related to the effect of SOC and TN storage losses by LUCC. Hu et al. (2016) reported that the traditional shallow sampling method would underestimate the SOC and TN losses caused by the LUCC in the karst region of the southwestern China. Consequently, this section is focused on studying the effects of soil depth on the assessment of SOC and TN storage in the HRB. The SOC database was divided into six groups categorized by soil layers at 0-10, 10-20, 20-40, 40-60, 60-80 and 80-100 cm, and the TN data was divided into five groups (Figure 6). At the same time, the responses of the SOC and TN storage to the LUCC were examined in each soil layer (Figures 7 and 8). Our results clearly demonstrate that the SOC losses caused by the LUCC mainly occurred in the top soil layers: 0-10 cm (lnR+ = -0.32, P < 0.05), 10-20 cm (lnR+ = -0.32, P < 0.05) and 20-40 cm (lnR+ = -0.16, P < 0.05). In deeper soil layers (40-60 cm, lnR+ = 0.06; 60-80 cm, lnR+ = 0.06; and 80-100 cm, lnR+ = 0.19), the LUCC only had minor impact on SOC storage loss (P > 0.05). The LUCC of deep soil has mainly converted into cultivated land, and previous studies have shown that cropland cultivation has positive effects in improving SOC storage (Fallahzade and Hajabbasi, 2012; Yang et al., 2013). Taking woodland conversion to grassland as an example (the sample size is large enough, Figure 7), the SOC storage in the 0-10 cm soil layer basically remained unchanged (lnR+ = 0.001), while in 10-20 and 20-40 cm soil layers, it was reduced by 25.29% and 17.25%, respectively. As the soil layer goes deeper, the SOC loss rate decreased significantly, noted that the loss rate in the 40-60 cm soil layer was only 5.91%. Even in the 60-80 and 80-100 cm soil layers, lnR+ showed a positive value, indicating that the SOC storage was gained after the conversion of woodland to grassland. Excluding 60-80 cm soil layer (the sample size is too small), the response of TN to the LUCC is basically consistent with the SOC. The TN loss rate follows the order of 0-10 cm (lnR+ = -0.33, P < 0.05) > 10-20 cm (lnR+ = -0.18) > 20-40 cm (lnR+ = -0.17, P < 0.05) > 40-60 cm (lnR+ = -0.12). Similarly, results for the TN storage were consistent with those for the SOC (Figure 8).
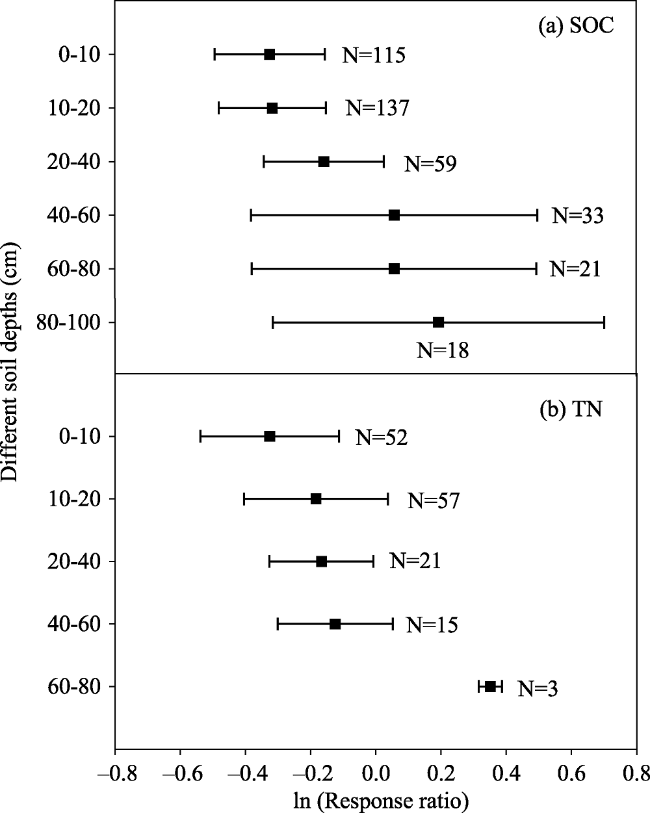
Figure 6 The overall response of SOC (a) and TN (b) storage in different soil layers
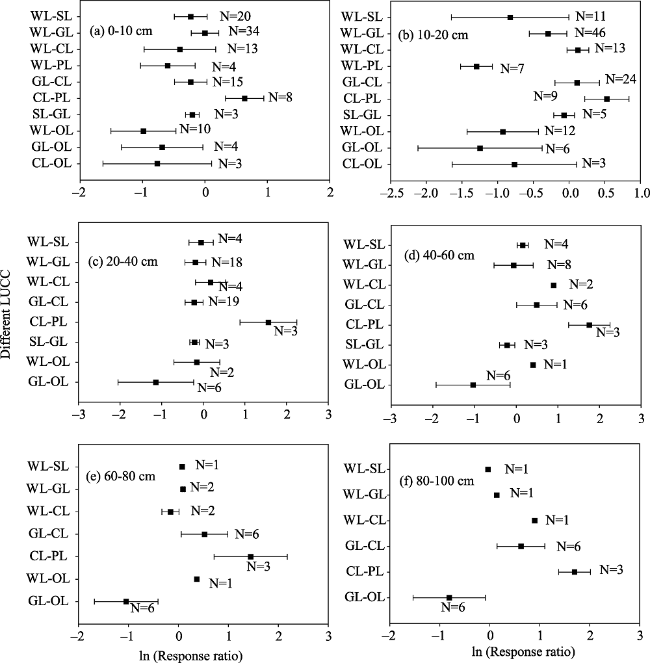
Figure 7 Response of SOC storage in different depths to specific LUCCs. (a), (b), (c), (d), (e), (f) represent 0-10, 10-20, 20-40, 40-60, 60-80 and 80-100 cm soil layers, respectively. N indicates the number of samples (WL, woodland; SL, shrub land; GL, grassland; CL, cultivated land; PL, plantation land; OL, other land types).
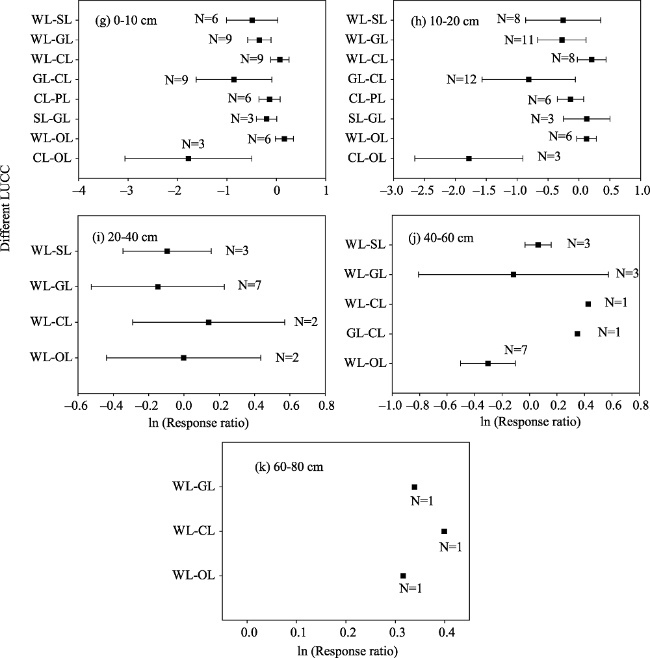
Figure 8 Response of TN storage in different depths to specific land use changes. (a), (b), (c), (d), (e) represent 0-10, 10-20, 20-40, 40-60 and 60-80 cm soil layers, respectively. N indicates the number of samples (WL, woodland; SL, shrub land; GL, grassland; CL, cultivated land; PL, plantation land; OL, other land types).
Obviously, the differences in soil layer selection will lead to biased assessments of SOC and TN storage, and even lead to inconsistent conclusions (Olson and Al-Kaisi, 2015). Therefore, previous studies that use shallow sampling to characterize the effect of the LUCC on SOC or TN storage may result in large deviations (Jiang et al., 2015; Niu et al., 2013). In order to more accurately evaluate the impact of the LUCC on SOC and TN storage, we should incorporate deep sampling methods, which were also suggested by Lal (2009).

4 Conclusions

The current study conducted a meta-analysis to investigate the response of soil organic carbon (SOC) and total nitrogen (TN) storage due to the land use and cover change (LUCC) in the Heihe River Basin (HRB). The results demonstrate that:
(1) The LUCC caused significant losses in both SOC and TN storage in the HRB. However, the losses depend on specific land use pattern, the depth of the soil layer and the calculation method (the fixed-depth, FD, and the equivalent mass, ESM), which have been identified as three major controlling factors via the current study.
(2) At the basin scale, the results from the FD method showed that SOC and TN storage lost 17.39% and 14.27%, respectively. Inconsistent with the FD, the results calculated using the ESM method showed that the losses of SOC and TN storage were 19.31% and 18.52%. In addition, to quantify SOC and TN storage more accurately, the variations in response to SOC and TN within different soil layers should be fully considered. It has been demonstrated that increasing the sampling depth is crucial in future research.
(3) Finally, significant differences between specific LUCC were found in the responses of SOC and TN storage. Therefore, the effects of the specific land use pattern, the depth of the soil layer and the calculation method should be fully considered in future research. Further study is also needed to look into the fundamental processes and associated mechanisms (Especially the potential impact of climate on the LUCC in arid and semi-arid areas) behind SOC and TN losses after the LUCC in the typical arid and semi-arid areas.
[1]
Ali A M S , 2006. Rice to shrimp: Land use/land cover changes and soil degradation in Southwestern Bangladesh. Land Use Policy, 23:421-435.

[2]
An P, Li X J, Zheng Y R et al., 2015. Distribution of plant species and species-soil relationship in the east central Gurbantunggut Desert, China. Journal of Geographical Sciences, 25(1):101-112.

[3]
Batjes N H , 2014. Projected changes in soil organic carbon stocks upon adoption of recommended soil and water conservation practices in the upper Tana River catchment, Kenya. Land Degradation and Development, 25(3):278-287.

[4]
Chang Y P, Li L, Xu Z L , 2017. Estimation of soil organic carbon loss from reclamation of Picea crassifolia forestry in northern slope of Tianshan Mountains. Acta Ecologica Sinica, 37(4):1168-1173. (in Chinese)

[5]
Costantini E A C, Branquinho C, Nunes A et al., 2016. Soil indicators to assess the effectiveness of restoration strategies in dryland ecosystems. Solid Earth, 7:397-414.

[6]
Covaleda S, Gallardo J F, García-Oliva F et al., 2011. Land-use effects on the distribution of soil organic carbon within particle-size fractions of volcanic soils in the Transmexican Volcanic Belt (Mexico). Soil Use and Management, 27:186-194.

[7]
Davis M, Nordmeyer A, Henley D et al., 2007. Ecosystem carbon accretion 10 years after afforestation of depleted subhumid grassland planted with three densities of Pinus nigra. Global Change Biology, 13(7):1414-1422.

[8]
Don A, Schumacher J, Freibauer A , 2011. Impact of tropical landuse change on soil organic carbon stocks: A meta-analysis. Global Change Biology, 17:1658-1670.

[9]
Ellert B H, Bettany J R , 1995. Calculation of organic matter and nutrients stored in soils under contrasting management regimes. Canadian Journal of Soil Science, 75(4):529-538.

[10]
Fallahzade J, Hajabbasi M A , 2012. The effects of irrigation and cultivation on the quality of desert soil in central Iran. Land Degradation and Development, 23:53-61.

[11]
Gamboa A M, Galicia L , 2011. Differential influence of land use/cover change on topsoil carbon and microbial activity in low-latitude temperate forests. Agriculture, Ecosystems and Environment, 142:280-290.

[12]
García-Díaz A, Allas R B, Gristina L et al., 2016. Carbon input threshold for soil carbon budget optimization in eroding vineyards, Geoderma, 271:144-149.

[13]
Gerard F, Petit S, Smith G et al. , 2010. Land cover change in Europe between 1950 and 2000 determined employing aerial photography. Progress in Physical Geography, 34:183-205.

[14]
Guo L B, Gifford R , 2002. Soil carbon stocks and land use change: A meta analysis, Global Change Biology, 8:345-360.

[15]
Harris N L, Brown S, Hagen S C et al., 2012. Baseline map of carbon emissions from deforestation in tropical regions. Science, 336(6088):1573-1576.

[16]
Hedges L V, Gurevitch J, Curtis P S , 1999. The meta-analysis of response ration in experimental ecology. Ecology, 80(4):1150-1156.

[17]
Houghton R A, House J I, Pongratz J et al., 2012. Carbon emissions from land use and land-cover change. Biogeosciences, 9:5125-5142.

[18]
Hu Y, Du Z, Wang Q et al., 2016. Combined deep sampling and mass-based approaches to assess soil carbon and nitrogen losses due to land-use changes in karst area of southwestern China. Solid Earth, 7(4):1075-1084.

[19]
Janzen H H , 2015. Beyond carbon sequestration: Soil as conduit of solar energy. European Journal of Soil Science, 66:19-32.

[20]
Jiang P, Cheng L, Li M et al., 2015. Impacts of LUCC on soil properties in the riparian zones of desert oasis with remote sensing data: A case study of the middle Heihe River basin, China. Science of the Total Environment, 506/507:259-271.

[21]
Jobbágy E G, Jackson R B , 2000. The vertical distribution of soil organic carbon and its relation to climate and vegetation. Ecological Applications, 10:423-436. (in Chinese)

[22]
Jobbágy E G, Jackson R B , 2001. The distribution of soil nutrients with depth: Global patterns and the imprint of plants. Biogeochemistry, 53:51-77.

[23]
Lal R , 2005. Forest soils and carbon sequestration. Forest Ecology and Management, 220:242-258.

[24]
Lal R , 2009. Challenges and opportunities in soil organic matter research. European Journal of Soil Science, 60:158-169.

[25]
Lee J H, Hopmans J W, Rolston D E , et al., 2009. Determining soil carbon stock changes: Simple bulk density corrections fail. Agriculture Ecosystems and Environment, 134(3):251-256.

[26]
Li D, Gao G, Y et al., 2016. Multi-scale variability of soil carbon and nitrogen in the middle reaches of the Heihe River basin, northwestern China. Catena, 137:328-339.

[27]
Li Y, Shi S, Waqas M A et al., 2018. Long-term (≥20 years) application of fertilizers and straw return enhances soil carbon storage: A meta-analysis. Mitigation and Adaptation Strategies for Global Change, 23(4):1-17.

[28]
Liu S J, Zhang W, Wang K L et al., 2016. Evaluation of carbon sequestration after conversion of cropland to forest and grassland projection in karst peak-cluster depression area of northwest Guangxi, China. Acta Ecologica Sinica, 36(17):5528-5536. (in Chinese)

[29]
Lozano-García B, Parras-Alcántara L , 2014. Variation in soil organic carbon and nitrogen stocks along a toposequence in a traditional mediterranean olive grove. Land Degradation and Development, 25:297-304.

[30]
Lv Y, Sun R, Fu B, Wang Y , 2012. Carbon retention by check dams: regional scale estimation. Ecological Engeering, 44:139-146. (in Chinese)

[31]
Lv Y H, Ma Z M, Zhao Z J et al., 2014. Effects of land use change on soil carbon storage and water consumption in an oasis-desert ecotone. Environmental Management, 53:1066-1076.

[32]
Mendoza M E, Granados E L, Geneletti D et al., 2011. Analysing land cover and land use change processes at watershed level: A multitemporal study in the Lake Cuitzeo Watershed, Mexico (1975-2003). Applied Geography, 31:237-250.

[33]
Mukhopadhyay S, Masto R E, Cerdà A et al., 2016. Rhizosphere soil indicators for carbon sequestration in a reclaimed coal mine spoil. Catena, 141:100-108.

[34]
Niu R X, Zhao X Y Liu J L , et al., 2013. Effects of land use/cover change in the desert oasis system on topsoil carbon and nitrogen (middle Heihe River Basin, China). Polish Journal of Ecology, 61(1):45-54.

[35]
Olson K R, Al-Kaisi M M , 2015. The importance of soil sampling depth for accurate account of soil organic carbon sequestration, storage, retention and loss. Catena, 125:33-37.

[36]
Pan G, Li L, Wu LL et al., 2004. Storage and sequestration potential of topsoil organic carbon in China’s paddy soils. Global Change Biology, 10(1):79-92.

[37]
Powlson D S, Stirling C M, Thierfelder C et al., 2016. Does conservation agriculture deliver climate change mitigation through soil carbon sequestration in tropical agro-ecosystems? Agriculture Ecosystems and Environment, 220:164-174.

[38]
Qi S, Luo F , 2007. Environmental degradation problems in the Heihe River Basin, northwest China. Water and Environment Journal, 21(2):142-148.

[39]
Qi S Z, Li X Y, Duan H P , 2007. Oasis land-use change and its environmental impact in Jinta Oasis, arid northwestern China. Environmental Monitoring and Assessment, 134(1-3):313.

[40]
Qi S Z, Luo F , 2006. Land-use change and its environmental impact in the Heihe river basin, arid northwestern China. Environmental Geology, 50:535-540.

[41]
Shi S, Peng C, Wang M et al., 2016. A global meta-analysis of changes in soil carbon, nitrogen, phosphorus and sulfur, and stoichiometric shifts after forestation. Plant and Soil, 407(1/2):1-18.

[42]
Shi S, Zhang W, Zhang P et al., 2013. A synthesis of change in deep soil organic carbon stores with afforestation of agricultural soils. Forest Ecology and Management, 296(3):53-63.

[43]
Shi S W, Peng C H, Wang M et al., 2016. A global meta-analysis of changes in soil carbon, nitrogen, phosphorus and sulfur, and stoichiometric shifts after forestation. Plant and Soil, 407(1/2):1-18.

[44]
Shirvani M, Khalili B, Mohaghegh P et al., 2010. Land-use conversion effects on phosphate sorption characteristics in soils of forest and rangeland sites from Zagros area, western Iran. Arid Land Resesarch and Management, 24:223-337.

[45]
Song C Q, Yuan L H, Yang X F et al., 2017. Ecological-hydrological processes in arid environment: Past, present and future. Journal of Geographical Sciences, 27(12):1577-1594.

[46]
Song G, Li L, Pan G et al., 2005. Topsoil organic carbon storage of China and its loss by cultivation. Biogeochemistry, 74(1):47-62.

[47]
Sonneveld B G J S, Keyzer M A, Ndiaye D , 2016. Quantifying the impact of land degradation on crop production: the case of Senegal. Solid Earth, 7(2):1797-1825.

[48]
Toledo D M, Galantini J, Dalurzo H et al., 2015. Methods for assessing the effects of land use changes on carbon stocks of subtropical oxisols. Soil Science Society of America Journal, 77(5):1542-1552.

[49]
Vandenbygaart A J, Angers D A , 2006. Towards accurate measurments of soil organic carbon stock change in agroecosystems. Canadian Journal of Soil Science, 86(3):465-471.

[50]
Virto I, Barré P, Burlot A et al., 2012. Carbon input differences as the main factor explaining the variability in soil organic C storage in no-tilled compared to inversion tilled agrosystems. Biogeochemistry, 108(1-3):17-26.

[51]
Wang G, Liu J, Kubota J et al., 2010. Effects of land-use changes on hydrological processes in the middle basin of the Heihe River, northwest China. Hydrological Processes, 21(10):1370-1382.

[52]
Wang Y, Feng Q, Si J et al., 2011. The changes of vegetation cover in Ejina oasis based on water resources redistribution in Heihe River. Environmental Earth Sciences, 64(7):1965-1973.

[53]
Wei X, Shao M, Gale W et al., 2014. Global pattern of soil carbon losses due to the conversion of forests to agricultural land. Scientific Reports, 4(4):4062.

[54]
Wiesmeier M, Lützow M Spörlein P , et al., 2016. Land use effects on organic carbon storage in soils of Bavaria: The importance of soil types. Soil and Tillage Research, 146:296-302.

[55]
Xie L W, Zhong J, Cao F X et al., 2015. Evaluation of soil fertility in the succession of karst rocky desertification using principal component analysis. Solid Earth, 6(2):3333-3359.

[56]
Yang R, Su Y Z, Gan Y T et al., 2013. Field-scale spatial distribution characteristics of soil nutrients in a newly reclaimed sandy cropland in the Hexi Corridor of northwest China. Environmental Earth Sciences, 70:2987-2996.

[57]
Yang Y H, Li W H, Zhu C G et al., 2017. Impact of land use/cover changes on carbon storage in a river valley in arid areas of Northwest China. Journal of Arid Land, 9(6):879-887.

[58]
Yang Y H, Luo Y Q, Finzi A C , 2011. Carbon and nitrogen dynamics during forest stand development: A global synthesis. New Phytologist, 190(4):977.

[59]
Zhang S, Xu M Q, Zhang Y F et al., 2014. Effects of land use change on soil organic carbon storage in the hilly Loess Plateau. Acta Scientiae Circumstantiae, 34(12):3094-3101. (in Chinese)

[60]
Zhang W J, Liao H K, Long J et al., 2015. Effects of planting zanthoxylum on soil organic carbon mineral resources and active organic carbon in karst rocky desertification areas. Environmental Science, ( 3):1053-1059.

Outlines

/