Spatial associations between NDVI and environmental factors in the Heihe River Basin

  • YUAN Lihua 1 ,
  • CHEN Xiaoqiang 1 ,
  • WANG Xiangyu 1 ,
  • XIONG Zhe 2 ,
  • SONG Changqing , 1, 3, 4, *
Expand
  • 1 Center for GeoData and Analysis, Faculty of Geographical Science, Beijing Normal University, Beijing 100875, China
  • 2 Key Laboratory of Climate-Environment for East Asia, Institute of Atmospheric Physics, CAS, Beijing 100029, China
  • 3 SState Key Laboratory of Earth Surface Processes and Resource Ecology, Beijing Normal University, Beijing 100875, China
  • 4 Key Laboratory of Environmental Change and Natural Disaster, Beijing Normal University, Beijing 100875, China
Song Changqing, Professor, specialized in geographical paradigms and regional integration. E-mail:

Yuan Lihua (1988–), specialized in geographical variations analysis and human geography research. E-mail: ylh20070901@ 163.com

Received date: 2018-10-23

  Accepted date: 2019-01-22

  Online published: 2019-12-11

Supported by

National Key R&D Program of China(No.2017YFA0604704)

Copyright

Copyright reserved © 2019. Office of Journal of Geographical Sciences All articles published represent the opinions of the authors, and do not reflect the official policy of the Chinese Medical Association or the Editorial Board, unless this is clearly specified.

Abstract

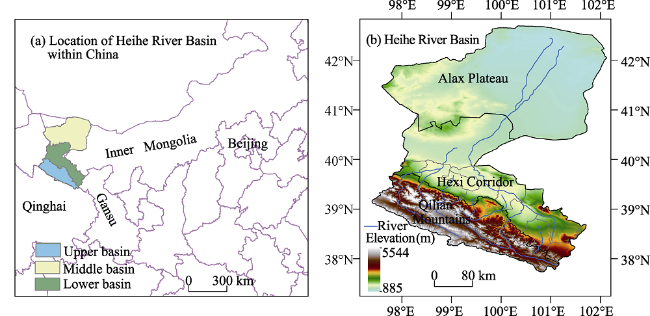
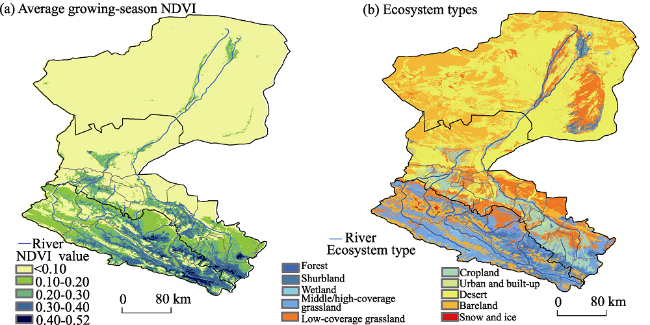
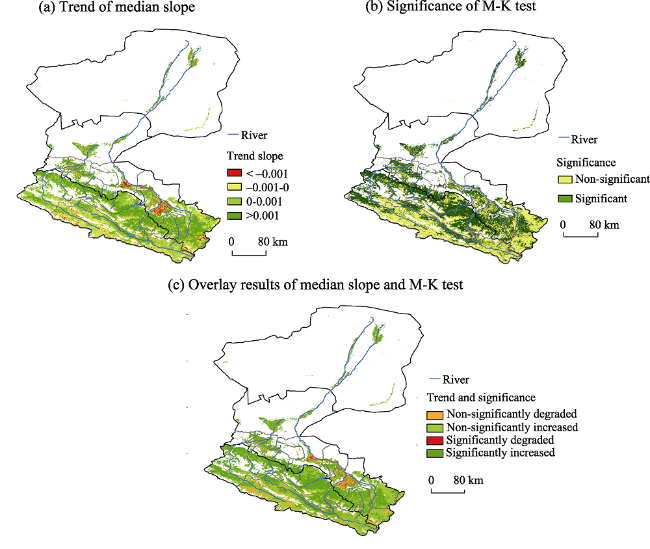
The Heihe River Basin is located in the arid and semi-arid regions of Northwest China. Here, the terrestrial ecosystem is vulnerable, making it necessary to identify the factors that could affect the ecosystem. In this study, MODIS-NDVI data with a 250-m resolution were used as a proxy for the terrestrial ecosystem. By combining these with environmental factors, we were able to explore the spatial features of NDVI and identify the factors influencing the NDVI distribution in the Heihe River Basin during the period of 2000-2016. A geographical detector (Geodetector) was employed to examine the spatial heterogeneity of the NDVI and to explore the factors that could potentially influence the NDVI distribution. The results indicate that: (1) the NDVI in the Heihe River Basin appeared high in the southeast while being low in the north, showing spatial heterogeneity with a q-statistic of 0.38. The spatial trend of the vegetation in the three sub-basins generally increased in the growing seasons from 2000 to 2016; (2) The results obtained by the Geodetector (as denoted by the q-statistic as well as the degree of spatial association between the NDVI and environmental factors) showed spatial heterogeneity in the associations between the NDVI and the environmental factors for the overall basin as well as the sub-basins. Precipitation was the dominant factor for the overall basin. In the upper basin, elevation was found to be the dominant factor. The dominant factor in the middle basin was precipitation, closely followed by the soil type. In the lower basin, the dominant factor was soil type with a lower q-statistic of 0.13, and the dominant interaction between the elevation and soil type was nonlinearly enhanced (q-statistic = 0.22).

Cite this article

YUAN Lihua , CHEN Xiaoqiang , WANG Xiangyu , XIONG Zhe , SONG Changqing . Spatial associations between NDVI and environmental factors in the Heihe River Basin[J]. Journal of Geographical Sciences, 2019 , 29(9) : 1548 -1564 . DOI: 10.1007/s11442-019-1676-0

1 Introduction

As a fundamental component of a terrestrial ecosystem, vegetation plays an important role in an ecosystem by maintaining the soil, while regulating the water and carbon cycles (Ballantyne et al., 2016; Forzieri et al., 2016). Ecosystem dynamics, especially vegetation dynamics have received increasing research interest in geography and ecology (Fang et al., 2001, 2005; Raynolds et al., 2008; Udelhoven et al., 2009; Fensholt et al., 2012; Piao et al., 2004, 2014; Seddon et al., 2016). Remote sensing satellite sensors including NOAA AVHRR, SPOT VGT, and MODIS provide spatiotemporal images for monitoring vegetation through vegetation indices (VIs).The normalized difference vegetation index (NDVI) is a widely used proxy for the vegetation growth status and an optimal estimator of vegetation distribution and productivity (Tucker et al., 1986; Myneni et al., 1995). Some global and regional studies have revealed that NDVI can be used to indicate the spatiotemporal characteristics of vegetation (Moody et al., 2001; Fensholt et al., 2012; Piao et al., 2014) and has been widely employed to quantify relationships with climatic and environmental factors, including precipitation, temperature, evapotranspiration, humidity, and topography (Gao et al., 2012).
Vegetation in arid and semi-arid regions is vulnerable and sensitive to environmental change. Several researchers have focused on NDVI variations, relationships between vegetation and environmental factors (especially climatic factors) in arid and semi-arid regions on a large scale (Fensholt et al., 2012; Zhao et al., 2011), such that the features of NDVI on a small scale and spatiotemporal variations may not be revealed. For this paper, we selected the Heihe River Basin (HRB) as a study area in which we could study the vegetation variations on a small scale. One reason for this was that the HRB is known as a typical inland river basin that passes through the arid and semi-arid regions of Northwest China, characterized by a diverse geography and spatial distribution (Ma et al., 2006; Li et al., 2013; Cheng et al., 2014). The dry climate and excessive use of both river water and pumped groundwater for irrigation has led to a degradation of the ecosystem in this basin. To ensure environmental flow in the lower reaches, the National Water Diversion Project was implemented in July 2000. Furthermore, a large amount of data on the HRB has been collected and made available. This includes climatic data, hydrological data, remote sensing data, soil moisture and soil type data (Li et al., 2013; Xiong et al., 2013; Cheng et al., 2014; Song et al., 2017; Shen et al., 2018; Zhang et al., 2018).
Several studies analyzed the NDVI variations and its relationships with the climatic factors in the HRB. Ma et al. (2006) used the AVHRR-NDVI data to explore variations in the vegetation and its correlation with temperature and precipitation from 1982 to 2001, finding that the amount of vegetation exhibited an increasing trend in the middle oasis, having a closer correlation with the amount of precipitation. Han et al. (2011) combined the AVHRR-NDVI and SPOT-VGT NDVI data to investigate the periodicity of the NDVI, temperature, and precipitation from 1982 to 2006, revealing that there was a similar period of 3-15 years between the NDVI and the temperature and precipitation. Sun et al. (2015) used the AVHRR- NDVI to study the vegetation trend from 1982 to 2006 in the three sub-basins of the HRB, finding an upward trend in the upper and middle basins and a downward trend in the lower basin.
However, previous studies have failed to reflect recent variations in NDVI and explore the factors influencing the spatial distribution of NDVI. Hence, the goals of this study were to analyze the recent spatial features of NDVI, explore the spatial associations between NDVI variations and influencing factors, and identify the dominant factors. Given the availability of data, we utilized MODIS-NDVI data from 2000 to 2016 to analyze the spatial features of NDVI; together with the environmental data, we applied a geographical detector (Geodetector) method to explore the spatial associations between NDVI and environmental factors and identify the dominant factors.

2 Data and methods

2.1 Study area

The HRB is the second largest inland river basin in the arid region of Northwest China, located between 37.7°N-42.7°N and 97.1°E-102.0°E, and runs through Qinghai Province, Gansu Province, and the Inner Mongolia Autonomous Region (Li et al., 2013; Cheng et al., 2014). It consists of three sub-basins: the upper basin, the middle basin and the lower basin from south to north. The upper basin is across Qinghai Province and Gansu Province, while the middle and lower basins are mainly located in Gansu Province and the Inner Mongolia Autonomous Region, respectively (Figure 1a). Corresponding to the three sub-basins, the landscape is divided into three major geomorphologic units: the southern Qilian Mountains, the central Hexi Corridor, and the northern Alax Plateau (Figure 1b), characterized by different ecosystems such as forests, grasslands, wetlands, urban areas, oases, barelands, and desert. The mountainous regions act as the water source for the entire river basin. The Hexi Corridor, being part of the arid temperate zone, features artificial oases dominated by irrigated cropland. In the Heihe downstream area, the amount of water resources decreases sharply, with the area being covered mainly by Gobi, barelands, deserts, and grasslands, where the mean elevation is approximately 1000 m and the annual precipitation is less than 100 mm (Ma et al., 2006; Huai et al., 2014). In this paper, we use the HRB boundary edition of 1995 for the climatic data described in Section 2.2.2 only covered this boundary edition.
Figure 1 Location of the Heihe River Basin, Northwest China

2.2 Data

2.2.1 NDVI data
NDVI is defined as the ratio of two electromagnetic wavelengths: NDVI = (NIR-R) / (NIR + R), where NIR denotes the spectral reflectance in the near infrared and R is the reflectance to red light. As the photosynthetic capacity of the vegetation increases, more visible red light is absorbed due to the increased amount of chlorophyll in the leaves and stems of the vegetation, and more near-infrared light is scattered because of the alignment of the cell walls. This relationship makes the NDVI a good proxy for photosynthetic capability. Therefore, the NDVI is considered as an efficient indicator of green cover and vegetation growth status (Tucker et al., 1986; Myneni et al., 1995).
MODIS-NDVI data with a 250-m resolution derived from MOD13Q1 were used to investigate the vegetation variation in the study area. The MOD13Q1 Terra vegetation index data for February 2000 to December 2016 were obtained from the NASA Land Processes Distributed Active Archive Center (http://lpdaac.usgs.gov/). In the present study, we mainly analyzed the 250-m resolution NDVI data for the HRB during the growing season. The annual average NDVI of the growing season was determined as follows:
First, The MODIS Reprojection Tool (MRT) was used to mosaic and reproject the NDVI data for 16-day composites. The mosaics for each 16-day composite were reprojected from a sinusoidal projection to a WGS84/Albers equal area conic projection (Jiang et al., 2015).
Second, the mosaic data for each 16-day composite for February 2000-December 2016 were aggregated to monthly data using the maximum value compositing (MVC) method (Holben, 1986), which can reduce the influence of clouds and other atmospheric artifacts. Then, a Savitsky-Golay (S-G) filter (Chen et al., 2004) was applied to reconstruct a high-quality monthly time-series of the NDVI data.
Finally, the annual average NDVI data for the growing season were calculated for the period from 2000 to 2016. In the present study, the growing season was defined as a 7-month period from April to October (Fang et al., 2005; He et al., 2017).
2.2.2 Data on environmental factors
We collected a set of seven environmental variables (factors) that could conceivably be correlated with NDVI. The factors could be grouped into three categories and are briefly described and their sources are summarized in Table 1. Climatic and topographical data with continuous values required categorization, while the soil type data was already categorized.
Table 1 Factors selected for spatial association analysis in the Heihe River Basin
Category Factor Factor unit Source
Climate
Precipitation mm Heihe River Data Organization (http://www.heihedata.org/)
Temperature Heihe River Data Organization (http://www.heihedata.org/)
Specific humidity g/kg Heihe River Data Organization (http://www.heihedata.org/)
Topography
Elevation m Derived from DEM data (http://www. heihedata.org/ data/ea5a9bba- 20c3-40c8-8013-584e0e55a952)
Aspect - Derived from DEM data
Slope ° Derived from DEM data
Soil property
Soil type - Heihe River Data Organization (http://www.heihedata.org/)
(1) Climatic data. Because the meteorological stations are scarce and distributed unevenly, simulated climatic grid-data were used in the present study. The climatic data were obtained from the simulated forcing dataset for 3 km/6 h in the HRB (Xiong et al., 2014), which was downloaded from the Heihe River Data Organization website (http://www.heihedata.org/). This dataset included eight climatic variables, of which we used three correlated to the NDVI, including precipitation, temperature, and specific humidity (referred to as ‘humidity’ for simplicity).
(2) Topographical data. The digital elevation model (DEM) data with a resolution of 90 m were obtained from the Shuttle Radar Topography Mission (SRTM) digital elevation data produced by NASA. In the present study, the DEM data were used to obtain the elevation data, as well as to generate slope and aspect data through the application of ArcGIS 10.0.
(3) Soil type data. The soil type data obtained from the Heihe River Data Organization (http://www.heihedata.org/), covered 15 soil types.

2.3 Geographical detector method

To identify the drivers leading to spatial variations in the amount of vegetation within the HRB, the geographical detector (Geodetector) method was applied to determine the spatial association between NDVI and the environmental factors. The Geodetector method can effectively detect spatial heterogeneity of a phenomenon over a specified area and reveal the driver factors. As such, it is widely used in geographical, ecological, geological, and environmental research (Wang et al., 2010, 2016; Luo et al., 2015; Xu et al., 2018). More details about the Geodetector method are provided by Wang et al. (2010, 2012, 2016), while the software is available online (http://www.geodetector.org/). Herein, we merely introduce the method briefly.
Assuming that X denotes a potential environmental variable (e.g., the elevation or soil type) that is to be examined whether it influences the spatial distribution of Y (NDVI in the present study, see Figure 2). Geodetector uses categorical variables, such that X must either already be categorical data (e.g., soil type) or must be reclassified from continuous data (e.g., elevation or slope). Geodetector assumes that, if an independent variable X has an important impact on a dependent variable Y, the spatial distributions of X and Y should be similar, the degree of which is measured by the q-statistic:
${{q}_{{}}}=1-\frac{\sum\limits_{h=1}^{L}{{{N}_{h}}\sigma _{h}^{2}}}{N\sigma _{{}}^{2}}$, q∈[0,1]
where $\sigma _{h}^{2}$ is the variance of the NDVI within category z of the environmental factor X, ${{N}_{h}}$is number of sample units in category z, σ2 is the global variance of NDVI over the entire study area, N is the total number of samples in the entire study area, and L is the number of categories of X. The q-statistic indicates that the degree of spatial association between X and NDVI is 100% × q, allowing us to determine which environmental factor is the dominant factor associated with the NDVI distribution. Additionally, if X denotes the spatial zone, the q-statistic will imply the spatial heterogeneity of the dependent variable (NDVI).
Figure 2 Spatial distribution of average growing-season NDVI (a) and ecosystem types (b) in the Heihe River Basin
Two influencing factors, when combined (overlay of factors), weaken or enhance the influence on the NDVI distribution. This was assessed using the interaction detector in Geodetector (Wang et al., 2012). The interaction relationship between factors X1 and X2 was compared by q(X1$\cap$X2) with q(X1) and q(X2). If q(X1$\cap$X2) > Max(q(X1), q(X2)) indicates that the interaction is enhanced; while if q(X1$\cap$X2) > q(X1) + q(X2) implies that the interaction is nonlinearly enhanced. Other cases are described in the literature (Wang et al., 2012, 2016). This interaction detector allows us to determine the dominant interaction for the NDVI distribution.

3 Results analysis

This study focused on the growing season, which is defined as a 7-month period from April to October (Piao et al., 2004; Fang et al., 2005). Therefore, the results presented herein are based on data for the growing season.

3.1 Spatial features of NDVI distribution in the HRB

Before investigating the spatial associations between the NDVI and the environmental factors, we first examined the spatial features of the NDVI distribution over a 17-year period (2000-2016).
3.1.1 Spatial heterogeneity
The geographical distribution of the mean NDVI for the growing season over the period from 2000 to 2016 was found to decrease from the southeast to the north in the HRB (Figure 2a). The areas of vegetation are located mainly in the upper basin, middle basin, and a few parts of the lower basin, the latter being mostly covered by desert, barelands, and low-coverage grasslands with a NDVI value of < 0.10 (Figure 2). The majority of the NDVI values are within a range of 0.10-0.52 in the upper basin, this being covered predominantly by natural forest and middle/high-coverage vegetation. In the middle basin, the value is 0.10-0.52, this area being covered by croplands, low-coverage vegetation, and barelands (Figure 2b). The statistical results shown in Figure 2a show that NDVI values of < 0.10 accounted for 72.2% of the total area. Those areas with NDVI values of 0.10-0.20 constitute 12.0% of the total area, while the areas with NDVI values of 0.20-0.30 made up 8.7% of the total. The areas with NDVI values of > 0.30 made up 7.1% of the area.
The spatial heterogeneity of the NDVI was measured using Geodetector. First, we took samples within the HRB by generating 800 random points in five times using ArcGIS (five layers of points). We then deleted the points close to the boundaries of the basin in each layer to eliminate the points with non-values when extracting values from the NDVI layer (Figure 2a) and three sub-basin layers. Thus, the remaining points in each point-layer would be the sample points, giving us five layers of random sample points. Second, we applied the Geodetector to each layer of the sample points in the three sub-basins and then obtained the five q-statistics for the NDVI. Finally, we acquired the average q-statistic of 0.38 by averaging the five q-statistics, indicating the spatial heterogeneity of the NDVI distribution within the HRB.
3.1.2 Spatial trend
The overall 17-year trend and significance test of the growing-season NDVI was derived from 2000 to 2016 at each pixel by applying Sen’s median slope and the M-K test, which are popular means of analyzing any trend in the vegetation researches (Fensholt et al., 2012; Jiang et al., 2015; Tong et al., 2018). The results are shown in Figures 3a, 3b, and 3c. In this section, we examine the trend in the vegetation areas that are generally represented by NDVI values > 0.1 (Piao et al., 2004, 2014).
According to the statistics of the NDVI slope, we classified the slope into four types (Table 2): (1) An NDVI slope of < -0.001 was classified as being a moderately degraded area; (2) a slope of -0.001 to 0 was classified as a slightly degraded area; (3) a slope of 0.001-0 was defined as a slightly increased area; and (4) a slope of > 0.001 was defined as a moderately increased area. Those areas for which the NDVI value increased were found to be larger than the degraded area, accounting for 89.4% and 10.6%, respectively. Figure 3b shows the NDVI trend in the HRB, indicating that, overall, the vegetation coverage generally increased. It can be seen that the NDVI patterns in the HRB appear to be spatially heterogeneous, with the NDVI trend varying from the south to the north. The degraded areas are mainly found in the middle basin, in Shandan County, the Ganzhou District of Zhangye City, Linze County, and Gaotai County.
Table 2 Trend and significance results for NDVI in the Heihe River Basin
Value Sub-types Percentage of
sub-types (%)
Types Percentage of
types (%)
NDVI slope (0.001,0.033] Moderately increased 3.5 Increased 10.6
(0,0.001] Slightly increased 7.1
[-0.001,-0] Slightly degraded 20.8 Degraded 89.4
(-0.001,-0.020] Moderately degraded 68.6
Significance
level
<5% - - Significance 54.4
>5% - - Non-significance 45.6
The overlay result of the slope and
M-K test
(0.001,0.033]∩<5% Moderately increased with significance 52.2 Increased with significance 53.0
(0,0.001]∩<5% Slightly increased with significance 0.8
(0.001,0.033]∩>5% Moderately increased with non-significance 19.3 Increased with non-significance 37.0
(0,0.001]∩>5% Slightly increased with non-significance 17.7
(-0.001,-0.020]∩<5% Moderately degraded with significance 1.4 Degraded with significance 1.4
[-0.001,-0]∩<5% Slightly degraded with significance 0
(-0.001,-0.020]∩>5% Moderately degraded with non-significance 2.1 Degraded with non-significance 8.6
[-0.001,-0]∩>5% Slightly degraded with non-significance 6.5

Note: (1) ’-’ denotes non-value; (2) rows 2-5 represent the statistical result of Figure 3a; (3) rows 6-7 shows the statistical result of Figure 3b; rows 8-15 exhibit the statistical result of Figure 3c.

Figure 3 Spatial trends and significance of growing-season NDVI in the Heihe River Basin from 2000 to 2016 (a. Spatial trend of median slope; b. Significance of M-K test; c. Overlay results of median slope and M-K test)
The results of the M-K test were classified into two levels: those with a significant variation (with a confidence level of 0.05) and those with no significant variation. As shown in Table 2, 45.6% of the vegetation area exhibits a non-significant variation, while 54.4% represents a significant variation. The spatial distribution of the significance is shown in Figure 3c, with the non-significant variations mostly being located in Qilian County of the upper basin, and in Shandan County of the middle basin.
As shown in Table 2 and Figure 3c, the overlay results of the median trend (Figure 3a) and M-K test (Figure 3b) are categorized into four types: increased with significance, increased with non-significance, degraded with significance, and degraded with non-significance, which account for 53.0%, 37.0%, 1.4%, and 8.6% of the area, respectively. Figure 3c shows that the ‘degraded with significance’ areas are mainly distributed in the Ganzhou District of Zhangye City and in Gaotai County of the middle basin, these being covered by croplands. The ‘degraded with non-significance’ areas are located in Qilian County of the upper basin.

3.2 Associations with environmental factors in the HRB

3.2.1 Distribution of environmental factors
We used Geodetector to analyze the spatial associations between the NDVI and the environmental factors. Before implementing the Geodetector analysis, the input data were subjected to a four-step process.
First, the NDVI data and the seven environmental factors with different spatial resolutions were resampled to the same spatial resolution of 3 km. (2) Second, six of the environmental factors were categorized into discrete classes (the soil type was already categorized). (3) Third, multiple-attribute values of the one layer of sample points (one of the five layers of sampling points obtained in Section 3.3.1) were extracted from the NDVI layer and the seven environmental layers (Figure 3) by ArcGIS 10.0. (4) Last, the NDVI data and seven items of environmental data were input into the Geodetector tool, and the method was applied to the overall basin and individual sub-basins.
To attain more robust and credible results, prior knowledge of the optimal classification methods, for example, natural breaks, were used to categorize the six variables (excluding the soil type) to acquire a relatively optimal q-statistic. Figure 4 shows the relatively opti-mally categorized types of six environmental variables (Figure 4g shows the already categorized soil type). We then implemented steps (3) and (4) five times (as we obtained five layers of sampling points in Section 3.3.1), and calculated the average values of five q-statistics for both the entire basin and the sub-basins, respectively.
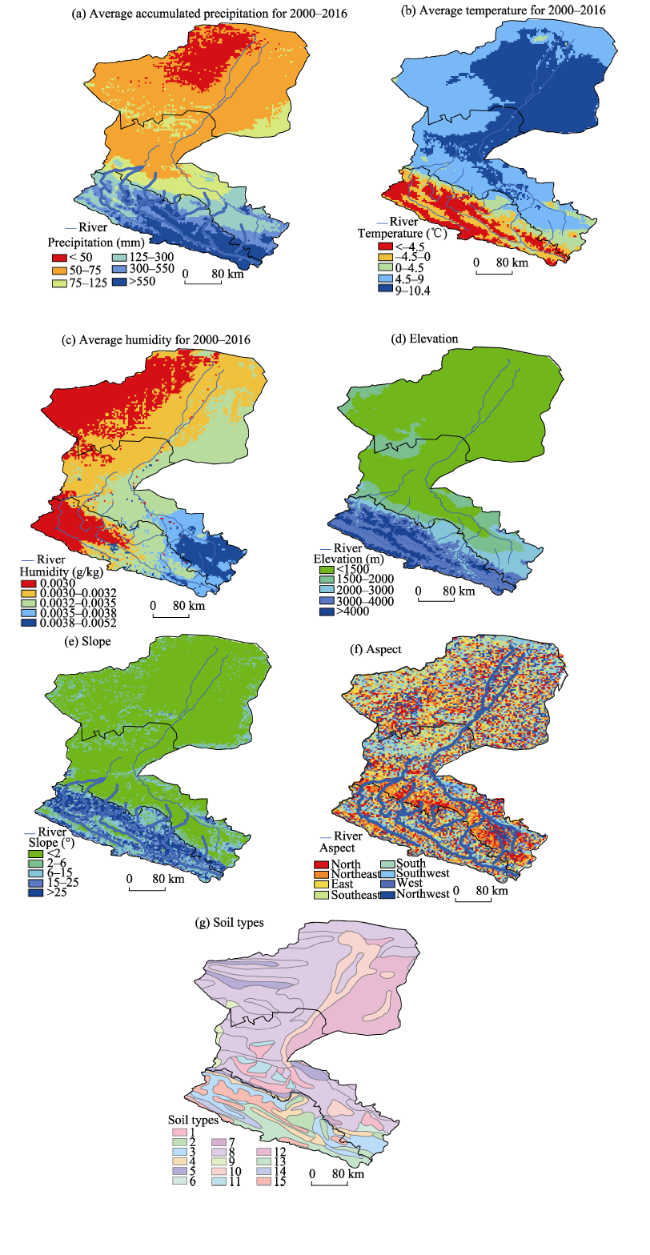
Figure 4 Spatial distribution of seven environmental factors for NDVI in the Heihe River Basin (a. Average accumulated precipitation for 2000-2016; b. average temperature for 2000-2016; c. average humidity for 2000-2016; d. elevation; e. slope; f. aspect; g. soil type, number of 1-15 denoted Alluvial soil, Gray cinnamon soil, Dark brown soil, chestnut soil, brown calcareous soil, gray calcareous soil, gray desert soil, gray brown desert soil, brown desert soil, gray meadow soil, inland saline soil, aeolian sand soil, straw mat soil, shaga soil, cold desert soil, respectively.)
3.2.2 Geodetector results for the overall basin
The Geodetector results for the entire basin are listed in Table 3. The top three individual influencing factors associated with the NDVI distribution were precipitation with a q-statistic of 0.53, elevation with a q-statistic of 0.52, and soil type with a q-statistic of 0.50. In large-scale regions, climatic factors are critical to the spatial variations in NDVI, with precipitation being the most significant factor in arid and semi-arid areas (Gao et al., 2012). The spatial pattern of the precipitation exhibited a gradually decreasing trend from the south to the north, indicating the natural water supply distribution for vegetation, thus resulting in the NDVI distribution exhibiting a similar pattern. The supply of water and temperature both vary with elevation, influencing the growth of vegetation and the distribution of the vegetation types. Additionally, the soil type has an important influence on the vegetation (NDVI) distribution by providing nutrients and water directly to the vegetation.
Table 3 Factor/factor interaction results for the Heihe River Basin
Factor /Interaction q-statistic
First ranking factor Precipitation 0.53
Second ranking factor Elevation 0.52
Third ranking factor Soil type 0.50
First interaction Soil type∩Humiditya 0.68
Second interaction Soil type∩Elevationa 0.634
Third interaction Soil type∩Precipitationa 0.629

Note: a indicates the interaction was bienhanced, represented by the q-statistic of interaction being larger than that of the two individual factors.

While the interaction between humidity and soil type was the dominant interaction, with an enhanced q-statistic of 0.68, this was followed closely by the interaction between the soil type and the elevation and that between the soil type and the precipitation (both having a q-statistic approximately equal to 0.63).
3.2.3 Geodetector results for sub-basin
In the upper basin, the dominant factor was elevation (q-statistic = 0.30) while the second one was humidity (q-statistic = 0.27). The distribution of the hydrothermal conditions varies with the elevation, thus influencing vegetation growth and distribution of the vegetation types. The interaction between the elevation and humidity and that between the elevation and precipitation accounted for 52% and 46%, respectively, of the spatial variations of NDVI. In this region, 66% of the area is covered by natural vegetation, such that the NDVI is higher than that in the middle and lower basins. Additionally, there is relatively little human activity, given the higher elevation and lower temperature, such that the NDVI distribution in this region is dominated by the climate and terrain, as evidenced by the q-statistics obtained for the individual factors and interactions (Table 4).
Table 4 Factor/factor interaction results for sub-basins in the Heihe River Basin
Region Individual factor Interaction
First ranking factor q-statistic Second ranking factor q-statistic First ranking interaction q-statistic Second ranking interaction q-statistic
Upper basin Elevation 0.30 Humidity 0.27 Elevation∩Humiditya 0.52 Elevation∩Precipitationa 0.46
Middle basin Precipitation 0.36 Soil type 0.33 Soil type∩Humiditya 0.55 Precipitation∩Soil typea 0.50
Lower basin Soil type 0.13 Precipitation 0.05 Precipitation∩Soil typeb 0.22 Soil type∩Humidityb 0.18

Note: a indicates an interaction bienhancement (in the same way as in Table 2), determined by the q-statistic of interaction being larger than that of the two individual factors; b indicates that the interactions nonlinearly enhance each other, as indicated by the q-statistic of interaction being greater than the sum of the two individual factors.

In the middle basin, the factor having the greatest influence was found to be precipitation, with a q-statistic of 0.36, followed closely by the soil type (q-statistic = 0.33). The interaction between the soil type and humidity and that between the soil type and precipitation accounted for 55% and 50% of the spatial variations in NDVI, respectively. In this region, croplands relied mainly on irrigation water being drawn from the river as well as pumped groundwater, accounting for 12.7% of the area. Furthermore, human activity was relatively intensive. The spatial distributions of pumped groundwater and that drawn from the river were not available, thus we could not analyze the data using Geodetector. Instead, the soil types providing the water and nutrients for the vegetation growth provided us with an alternative variable. The Geodetector results supported the finding that the NDVI distribution was not only influenced by precipitation, but also by irrigation.
The dominant factor in the lower basin was soil type (q-statistic = 0.13), followed by precipitation with a q-statistic of approximately 0.05. However, the dominant interaction between the elevation and soil type was bilinearly enhanced (q-statistic = 0.22, exceeding the sum of 0.13 and 0.05). In the lower basin, the annual precipitation was < 50 mm, while the evaporation was > 1000 mm (Ma et al., 2006). Therefore, the water needed for vegetation growth along the river is mainly groundwater. The vegetation growth is directly dependent on the moisture in the soil, which is determined by the sources of groundwater, while the soil types affect their ability to store water. The spatial distribution of the water table was not available, so we could not subject this data to a Geodetector analysis. However, the soil type variable could be assumed to be related to the moisture in the soil to a certain degree. This result indicated that the soil type was the dominant factor, thus supporting this assumption.
In summary, there are differences between the dominant factor and dominant interaction for the NDVI distribution across the entire basin and the sub-basins, as listed in Tables 3 and 4, which show the spatial heterogeneous associations between NDVI and environmental factors in the HRB.

4 Discussion

The terrain in the HRB varies significantly from the south to the north. However, the NDVI is rarely affected by the topography, making it a better index for capturing vegetation variations in areas with complex terrain (Matsushita et al., 2007; Jiang et al., 2015). The major ecological system types in the HRB are grasslands, croplands, and forests (mainly deciduous), such that the NDVI is not subject to saturated signals caused by large amounts of biomass (Huete, 1988). Given the above, the NDVI used in our study was reasonable. The 250-m resolution MODIS-NDVI data can provide finer-scale information on vegetation than either AVHRR-NDVI or VGT-NDVI. Therefore, we used MODIS-NDVI data.
The commonly used methods for detecting the relationship between vegetation and the influential variables include correlation analysis (Ichii et al., 2002; Tong et al., 2017), linear regression (Peng et al., 2012; Ma et al., 2017), and geographically weighted regression (GWR). The correlation analysis and linear regression do not estimate the spatial relationships between the NDVI and its influencing geographical variables (Li et al., 2011), while GWR is introduced to explore the spatial relationships between the NDVI and climatic variables (Brunsdon et al., 1998; Gao et al., 2012; Georganos et al., 2017). However, GWR possibly suffers from multicollinearity problems (Gao et al., 2012).
Geodetector, used in this study, is a new tool for investigating the spatial associations between independent variables (seven environmental factors) and a dependent variable (NDVI). The q-statistic indicates the degree of influence of each of the seven environmental factors in the NDVI. The Geodetector method assumes a non-linear relationship with the variable, and is a type of analysis of variance (ANOVA). It can detect the interaction between two variables and avoid multicollinearity problems (Wang et al., 2012, 2016). Thus, Geodetector was found to be well suited to our study. However, Geodetector is not problem-free. The input variables of Geodetector are categorized variables, such that the continuous numerical variables must be categorized, leading to a major problem regarding the number of types into which the continuous numerical variables in the spatial distribution (e.g. elevation or precipitation) are divided. However, prior knowledge or the optimal classification methods (natural breaks, etc.) for variables helped us to identify the relatively optimal q-statistic (Wang et al., 2017; Du et al., 2017). Additionally, we conducted the Geodetector five times (five q-statistics) to obtain the average q-statistic to ensure the results were robust for the entire basin and sub-basins.
The findings on the spatial relationships between the NDVI and environmental factors were partially consistent with the results of several previous studies. In two studies addressing the HRB, Ma et al. (2006) indicated that precipitation was the major climatic factor affecting changes in the vegetation cover in this arid region. Sun et al. (2015) showed that water availability was the main factor influencing vegetation growth in the HRB. In studies addressing larger areas, Wang et al. (2015) found that precipitation in the arid regions of Northwest China had a more significant impact on the vegetation. Additionally, Zhu et al. (2012) pointed out that moisture was one of the main limiting factors in arid regions, with precipitation being the most important source of water. In this study, we found that the precipitation was the dominant factor influencing the overall basin, given the q-statistic of 0.53 (Table 3). The q-statistic is akin to the coefficient of determination in other models (e.g. linear regression), in that it indicates the degree to which the independent variables determine (seven environmental variables) the variations in the dependent variable (NDVI).
The results of our study pointed to heterogeneity in the spatial variations of the NDVI and the spatial associations between the NDVI and environmental factors in the HRB. However, the association between the NDVI and the dominant interaction in the middle basin, where vegetation growth was also influenced by irrigation from the river and pumped groundwater, was lower than that in the upper basin, indicating that the associations between the NDVI and vegetation in areas with intense human activity were more complex, giving rise to a lower degree of certainty with a lower q-statistic. Additionally, regarding the association between the NDVI and the dominant interaction in the lower basin, the vegetation along the river relied on groundwater (Sun et al., 2015), as we could not obtain this data, the q-statistic would be lower. However, the result still indicated that the soil type and its relationship with the soil moisture was the dominant factor, implying that the Geodetector results were reliable in the lower basin.

5 Conclusions

The objectives of this study were to investigate the spatial features of the NDVI and its spatial associations with the seven influencing factors in the HRB. In order to achieve the objectives, we analyzed the spatial distribution and the trend of the NDVI based on 250-m MODIS-NDVI data covering the HRB from 2000 to 2016. Then, we utilized Geodetector method to explore the strength of the seven factors affecting the NDVI distribution. The main results of our study are as follows.
(1) From the spatial distribution and the trend of the NDVI in the HRB, we found that the spatial distribution of the NDVI in the HRB tended to decrease from the southeast to the north, as characterized by the spatial heterogeneity with a q-statistic of 0.38. Furthermore, the spatial trend in the vegetation areas in the HRB exhibited a generally increasing trend in the growing season in the three sub-basins from 2000 to 2016.
(2) The results of Geodetector method showed that the dominant factors and the dominant interactions exhibited spatial heterogeneity in the associations between the NDVI and the environmental factors for the overall basin and the sub-basins. The dominant factor was precipitation for the overall basin, which was consistent with the results of previous studies, in that water availability was the controlling factor affecting the NDVI distribution in large arid areas. In the upper basin, the dominant factor was found to be elevation (q-statistic = 0.30), while the interaction between the humidity and elevation was dominant with a q-statistic of 0.52. The dominant factor in the middle basin was precipitation (q-statistic = 0.36), closely followed by the soil type (q-statistic = 0.33), while the dominant interaction was that between the soil type and humidity. In the lower basin, the dominant factor was the soil type (q-statistic = 0.13), and the dominant interaction between the elevation and soil type was nonlinearly enhanced.
In our future studies, we will attempt to use some complexity analysis methods (Gao et al., 2019) to explore the spatiotemporal characteristics of NDVI variations. Such methods (e.g., the permutation entropy) have been used in hydrology (Ning et al., 2018) and soil temperature (Ning et al., 2019). The result of the permutation entropy of NDVI time-series probably will provide us new insight into spatiotemporal variations of the NDVI in the HRB. Furthermore, we will attempt to collect water table data and human activity data to study the interactions between natural and human activity factors in the HRB. In the middle and lower basins, groundwater provided the source for irrigating the croplands as well as that for vegetation growth. We could not incorporate the groundwater in our analysis for no access to water table. However, vectorizing the water table data used by Mi et al. (2015) probably provided us an alternative for water table data. In addition, human activities also affect the distribution of vegetation as a result of changes in the land use, increases in urban areas, and so on. Thus, we will try to collect human activity factors, such as population density data. By incorporating both natural and human activity data into Geodetector, we can quantify the spatial associations between NDVI and natural and human activity factors, and the interactions between natural and human activity factors.

Acknowledgment

We would like to thank the high-performance computing support from the Center for Geodata and Analysis, Faculty of Geographical Science, Beijing Normal University [https://gda. bnu.edu.cn/].
[1]
Ballantyne A, Smith W, Anderegg W et al., 2016. Accelerating net terrestrial carbon uptake during the warming hiatus due to reduced respiration. Nature Climate Change, 7:148-152.

[2]
Brunsdon C, Fotheringham S, Charlton M . 1998. Geographically weighted regression-modelling spatial non-stationarity. Journal of the Royal Statistical Society, 47(3):431-443.

[3]
Chen J, Jonsson P, Tamura M et al., 2004. A simple method for reconstructing a high quality NDVI time-series data set based on the Savitzky-Golay filter. Remote Sensing of Environment, 91:332-344.

[4]
Cheng G D, Li X, Zhao W Z et al., 2014. Integrated study of the water-ecosystem-economy in the Heihe River Basin. National Science Review, 1(3):413-428.

[5]
Du Z Q, Zhang X Y, Xu X M et al., 2017. Quantifying influences of physiographic factors on temperate dryland vegetation, Northwest China. Scientific Reports, 7:40092.

[6]
Fang J, Piao S, Tang Z et al., 2001. Interannual variability in net primary production and precipitation. Science, 293(5536):1723-1723.

[7]
Fang J Y, Piao S L, Zhou L et al., 2005. Precipitation patterns alter growth of temperate vegetation. Geophysical Research Letters, 32(21):365-370.

[8]
Fensholt R, Langanke T, Rasmussen K et al., 2012. Greenness in semi-arid areas across the globe 1981-2007: An earth observing satellite based analysis of trends and drivers. Remote Sensing of Environment, 121(2):144-158.

[9]
Forzieri G, Alkama R, Miralles D G et al., 2016. Satellites reveal contrasting responses of regional climate to the widespread greening of Earth. Science, 356:1180-1184.

[10]
Gao J, Li S, Zhao Z et al., 2012. Investigating spatial variation in the relationships between NDVI and environmental factors at multiscales: A case study of Guizhou Karst Plateau, China. International Journal of Remote Sensing, 33(7):2112-2129.

[11]
Gao J B, Fang P, Yuan L H , 2019. Analyses of geographical observations in the Heihe River Basin: Perspectives from complexity theory. Journal of Geographical Sciences, 29(9):1441-1461.

[12]
Georganos S, Abdi A M, Tenenbaum D E et al., 2017. Examining the NDVI-rainfall relationship in the semi-arid Sahel using geographically weighted regression. Journal of Arid Environments, 146:64-77.

[13]
Han H, Ma M, Yan P et al., 2011. Periodicity analysis of NDVI time series and its relationship with climatic factors in the Heihe River Basin in China. Remote Sensing Technology & Application, 26(5):466-471. (in Chinese)

[14]
He B, Chen A F, Jiang W G et al., 2017. The response of vegetation growth to shifts in trend of temperature in China. Journal of Geographical Sciences, 27(7):801-816.

[15]
Holben B N , 1986. Characteristics of maximum-value composite images from temporal AVHRR data. International Journal of Remote Sensing, 7:1417-1434.

[16]
Huai B J, Li Z Q, Wang S J et al., 2014. RS analysis of glaciers change in the Heihe River Basin, Northwest China, during the recent decades. Journal of Geographical Sciences, 24(6):993-1008.

[17]
Huete A , 1988. A soil-adjusted vegetation index (SAVI). Remote Sensing of Environment, 25:295-309.

[18]
Ichii K, Kawabata A, Yamaguchi Y , 2002. Global correlation analysis for NDVI and climatic variables and NDVI trends: 1982-1990. International Journal of Remote Sensing, 23(18):3873-3878.

[19]
Jiang W G, Yuan L H, Wang W et al., 2015. Spatio-temporal analysis of vegetation variation in the Heihe River Basin. Ecological Indicators, 51:117-126.

[20]
Li S C, Zhao Z Q, Wang Y et al., 2011. Identifying spatial patterns of synchronization between NDVI and climatic determinants using joint recurrence plots. Environment Earth Science, 64(3):851-859.

[21]
Li X, Cheng G, Liu S et al., 2013. Heihe Watershed Allied Telemetry Experimental Research (HiWATER): Scientific objectives and experimental design. Bulletin of the American Meteorological Society, 94(8):1145-1160.

[22]
Luo W, Jasiewicz J, Stepinski T et al., 2016. Spatial association between dissection density and environmental factors over the entire conterminous United States. Geophysical Research Letters, 43(2):692-700.

[23]
Ma M G, Frank Veroustraete , 2006. Inter-annual variability of vegetation cover in the Chinese Heihe River Basin and its relation to meteorological parameters. International Journal of Remote Sensing, 27(16):3473-3486.

[24]
Ma W Y, Wang X M, Zhou N , 2017. Relative importance of climate factors and human activities in impacting vegetation dynamics during 2000-2015 in the Otindag Sandy Land, northern China. Journal of Arid Land, 9(4):558-567.

[25]
Matsushita B, Yang W, Chen J et al., 2007. Sensitivity of the Enhanced Vegetation Index (EVI) and Normalized Difference Vegetation Index (NDVI) to topographic effects: A case study in high-density cypress forest. Sensors, 7(11):2636-2651.

[26]
Mi L N, Xiao H G, Zhu W J et al., 2015. Dynamic variation of the groundwater level in the middle reaches of the Heihe River during 1985-2013. Journal of Glaciology and Geocryology, 37(2):461-469. (in Chinese)

[27]
Myneni R B, Hall F G , 1995. The interpretation of spectral vegetation indexes. IEEE Transaction on Geoscience & Remote Sensing, 33(2):481-486.

[28]
Ning L, Zhou Y, Yang J et al., 2018. Spatial-temporal variability of the fluctuation of water level in Poyang Lake Basin, China. Open Geosciences, 10(1):940-953.

[29]
Ning L X, Cheng C X, Shen S , 2019. Spatial-temporal variability of the fluctuation of soil temperature in the Babao River Basin, Northwest China. Journal of Geographical Sciences, 29(9):1475-1490.

[30]
Peng J, Liu Z, Liu Y et al., 2012. Trend analysis of vegetation dynamics in Qinghai-Tibet Plateau using Hurst Exponent. Ecological Indicators, 14(1):28-39.

[31]
Piao S, Fang J, Wei J et al., 2004. Variation in a satellite-based vegetation index in relation to climate in China. Journal of Vegetation Science, 15(2):219-226.

[32]
Piao S, Nan H, Huntingford C et al., 2014. Evidence for a weakening relationship between interannual temperature variability and northern vegetation activity. Nature Communications, 5:5018.

[33]
Raynolds M K, Comiso J C, Walker D A et al., 2008. Relationship between satellite-derived land surface temperatures, arctic vegetation types, and NDVI. Remote Sensing of Environment, 112(4):1884-1894.

[34]
Seddon A W, Maciasfauria M, Long P R et al., 2006. Sensitivity global terrestrial ecosystems to climate variability. Nature, 531(7593):229-232.

[35]
Shen S, Ye S J, Cheng C X et al., 2018. Persistence and corresponding time scales of soil moisture dynamics during summer in the Babao River Basin, Northwest China. Journal of Geophysical Research: Atmospheres, 123: 8936-8948. .

[36]
Song C Q, Yuan L H, Yang X F et al., 2017. Ecological-hydrological processes in arid environment: Past, present and future. Journal of Geographical Sciences, 27(12):1577-1594.

[37]
Sun W, Song H, Yao X et al., 2015. Changes in remotely sensed vegetation growth trend in the Heihe Basin of arid northwestern China. Plos One, 10(8):e0135376.

[38]
Tong S, Zhang J, Bao Y et al., 2018. Analyzing vegetation dynamic trend on the Mongolian Plateau based on the Hurst exponent and influencing factors from 1982-2013. Journal of Geographical Sciences, 28(5):595-610.

[39]
Tong S Q, Zhang J Q, Bao Y H et al., 2017. Spatial and temporal variations of vegetation cover and the relationships with climate factors in Inner Mongolia based on GIMMS NDVI3g data. Journal of Arid Land, 9(3):394-407.

[40]
Tucker C, Seller P , 1986. Satellite remote sensing of primary production. International Journal of Remote Sensing, 7:1395-1416.

[41]
Udelhoven T, Stellmes M, Del Barrio G , 2009. Assessment of rainfall and NDVI anomalies in Spain (1989-1999) using distributed lag models. International Journal of Remote Sensing, 30(8):1961-1976.

[42]
Wang J F, Hu Y , 2012. Environmental health risk detection with Geogetector. Environmental Modelling & Software, 33:114-115.

[43]
Wang J F, Li X H, Christakos G et al., 2010. Geographical detectors-based health risk assessment and its application in the neural tube defects study of the Heshun region, China. International Journal of Geographical Information Science, 24(1):107-127.

[44]
Wang J F, Xu C D , 2017. Geodetector: Principle and prospective. Acta Geographica Sinica, 72(1):116-134. (in Chinese)

[45]
Wang J F, Zhang T L, Fu B J , 2016. A measure of spatial stratified heterogeneity. Ecological Indicators, 67:250-256.

[46]
Wang W, Feng Q S, Guo N et al., 2015. Dynamic monitoring of vegetation coverage based on long time-series NDVI data sets in northwest arid region of China. Pratacultural Science, 32(12):1969-1979.

[47]
Xiong Z , 2014. Impact of different convective parameterization on simulation of precipitation for the Heihe River Basin. Advances in Earth Science, 29(5):290-297. (in Chinese)

[48]
Xiong Z, Yan X D , 2013. Building a high-resolution regional climate model for the Heihe River Basin and simulating precipitation over this region. Chinese Science Bulletin, 58:4670-4678.

[49]
Xu Q, Dong Y, Wang Y et al., 2018. Determinants and identification of the northern boundary of China’s tropical zone. Journal of Geographical Sciences, 28(1):31-45.

[50]
Zhang T, Shen S, Cheng C X et al., 2018. Long-range correlation analysis of soil temperature and moisture on A’rou hillsides, Babao River Basin. Journal of Geophysical Research: Atmospheres, 123: 12606-12620. .

[51]
Zhao X, Tan K, Zhao S et al., 2011. Changing climate affects vegetation growth in the arid region of the northwestern China. Journal of Arid Environments, 75(10):946-952.

[52]
Zhu Y J, Wu B, Lu Q , 2012. Progress in the study on response of arid zones to precipitation change. Forest Research, 25(1):100-106. (in Chinese)

Outlines

/