Spatial patch structure and adaptive strategy for desert shrub of Reaumuria soongorica in arid ecosystem of the Heihe River Basin

  • LI Wei 1, 2, 3 ,
  • LI Xiaoyan , 1, 3, * ,
  • HUANG Yongmei 1, 3 ,
  • WANG Pei 1, 3 ,
  • ZHANG Cicheng 3
Expand
  • 1 State Key Laboratory of Earth Surface Processes and Resource Ecology, Beijing Normal University, Beijing 100875, China
  • 2 School of Land Resources & Urban and Rural Planning, Hebei GEO University, Shijiazhuang 050031, China
  • 3 School of Natural Resources, Faculty of Geographical Science, Beijing Normal University, Beijing 100875, China
*Li Xiaoyan, PhD and Professor, specialized in ecohydrological processes and hydropedology. E-mail:

Li Wei (1987–), PhD, specialized in ecohydrological processes and water resource management. E-mail: liwei19870316@hotmail.com

Received date: 2019-01-30

  Accepted date: 2019-03-30

  Online published: 2019-12-11

Supported by

National Natural Science Foundation of China(No.91425301)

National Natural Science Foundation of China, No.91425301(No.41730854)

The PCSIRT(No.IRT-15R06)

Scientific Research Starting Foundation for Doctors in Hebei GEO University(No.BQ2017003)

Copyright

Copyright reserved © 2019. Office of Journal of Geographical Sciences All articles published represent the opinions of the authors, and do not reflect the official policy of the Chinese Medical Association or the Editorial Board, unless this is clearly specified.

Abstract

In many arid ecosystems, vegetation frequently occurs in high-cover patches interspersed in a matrix of low plant cover. However, theoretical explanations for shrub patch pattern dynamics along climate gradients remain unclear on a large scale. This context aimed to assess the variance of the Reaumuria soongorica patch structure along the precipitation gradient and the factors that affect patch structure formation in the middle and lower Heihe River Basin (HRB). Field investigations on vegetation patterns and heterogeneity in soil properties were conducted during 2014 and 2015. The results showed that patch height, size and plant-to-patch distance were smaller in high precipitation habitats than in low precipitation sites. Climate, soil and vegetation explained 82.5% of the variance in patch structure. Spatially, R. soongorica shifted from a clumped to a random pattern on the landscape towards the MAP gradient, and heterogeneity in the surface soil properties (the ratio of biological soil crust (BSC) to bare gravels (BG)) determined the R. soongorica population distribution pattern in the middle and lower HRB. A conceptual model, which integrated water availability and plant facilitation and competition effects, was revealed that R. soongorica changed from a flexible water use strategy in high precipitation regions to a consistent water use strategy in low precipitation areas. Our study provides a comprehensive quantification of the variance in shrub patch structure along a precipitation gradient and may improve our understanding of vegetation pattern dynamics in the Gobi Desert under future climate change.

Cite this article

LI Wei , LI Xiaoyan , HUANG Yongmei , WANG Pei , ZHANG Cicheng . Spatial patch structure and adaptive strategy for desert shrub of Reaumuria soongorica in arid ecosystem of the Heihe River Basin[J]. Journal of Geographical Sciences, 2019 , 29(9) : 1507 -1526 . DOI: 10.1007/s11442-019-1674-2

1 Introduction

Worldwide, vegetation is discontinuously distributed in drylands, with a mosaic landscape of high plant-cover patches (shrubby patches) interspersed with low-cover (grass patches) or bare soil matrix (Aguiar and Sala, 1999; Hu et al., 2011; Kröpfl et al., 2013; Ravolainen et al, 2013; Cipriotti and Aguiar, 2015). The patchy vegetation not only modifies the spatial patterns of water, carbon and nutrient resources but also serves as an indicator of ecosystem functions and health (Ludwig et al., 2005; Kéfi et al., 2007; Segoli et al., 2008; Harman et al., 2014). Constrained by multiple biotic and abiotic factors, shrub patch structures characterized by patch configuration and spatial pattern have distinctive features. Therefore, recognizing spatial patch structure and revealing key influencing variables (biotic and abiotic factors) will improve our understanding of patch pattern formation mechanisms and corresponding plant ecological strategies and optimization. Previous studies have attributed shrub patch configuration and pattern changes to respective abiotic processes related to water allocation through runoff and infiltration, heterogeneous topography and biotic community competition for the limited nutrients available in savanna (Ludwig et al., 2005; Du et al., 2012; Harman et al., 2014), shrub-encroached grassland (Chen et al., 2014) and desert. However, the relations between shrubby structures and synthetic abiotic (climate and soil) and biotic variables at large scales remain uncertain in the Gobi Desert.
Shrub patch structure is likely to be formed over decades and is driven by climate, soils, and vegetation (biotic community competition). Climate is the dominant factor that influences the patterns of patch structure and ecological attributes (Bai et al., 2008). Shrub cover and patch size largely depend on the mean annual precipitation (MAP) from shrub- encroached grasslands to desert grasslands (Chen et al., 2014; Xie et al., 2015; Holthuijzen and Veblen, 2015). For example, the MAP and mean annual temperature (MAT) explain 52% and 12%, respectively, of the variation in shrub cover and species richness in Patagonian rangelands (Gaitán et al., 2014). For shrub-encroached grasslands, shrub cover and patch size were greater in dry and warm habitats than in moist and cool sites (Chen et al., 2014), while 84.2% and 55.7% of the variance in shrub cover and height was explained by MAP and MAT, respectively (Fan et al., 2017). Likewise, shrub density and its biomass allocation were also influenced by precipitation. Precipitation positively influenced plant production in Inner Mongolian grasslands (Kang et al., 2013). For temperate grasslands, the aboveground biomass (AGB), belowground biomass (BGB) and vertical pattern of the root were positively correlated with MAP variation (Ma et al., 2008). Shrub density was negatively correlated with MAP in shrub-encroached grasslands (Chen et al., 2014) but significantly increased with rainfall in savanna systems (Shackleton and Scholes, 2011). The difference was attributed to the uncertainty and variability along a gradient of precipitation and water availability. Apart from climatic variables, spatial heterogeneity in edaphic conditions can produce corresponding patchiness in the structure and distribution of woody vegetation (Sileshi et al., 2010). The edaphic index can be defined as the soil resource distribution (nutrients and moisture) and texture. Shrub patch size and cover increased with soil nutrients in shrub-encroached grasslands (Chen et al., 2014). The AGB and BGB were also positively associated with soil organic carbon, while the below-aboveground biomass ratio (B/A) was positively associated with total soil nitrogen (Kang et al., 2013). Likewise, the spatial heterogeneity of subsurface soil texture could affect soil resource redistribution and the abundance and distribution of roots. Coarse-textured subsoil allows greater infiltration and deeper percolation, and these soil moisture conditions are suitable for the establishment and persistence of deep-rooted mosaic-pattern vegetation (Schwinning et al., 2003); in contrast, fine-textured subsoil would amplify the seasonal variability in shallow soil moisture, which causes plant stress and favors the survival of disparate short plants (Dunkerley and Brown, 1999, Schenk and Jackson, 2005). In temperate grasslands, however, the effect of soil texture on the vertical distribution of roots was weak (Ma et al., 2008). This difference might arise because of the small range in soil texture or small changes in relation to functional group composition among grassland types. Moreover, vegetation structures are the result of intrinsic self-organized mechanisms related to the performance of dominant species and species interactions. Plant species richness and grass-shrub balance play important roles as drivers of ecosystem functioning. Previous studies have shown that the configuration of shrub patches was clearly related to the diversity of adjacent herbaceous vegetation (Ravolainen et al., 2013), while native vegetation, such as diverse habitats with tall vegetation, was likely more resistant to shrub encroachment (Chen et al., 2014). Therefore, the frequency and efficacy of facilitative grass-shrub interactions were recognized to stimulate shrub cover and patch density, community biodiversity, and ecosystem stability and were then positively correlated with increasing precipitation (Holthuijzen and Veblen, 2015). Therefore, the shrub patch structure is considered to be a long-term evolutionary response to environmental factors and an equilibrium state during interspecific competition for space. However, the variation in patch structure along a drought gradient and its response to combined climate, soil and vegetation factors are still lacking.
The spatial pattern of patchy vegetation is assumed to be an ecological adaptive strategy phenomenon. Limited by water availability and plant habitat properties, different vegetation patterns, such as bands (Valentin et al., 1999; Merino-Martín et al., 2012), rings (Ravi et al., 2007), stripes (Mauchamp et al., 1993) and spots (Couteron and Lejeune, 2001), were found at the landscape scale. Previous studies have attributed these patterns to variations in rainfall amount and corresponding water reallocation through runoff and infiltration, spatial heterogeneity in topography, and unidirectional wind in different ecosystems. For example, the shrub spatial pattern exhibited a clumped pattern in wet areas and a random pattern in arid areas (Dan and Jeltsch, 2007), while the spatial distribution pattern of the subshrub Caragana stenophylla changed from a random to a clumped pattern as precipitation decreased (Xie et al., 2015). Additionally, the distribution of grove vegetation in subtropical savannas was regulated by the spatial heterogeneity of subsurface soil texture, where subsurface non-argillic inclusions might favor the establishment and persistence of groves by enabling deeper root penetration into the profile (Zhou et al., 2017). However, few studies have attempted to identify vegetation adaptive strategies based on patch pattern variance and its integrated interactions with climate, soil, and vegetation.
The Heihe River Basin (HRB) is the second largest inland river in northwestern China. Influenced by regional climate change and intensifying human water demands, the HRB has suffered from serious water-related eco-environmental problems in the past two decades. Desert, which occupies over 72% of the total area of the HRB, is widely spread in the middle and lower HRB. However, until recently, little attention has been focused on the desert ecosystem structure and function in this basin. Reaumuria soongorica is one of the typical dominant C3 plant species in the desert and semi-desert regions of northwestern China (Casati et al., 2011). It is widely distributed in the piedmont, river terraces and Gobi areas of the HRB, where the MAP is usually less than 200 mm. Previous studies have focused on the morphological structure, water use strategy, eco-physiological response and drought tolerance of R. soongorica in different habitat conditions (Su et al., 2012; Fu et al., 2014; Liu et al., 2015, Zhang et al., 2017; Luo et al., 2018). The results of these studies indicated that R. soongorica was discontinuously distributed and exhibited excellent tolerability to low water availability, extreme temperature fluctuations and nutrient deprivation. However, most of these studies were conducted at small scales, such as field sites and simulated experiments. Research about the community structure and drought adaptive strategy at the landscape scale remains scarce. In this study, we investigated the vegetation community and spatial heterogeneity of the soil properties of R. soongorica along the MAP gradient in the middle and lower HRB. The specific objectives were as follows: (1) to determine whether there were significant differences in the spatial patch configuration and community structure of R. soongorica along the precipitation gradient in the middle and lower HRB; (2) to examine the mechanisms underlying the variation in patch structure with synthetic climatic, edaphic, and vegetative variables; and (3) to explore the drought adaptive strategy of R. soongorica under different environmental conditions.

2 Materials and methods

2.1 Study area

The study was carried out in the middle and lower HRB, Northwest China (37.70°-42.75°N, 97.40°-102.15°E). The Heihe River originates from the summit glaciers of the Qilian Mountains, and then it flows northwestward through the Hexi Corridor in Gansu Province and diverges into several branches at the Ejina Oasis; finally, the river enters Juyan Lake in the Ejina of the Inner Mongolia Plateau, with an elevation of 872-3556 m above sea level. The study areas are located in the piedmont alluvial plain of the middle reaches and the alluvial plain of the lower reaches (Figure 1).
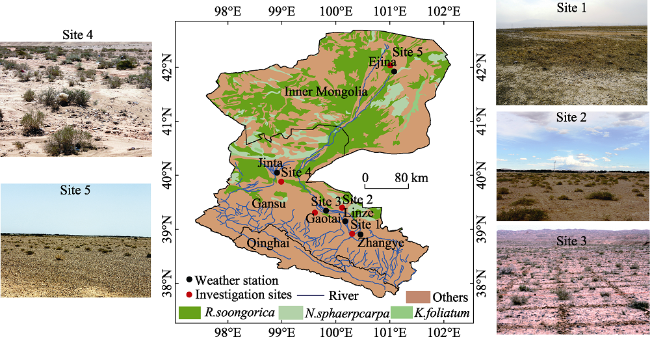
Figure 1 Location of the Heihe River Basin: field investigation sites (red dots) and corresponding weather stations (black dots); others are images of the landscape and typical shrubs at the study sites
The MAT is 7℃, and the MAP is 71 mm, with a maximum value of approximately 140 mm and a minimum value of <35 mm. The mean annual potential evaporation is 1410-3755 mm, and this value decreases as elevation increases. The main vegetation type is Reaumuria soongorica, and the associated other species are Salsola passerine, Nitraria sphaerocarpa, Kalidium foliatum, and Haloxylon ammodendron. The main soil textures are sandy loam and sandy soil with abundant gravels according to the US Department of Agriculture (USDA) Soil Taxonomy (Soil Survey Staff, 1987), and the main soil type is grayish-brown desert soil and gray desert soil according to the Chinese Soil Classification (Su et al., 2007). Moreover, the spatial heterogeneity in the surface-soil properties, which was occupied by biological soil crust (BSC) and bare soil patch with fine gravels (BG), was found on the landscape in the middle and lower HRB (Figure 2).
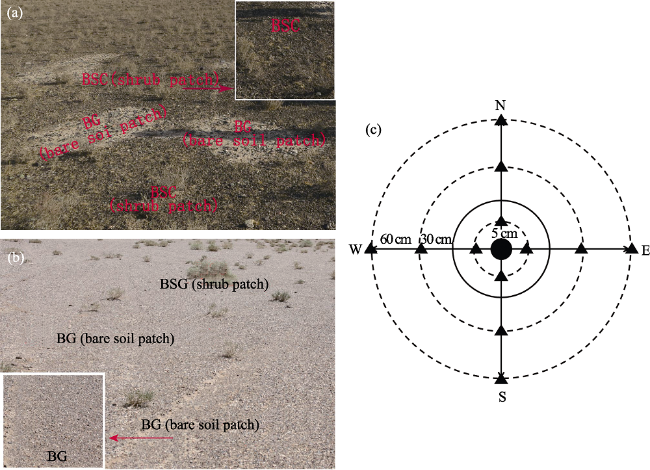
Figure 2 Spatial heterogeneity in surface soil properties, consisting of biological soil crust (BSC) developed with shrub patch and bare soil patch covered with fine gravels (BG) at (a) Site 1 and (b) Site 5; (c) surface soil sampling design for individual shrubs, the bold rings represent the average extent of shrub size

2.2 Field investigation

Five sample sites (Sites 1-5) were selected through a south-north transect along a precipita-tion gradient to investigate the heterogeneity of the shrub patch structure and spatial pattern from June to July in 2014 and 2015 (Figure 1 and Table 1). To avoid bias from community heterogeneity, we set up three randomized 25 m × 25 m plots at each site. First, we recorded the geographical coordinates and elevation for each plot. Second, for the shrub patch, we recorded the shrub names and shrub cover (KA) and measured the crown diameter and height (H) of all shrub patches in each 25 m × 25 m plot. The structure of shrub patches, e.g., mean patchiness size (individual patch perimeter (P) and canopy area (A)), number (N) and density (C), were processed and calculated using ArcGIS 10.1 and Fragstats 4. Finally, for the R. soongorica community, we used the species richness, Simpson index, and Shannon-Wiener index to describe the alpha biodiversity index. Species richness was defined as the total number of species occurring per unit area in the quadrats. Then, the Simpson index, Shannon-Wiener index and importance value were calculated. The AGB was sampled by clipping three replicated live vegetation samples (green biomass) rooted to the ground surface for R. soongorica, K. foliatum, and N. sphaerocarpa. The BGB was determined by digging within the estimated area of the shrub roots at depths ranging from 0 to 100 cm (to 240 cm) at 10-cm (or 20-cm) intervals. All the AGB and BGB plant materials were oven dried at 65°C to constant weight for the determination of biomass.
Table 1 Summary of climate and soil properties in the middle and lower Heihe River Basin
Site 1
Piedmont Gobi desert
Site 2
Piedmont Gobi desert
Site 3
Piedmont Gobi desert
Site 4
Gobi desert
Site 5
Gobi desert
Longitude 100.30°E 100.12°E 99.61°E 98.99°E 101.01°E
Latitude 38.91°N 39.40°N 39.31°N 39.88°N 42.04°N
Elevation (m) 1473 1442 1355 1413 940
Main shrub R.soongorica;
S.passerine
R.soongorica;
N.sphaerpcarpa
R.soongorica;
K.foliatum
R.soongorica;
N.sphaerpcarpa
R.soongorica;
H.ammodendron
MAP (mm) 122.93a 112.29b 100.33b 65.70c 35.02d
MAT (℃) 7.32a 7.99ab 7.87bc 9.02d 9.11e
Sand content (%) 57.65 89.85 86.82 89.44 97.51
Silt content (%) 39.46 8.13 11.50 8.75 1.68
Clay content (%) 2.89 2.02 1.68 1.81 0.81
SOM content (%) 1.97 0.97 0.73 1.84 0.62
TN content (%) 0.09 0.02 0.05 0.02 0.01
CaCO3 content (%) 44.12 30.71 14.64 42.57 35.61
BSC:BG 0.13:1 0.09:1 0.06:1 0.06:1 0.02:1

Note: Different letters donate different means at 95% confidence level. MAP is mean annual precipitation (mm); MAT is mean annual temperature (℃); soil particles including sand, silt and clay content is defined in 0-10 cm depth; SOM is soil organic matter in 0-10 cm depth; TN is total N in 0-10 cm depth and CaCO3 is defined in 0-10 cm depth; BSC:BG is the ratio of biological soil crust and gravel content at soil surface.

2.3 Spatial plant pattern and population distribution

The spatial pattern of R. soongorica was determined by quantifying plant distance (PD), which was the Euclidean distance between plant centers to the nearest shrub base, for every location in the plots (Bedford and Small, 2008). Two statistical techniques were employed to analyze the spatial variability of PD: mean value and standard deviation. Second, each sample plot was further divided into 0.5 m × 0.5 m, 1 m × 1 m, and 5 m × 5 m net subplots based on Greig-Smith (1983). The number of R. soongorica plants and coverage were recorded in every subplot. The “variance to mean ratio (V/m)” proposed by Greig-Smith (1983) was used to analyze the population distribution pattern:
$V=\sum\limits_{i=1}^{n}{\frac{{{\left( {{X}_{j}}-m \right)}^{2}}}{n-1}}$
$m=\frac{1}{n}\sum\limits_{j=1}^{n}{{{X}_{j}}}$
where V is the variance, Xj is the number of plants of each species in every subplot within a sample plot, m is the mean number of plants of each species in all subplots, and n is the number of subplots in one sample plot.
If V/m = 1, for a random spatial population distribution pattern;
If V/m > 1, for a clumped distribution, and
If V/m < 1, for a uniform distribution.

2.4 Climate variables

The mean daily air temperature (℃) and mean daily precipitation (mm) of the five sample sites were obtained for the period of 1960-2010 from the National Climatic Centre of the China Meteorological Administration. We found that approximately 75%-89% of precipitation mainly occurred in summer and was characterized by a relatively high intensity. The MAP from Site 1 to Site 5 was 122.93 mm > 112.29 mm > 100.33 mm > 65.70 mm > 35.02 mm, respectively.

2.5 Soil moisture

The soil moisture under shrub patches and interspaces (bare soil patches) was measured three times a month, respectively, during the growing season. Three replicated soil samples were taken across shrub patches and adjacent bare soil patches at 10-cm/20-cm intervals (0-10, 10-20, 20-30, 30-40, 40-60, 60-80, 80-100, 100-120, 120-160, and 160-200 cm) using a 5-cm soil auger at five sample sites. These soil samples were oven dried at 105℃ for 48 h. Additionally, the surface soil moisture (0-5 cm) was further measured following the heterogeneity in the BSG and BG. Ten R. soongorica individuals were randomly selected in each plot at sites 1, 2 and 5. The sampling locations were (1) below the shrub canopy, approximately 5 cm from the shrub base, (2) at the canopy periphery, approximately 30 cm from the base and (3) beyond the canopy in the interspaces, approximately 60 cm from the shrub base (Figure 2c). The surface soil moisture ratio (BSC:BG) was then used to denote the heterogeneity in the surface soil moisture (fertile effects).

2.6 Soil particles, soil organic matter and total nitrogen

Soil samples were collected to measure grain size particles, soil organic matter (SOM) and total nitrogen (TN) within each plot, and samples were collected at depths of 0, 5-10, 10-20, 20-40, 40-60, and 60-100 cm. Samples were air-dried and then sieved to pass through a 2-mm screen. Soil particle size, including sand (2000-50 μm), silt (50-2 μm) and clay (<2 μm) fractions, was determined by a Longbench Mastersizer 2000 laser particle-size analyzer (Malvern instruments, Malvern, English). Organic carbon was determined by the method of Walkley and Black (1934) and converted to SOM by multiplying by 1.74. The TN content was determined by the Kjeldahl method (Bremmer and Mulvaney, 1982) (Table 1). Moreover, the surface soil properties ratio was proposed to quantify the spatial heterogeneity in the surface edaphic conditions (fertile effects).

2.7 Statistical analysis

The differences in measured R. soongorica patch structure and community characteristics were quantified based on one-way analysis of variance (ANOVA) and Fisher’s protected least significant difference (LSD). Pearson’s rank correlation test and partial correlation were used to assess the significance of relationships between patch spatial pattern, community characteristics and MAP, and physical properties of surface soil. Then, we used linear regression analysis and non-linear regression analysis to assess the effects of MAP and soil physical properties on the traits of plant communities and patch spatial patterns. Statistical analysis was completed at the P=0.01 and P=0.05 levels of confidence, respectively. All procedures were conducted with SPSS software 21.0 (SPSS Inc., USA) and SigmaPlot software 12.0 (Hearne Scientific Software Plc, Melbourne, Australia). CANOCO 4.5 software (Microcomputer Power Co., New York, USA) was used to conduct multivariate analysis using redundancy analysis (RDA) and principal components analysis (PCA) to study the effects of MAP and soil properties on shrub patch variation. Shrub patch height, size, density and PD were chosen as response variables, while MAP, soil properties (soil particle size and TN) and vegetation parameters (AGB and species richness) were selected as explanatory variables. The Monte Carlo permutation test was conducted to test the significance of the eigenvalues.

3 Results

3.1 Variations in shrub patch and community structure along precipitation gradient

The main shrub species in the middle and lower HRB is R. soongorica, which accounts for 63.4% to 95.1% of vegetation (ANOVA, P<0.05). R. soongorica occurred in a scattered pattern from Site 1 to Site 5, but a significant difference was observed in patch structure (Figure 3). In general, patch density declined with decreasing precipitation from Site 1 to Site 5 (1.68 > 1.08 > 0.57 > 0.08), while an increasing trend was found in patch height and size, namely, patch height ranged in the order of 10.2 cm < 17.5 cm < 17.6 cm < 23.1 cm, and size ranged in the order of 0.02 m2 < 0.04 m2 < 0.08 m2 < 0.2 m2. However, at Site 2, the R. soongorica patch exhibited a relatively larger patch size but a lower patch density (0.33) (Table 2).
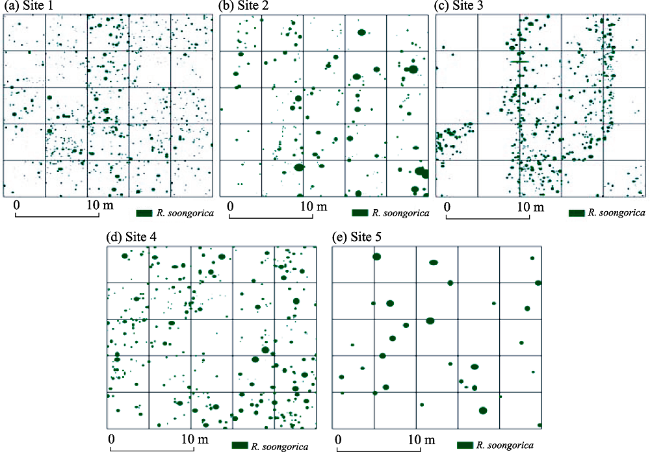
Figure 3 Shrub patch distributions (25 m × 25 m) of R. soongorica from Site 1 to Site 5 in the middle and lower Heihe River Basin
Table 2 Summary of R. soongorica patch structure across the mean annual precipitation gradient
Site Percentage (%) N C KA (m2) H (cm) $\bar{A}$(m2)
Site 1 63.4a 1049±128a 1.68±0.19a 4.1±0.7a 10.15±0.32a 0.02±0.01a
Site 2 58.5a 174±80ab 0.33±0.14b 2.6±1.0a 18.08±0.31b 0.10±0.02ab
Site 3 89.4b 821±261a 1.08±0.40a 4.6±0.4b 17.53±2.36bc 0.04±0.01a
Site 4 92.6b 356b 0.57±0.00b 4.7±0.2b 17.57±0.34bc 0.08±0.00ab
Site 5 95.1b 48±11c 0.08±0.01c 1.6±1.0c 23.10±5.60d 0.21±0.11b

Note: Different letters donate different means at 95% confidence level. Percent is ratio of number of R.soongorica to total plants number (%); N: total number of shrub patches; C: density of shrub patches per m-2; KA: total area of shrub patches (%); H is the maximal height of shrub (cm); $\bar{A}$: size of each shrub patch (m2)

The vegetation cover and AGB decreased gradually with decreasing precipitation from Site 1 to Site 5. Sites 2 and 3, however, were similar in cover and AGB amount. The community species richness, Simpson index and Shannon index were higher at Site 1 and remained at a medium level at sites 2 and 3; however, the values were much lower at sites 4 and 5. This result indicates that the community biodiversity index decreased with decreasing precipitation. However, the importance value of R. soongorica improved significantly from Site 1 to Site 5 (0.42 = 0.42 < 0.58 < 0.66 < 0.68) (Table 3). Patch-to-patch distance (PD) showed an increasing trend with decreasing precipitation (0.56 m < 0.60 m < 0.95 m < 2.80 m). However, Site 2 exhibited relatively larger PD due to its lower patch density (0.33). The value of V/m was the highest at Site 1 (13.4), lowest at Site 5 (0.9), and maintained a medium level at sites 2-4. The decreasing tendency of the V/m index indicated that the spatial pattern of the R. soongorica patch gradually transformed from a clumped to a random pattern with decreasing precipitation (Table 3).
Table 3 Summary statistics and statistical differences of vegetation community characteristics
Site Cover (%) AGB (g/m2) SR Simpson index Shannon index Important value V/m PD (m)
Site 1 11.16±0.03a 92.36±15.21a 4 0.69 1.28 0.42 13.4 0.56±0.04a
Site 2 8.03±0.04b 38.64±10.29b 3 0.64 1.05 0.42 2.9 1.40±0.33c
Site 3 5.33±0.01c 25.92±7.35c 3 0.61 1.06 0.58 5.3 0.60±0.03a
Site 4 5.61±0.00c 27.01±0.17c 2.5 0.50 0.74 0.66 3.4 0.95±0.00b
Site 5 1.85±0.01d 8.14±1.20d 2 0.51 0.63 0.68 0.9 2.80±0.54d

Note: Different letters donate different means at 95% confidence level. AGB is above-ground biomass; SR is species richness; important value is related to R.soongorica shrub; PD is patch-to-patch distance (m).

3.2 Combined effects of climate, vegetation, and soil on shrub patch structure

We found a strong correlated relationship between patch structure and environmental factors (Table 1S), such as shrub cover and MAP (r=0.85**), shrub cover and BSC:BG (r=0.99**), patch density and TN (r=0.95**), and patch density and AGB (r=0.87**). Specifi-cally, patch height, size and PD exponentially decreased with MAP and ABG, while PD showed exponential growth fitting with sand content at a significant level (p < 0.0001) (Figure 4). Changes in shrub cover, density, and V/m along with a decreased MAP gradient are presented in Figure 5. Shrub cover, density and V/m significantly decreased with increasing sand content, while shrub cover and V/m were exponential growth fitted with MAP at a significant level (p < 0.0001). Except for the exponential rise to the maximum relationships between shrub cover and ABG, shrub density and V/m were strongly linear in relation to ABG (Figure 5).
Table 1S Pearson’s correlation analysis between shrub patch structure index and environmental factors (climate, soil and vegetation)
Factors
structure
Climate Soil Vegetation
MAP Sand TN BSC:BG AGB RS
Height -0.71** 0.80** -0.74** -0.67** -0.78** -0.76**
Size -0.69** 0.62** -0.54** -0.51* -0.53* -0.58*
Cover 0.85** -0.85** 0.72** 0.99** 0.91** 0.80**
Density 0.73** -0.87** 0.95** 0.77** 0.87** 0.83**
PD -0.79** 0.69** -0.61** -0.68** -0.61** -0.61**
V/m 0.76** -0.93** 0.93** 0.77** 0.90** 083**

*Correlations are significant at P < 0.05; **Correlations are significant at P < 0.01

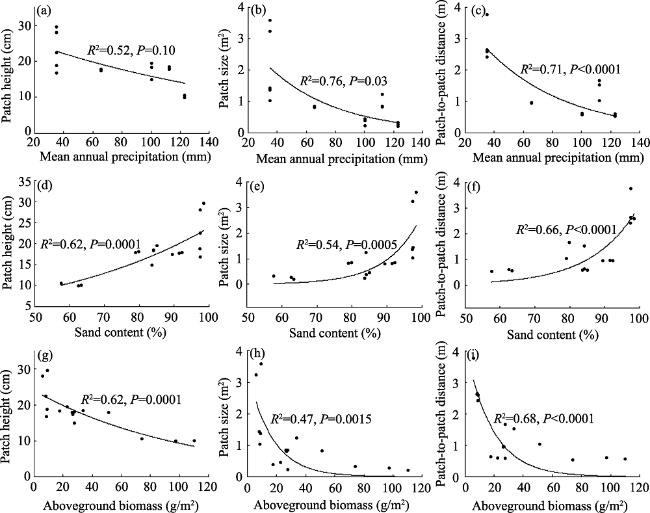
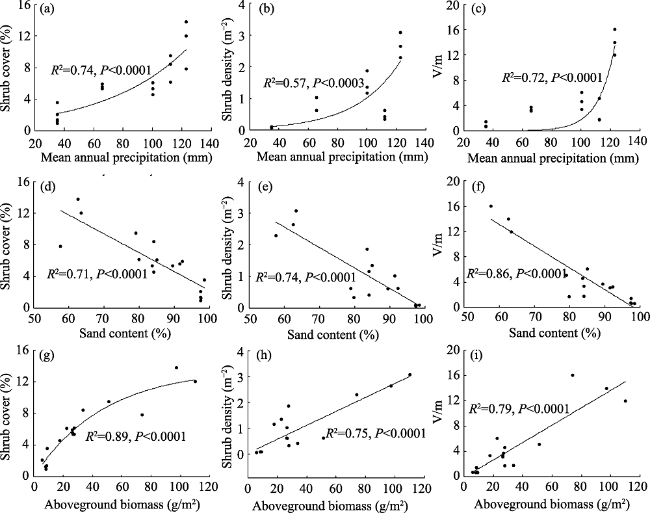
Figure 4 Changes in shrub patch attributes with (a-c) mean annual precipitation (MAP), (d-f) clay content of 0-10 cm, and (g-i) community aboveground biomass (ABG). The shrub patch structure includes mean patch height, size and plant distance.
Changes in community characteristics with (a-c) mean annual precipitation, (d-f) clay content of 0-10 cm, (g-i) community aboveground biomass. The community characteristics included vegetation cover, density and variance to mean ratio (V/m).
Multivariate analysis methods, such as forward stepwise regression methods, RDA and variation partitioning, were then applied to analyze the combined effects of climate, soil and vegetation on spatial patch structure. MAP was the primary factor affecting patch size and PD, while patch height and shrub density were influenced by sand content and TN. The variations in shrub cover and V/m were determined by interactions among MAP, species richness and BSC:BG and between MAP and sand content, respectively (Table 4).
Table 4 Regression analysis between R. soongorica patch structure patch and climate, soil and vegetation factors
Dependent factor Independent factor Regression function
Height Sand content y=0.33x-0.97 R2=0.64 P<0.001
Size MAP y=-0.002x-0.26 R2=0.44 P<0.01
Distance MAP y=-0.02x+3.23 R2=0.61 P<0.001
Shrub cover MAP, species richness, BSC:BG y=0.007x1-0.19x2+84.70x3+0.46 R2=0.99 P<0.001
Shrub density TN y=34.48x-0.03 R2=0.89 P<0.001
V/m MAP, sand content y=-0.07x1-0.52x2+54.60 R2=0.93 P<0.001
RDA showed a comprehensive relationship between the explanatory variables and indi- cators of shrub patch structure (Figure 6). Climate (MAP), soil (sand, TN and BSG:BG) and vegetation (ABG and speciesrichness) all have significant contribu-tions to the two axes. However, a strongcorrelation was also found between en-vironmental factors. Using the variationpartitioning method, we found that ap-proximately 82.5% of the total variation in the R. soongorica patch structure was explained by combined precipitation, soil variables, and vegetation variables. Soil conditions made the largest contri-bution (4.4%), while climate and vegeta-tion accounted for just 0.6% and 1.7%, respectively, of the shrub patch structure; however, the combined effects of climate and soil, soil and vegetation and climate, soil and vegetation were 9.7%, 11% and 52.5%, respectively (Figure 7).
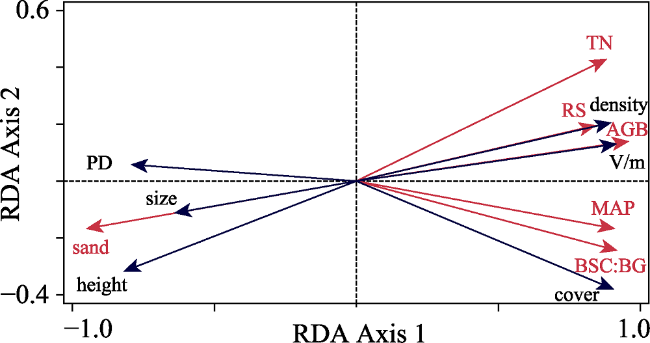
Figure 6 Redundancy analysis (RDA) displays the effects of climate, soil, and vegetation index indicators (red vectors) on shrub patch structure variables (blue vectors)
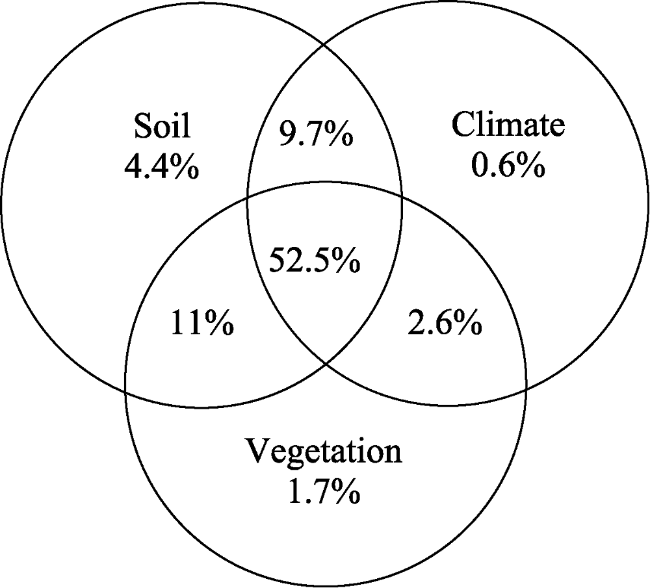
Figure 7 Combined effects of MAP, soil properties and vegetation on shrub patch structure
Moreover, we found a positive linear relationship between BSC:BG and MAP in the middle and lower HRB (P<0.05, Figure 8). Under the control of MAP, species richness and AGB were positively correlated with BSC:BG at the landscape scale (P<0.01, Table 5).
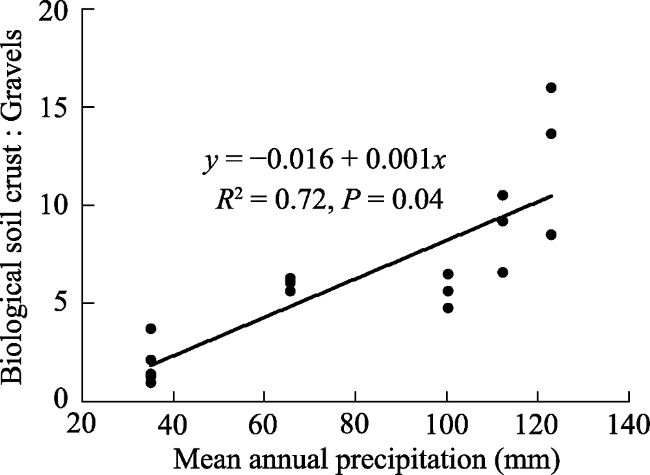
Figure 8 Relationship between MAP and surface soil heterogeneity (the ratio of biological soil crust and bare gravel)
Table 5 Pearson correlation between the ratio of biological soil crust (BSC) and bare gravel (BG) and shrub patch structure and spatial pattern
H $\bar{P}$ $\bar{A}$ PD SR AGB IV
BSC:BG -0.97** -0.78 -0.75 -0.70 0.95* 0.95* -0.88*
BSC:BG (MAP) -0.16 0.26 0.24 -0.01 0.66** 0.78** -0.34

Note: *Correlations are significant at P < 0.05; **Correlations are significant at P < 0.01

4 Discussion

4.1 Patch structure based on combined precipitation-soil-vegetation

Our study suggested that the R. soongorica patch structure was significantly different among different precipitation regimes in the middle and lower HRB. Consistent with previous studies, our results showed that precipitation was a major factor influencing patch structure and ecosystem functions. Shrub cover increased with precipitation amount (Figure 5 and Table 3). Woody cover significantly increased with the increasing rainfall gradient in Australian savanna systems (Shackleton and Scholes, 2011), and shrub cover also increased with rainfall according to a linear relationship in shrub-encroachment grasslands. These results indicated that rainfall was important for the development and expansion of shrub patches. The positive relationship between R. soongorica patch density and MAP is consistent with previous studies in savanna (Shackleton and Scholes., 2011) but contrasts with results from shrub-encroached grasslands (Chen et al., 2014). This difference might be related to the shrub function type and species composition along the precipitation gradient. R. soongorica is a drought-tolerant habitat. To inhibit inter-individual competition under low precipitation, the fewer individuals who survive are larger on average but have a lower plant density. Additionally, the community species richness was lower, while the R. soongorica patch height and size were larger with decreasing precipitation (Figure 4 and Table 2). However, a positive relationship between patch size and precipitation was indicated by shrub-encroached grasslands (Li et al., 2013; Chen et al., 2014) and desert grasslands (Yao et al., 2006). This difference could be explained by the flexible water use strategies of R. soongorica in the middle and lower HRB. R. soongorica mainly took up water from the 0-80 cm and 80-200 cm layers at high and moderate precipitation sites, respectively, but the species obtained a larger proportion of water from groundwater at low precipitation sites (Zhang et al., 2017). Vincenot et al. (2017) reported that lower precipitation resulted in higher mean individual biomass. As a consequence, in the groundwater-dominant sites, R. soongorica was motivated to expand its mean individual size and biomass to resist drought stress by maintaining consistent water availability, while in precipitation-dominant sites, net “facilitation-competition” interactions could be balanced by R. soongorica due to its flexible water use pattern.
The heterogeneity of soil physicochemical properties determines vegetation patch dynamics (Hufford et al., 2014). Patch size increased with decreasing MAP on both sand and loam soils but declined slightly on clay soil (Ludwig et al., 1999). The sandy loam soils in this study thus contributed to the negative relationship between patch structure and MAP (Figure 4). The phenomenon could be interpreted to indicate that coarse-texture subsoil might benefit the establishment of woody plants by enabling deeper root penetration soil profiles, where greater soil moisture and nutrients were available (Zhou et al., 2017). Additionally, the clay content decreased with decreasing MAP, the values of soil moisture, SOM and TN in the middle HRB were significantly higher than those in the lower HRB (Table 1). Zhang et al. (2017) indicated plant species diversity was significantly correlated with soil texture in Gobi desert. In contrast with those on shrub-encroached grasslands (Cipriotti et al., 2012; Chen et al., 2014), patch height and size showed negative relationships with the 0-10 cm sand content (Figure 4). The difference was caused by the fine root pattern of R. soongorica and the corresponding soil moisture, which transformed flexibly from the 0-30 cm to the 20-100 cm soil layers with decreasing MAP in the middle HRB but extended to the 60->220 cm soil layer in the lower HRB (Figure 1S). Furthermore, the optimization pattern between the R. soongorica fine root structure and soil moisture agreed well with the different plant water use strategies along the MAP gradients (Fu et al., 2014; Zhang et al., 2017). Influenced by the spatial heterogeneity of soil texture, the plasticity in root architecture and water use pattern improved the competitive advantage of R. soongorica, and the importance value of R. soongorica individuals showed an increasing trend with decreasing MAP (Table 3). Soil texture and TN, which explained 4.4% of the variation in patch structure, were thus regarded as the most important factor in controlling patch dynamics.
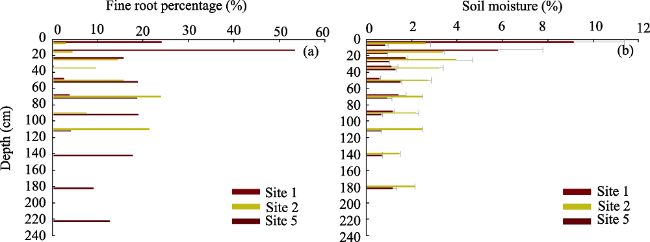
Figure 1S A comparison of vertical pattern of surface area of fine root (< 2 mm) and soil moisture in growing season of R. soongorica

4.2 Spatial patch pattern based on combined precipitation, soil and vegetation factors

The spatial pattern of patchy vegetation reflects the influence of multiple drivers, such as climate, soils and vegetation conditions (Ravolainen et al., 2013; Zhou et al., 2017). The community species richness and patch density decreased, but the PD of R. soongorica increased along the MAP gradient (Figures 4 and 5). The patch spatial pattern then shifted from clumpy to random towards drier environments (Table 3). Our results were consistent with those of Malkinson and Jeltsch (2007), who found that the shrub Sarcopoterium spinosum exhibited a clumped pattern in the moist field but a random pattern in arid sites; but contrasted with those of the sub-shrub Artemisia ordosica (Li et al., 2009) and Caragana stenophylla (Xie et al., 2015) in semi-arid zones. The difference could be explained by two aspects: first, compared to those sub-shrub types, R. soongorica is more flexible in root architecture and drought tolerance. Second, following the desert “source-sink” theory (Li, 2011), fetch lengths, expressed by the ratio of the width of interspaces to vegetation patches, were expected to be greater at the driest sites.
Additionally, vegetation patterns are associated with long-term competition for limited water and nutrient resources, which are affected by the spatial heterogeneity of surface-soil physicochemical properties (Wu et al., 2016). Distinct differences in BSC and BG patterns were found in the surface soil in this study (Figure 2). Compared with that in BG, both soil loams, clay content and soil moisture, SOM and TN were significantly higher in the BSC (Table 2S). The presence of BSC could decrease soil bulk density and obstruct deep rainfall infiltrations, and the water-holding capacity of the surface soil layer was then improved (Li et al., 2013). Bare gravel patches, however, enhanced water run-on and evaporation processes because of surface soil compaction (Hamerlynck et al., 2002). Run-on (source)-run-off (sink) interactions had a significant effect on the formation of surface-soil moisture and nutrient heterogeneity, which is called the “fertile island” effect. Pueyo et al. (2013) indicated that a “fertile island” could enhance vegetation species richness and productivity, which was linked to overall vegetation cover and spatial pattern. However, “fertile island” effects (higher concentration of soil moisture and nutrients beneath BSG compared with surrounding BG) were weakened gradually as BSC:BG decreased in our study (Table 2S). The positive relationship between BSC:BG and species richness and AGB of R. soongorica along the MAP gradient was thus attributed to differences in the “fertile island” effects. Our results agreed well with those of Aguiar and Sala (1999). Therefore, the spatial heterogeneity of surface-soil physical properties was the dominant factor driving the formation and dynamics of the vegetation pattern of R. soongorica through controlling the “fertile islands” and water availability in the middle and lower HRB.
Table 2S Comparison of soil moisture, soil organic matter, total nitrogen and particle size from biological soil crust (BSC) and bare gravels (BG)
Sites Type SM SOM TN Soil particles
Sand Loam Clay
Site 1 BSC 7.88±1.14% 4.28±.97% 0.14±0.11% 64.95% 31.30% 3.75%
BG 5.44±1.09% 3.83±0.58% 0.07±0.03% 83.52% 10.43% 6.05%
FIE 1.44 1.12 1.85 0.78 3.00 0.62
Site 2 BSC 3.24±1.27% 2.13±0.30% 0.02±0.00% 79.43% 18.15% 2.42%
BG 2.53±1.00% 2.13±0.46% 0.02±0.01% 88.48% 9.42% 2.10%
FIE 1.27 1 1 0.90 1.93 1.15
Site 5 BSC 0.88±0.35% 1.27±0.30% 0.01±0.00% 97.00% 1.75% 1.25%
BG 0.95±0.54% 1.33±0.41% 0.01±0.00% 97.90% 1.28% 0.82%
FIE 0.93 0.96 1 0.99 1.36 1.52

Note: SM: soil moisture; FIE: “fertile islands” effects

4.3 Ecological adaptive strategy for patchy R. soongorica

Patch structure and spatial pattern are important indices used to reveal ecological adaptive strategies for patchy vegetation in water-limited ecosystems. We thus studied R. soongorica patch structure and population distribution under different precipitation regimes, and the drought stress tolerance and water use strategies of R. soongorica were revealed. A conceptual model of patchy vegetation dynamics and the ecological adaptive strategy of R. soongorica along a decreasing MAP gradient were proposed (Figure 9).
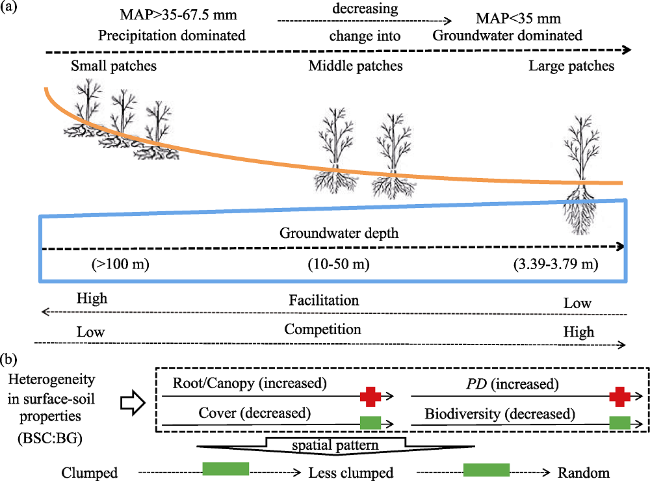
Figure 9 A conceptual model of patchy vegetation dynamics and ecological adaptive strategies of R. soongorica in the middle and lower Heihe River Basin
In the high precipitation regime (MAP was over 67.5-100 mm), R. soongorica derived most of its water from shallow soil layers (0-80 cm), where soil moisture was directly influenced by precipitation (Zhang et al., 2017). Small patch sizes but rich patch densities were thus found at these sites (Table 2). Heterogeneity in subsurface soil texture further drove community species composition and interactions. The higher clay content and TN in the subsurface soil layer (Figure 4) resulted in R. soongorica below-ground biomass allocation and fine root patterns concentrated at the 0-30 cm soil layer, from which other associated shrubs, e.g., N. sphaerocarpa and Salsola passerine, also took up available water but with different water use efficiencies (Su et al., 2012; Zhang et al., 2017). Therefore, maintaining species richness is considered to be an effective way to improve drought tolerance and ecosystem functioning, which is in agreement with the results of Gaitán et al. (2014). Alternatively, a high BSC:BG proportion indicated strong spatial heterogeneity of surface soil properties in the high precipitation regime (Figure 2). Compared to BG, BSC could gather soil moisture and nutrients together closely to shrub patches, where an obvious “fertile island” effect was observed (Table 2S). As a consequence, small PD but high AGB and species richness resulted in clumped patterns of R. soongorica patches.
In the middle precipitation regime (MAP was approximately 35-67.5 mm), which is limited by water availability in shallow soil layers, R. soongorica took up water mainly from the deep soil layer (80-200 cm) (Zhang et al., 2017). Because only large precipitation pulses, percolated into deep soil profile, might provide a water source that could be utilized by shrubs (Schwinning et al., 2003). With decreasing subsurface soil clay, R. soongorica improved “facilitation-competition” interactions for water resources by increasing the proportion of BGB allocation to 100 cm. Compared to other associated shrubs, R. soongorica was rich in terms of patch size and individual biomass. Additionally, because the spatial heterogeneity between BSC and BG at the surface-soil layer decreased (Figure 8), the amount of soil water and nutrients declined, which was associated with a decreasing “fertile island” effect (Table 2S). Decreasing shrub cover and species richness thus led to less clumped patterns of R. soongorica patches.
In the low precipitation regime (MAP was less than 35 mm), precipitation might not be sufficient to maintain plant survival, and R. soongorica shifted its water use strategy by absorbing a large portion from groundwater (Zhang et al., 2017). Due to the coarse-texture subsurface soil, the biomass allocation to roots increased, and the proportion of fine roots also increased with depth, especially below 140 cm (Figure 1S); furthermore, larger patch sizes of R. soongorica were found, but there was a reduction in patch density (Table 2). More importantly, the “fertile island” effect decreased significantly or even disappeared with decreasing BSC:BG (Table 2S and Figure 9). This result indicated that instead of storing water in soil layers, water was mostly lost through runoff processes and rapid evaporation back to the atmosphere. Therefore, R. soongorica was almost the only surviving shrub in the low precipitation regime, followed by wide PD and low AGB but with a random pattern.

5 Conclusions

In this study, we paid close attention to shrub patch structure and its response to combined climate, soil and vegetation factors along obvious precipitation gradients in the middle and lower HRB at a large scale. We found the following:
(1) Patch height and size were greater in dry and warm habitats (Sites 4 and 5) than at moist and cool sites (Sites 1-3), but shrub cover and density were larger in high precipitation regions than in low precipitation areas. Spatial patch distribution transformed from small and clumped at sites 1-4 to large and random (Site 5) patterns towards gradually drier environments.
(2) MAP was the primary factor affecting R. soongorica patch size and PD, while patch height and shrub density were influenced by sand content and TN. Shrub cover and V/m were determined by interactions among MAP, species richness and BSC:BG and between MAP and sand content, respectively. Synthetic climate, soil and vegetation factors explained 82.5% of the variance in shrub patch structure. The linear relationship between BSC:BG and MAP meant that the spatial heterogeneity of the surface-soil properties (BSC:BG) was considered to drive the R. soongorica patch pattern.
(3) R. soongorica changed from having a flexible water use strategy to a consistent water use strategy with decreasing MAP in the middle and lower HRB. At high precipitation regions, R. soongorica derived most of its water from shallow soil layers (0-80 cm) and in small R. soongorica patch sizes and patch-to-patch distances, but large species richness was then found. However, R. soongorica relied mostly on shallow groundwater in low precipitation areas. A larger R. soongorica patch size and root/canopy ratio but lower community characteristics were observed.
Future work is required to understand patch-to-patch ecohydrological interactions and the ecological threshold of water demands with distinct vegetation patterns to determine the dynamics of steady sensitivity to climate change, especially regarding precipitation.
[1]
Aguiar M R, Sala O A , 1999. Patch structure, dynamics and implications for the functioning of arid ecosystems. Trends in Ecology & Evolution, 14:273-277.

[2]
Bai Y F, Wu J G, Xing Q et al., 2008. Primary production and rain use efficiency across a precipitation gradient on the Mongolia Plateau. Ecology, 89:2140-2153.

[3]
Bedford D R, Small E E , 2008. Spatial patterns of ecohydrologic properties on a hillslope-alluvial fan transect central New Mexico. Catena, 73(1):34-48.

[4]
Bremmer J M, Mulvaney C S , 1982. Nitrogen-total. In: Page A L, Miller R H, Keeney D R (eds.). Methods of Soil Analysis. Part 2: Chemical and Microbiological Properties (Agronomy), vol. 9. American Society of Agronomy, Madison, 595-624.

[5]
Casati P, Campi M, Morrow D J et al., 2011. Transcriptomic, proteomic and metabolomic analysis of maize responses to UV-B: Comparison of greenhouse and field growth conditions. Plant Signaling & Behavior, 6(8):1146-1153.

[6]
Chen L Y, Li H, Zhang P J et al., 2014. Climate and native grassland vegetation as divers of the community structures of shrub-encroached grasslands in Inner Mongolia, China. Landscape Ecology, 30(9):1627-1641.

[7]
Cheng X L, An S Q, Li B et al., 2006. Summer rain pulse size and rainwater uptake by three dominant desert plants in a desertified grassland ecosystem in northwestern China. Plant Ecology, 184(1):1-12.

[8]
Cipriotti P A, Aguiar M R , 2015. Is the balance between competition and facilitation a driver of the patch dynamics in arid vegetation mosaics? Oikos, 124:139-149.

[9]
Cipriotti P A, Aguiar M R, Wiegand T et al., 2012. Understanding the long-term spatial dynamics of a semiarid grass-shrub steppe through inverse parameterization for simulation models. Oikos, 121(6):848-861.

[10]
Couteron P, Lejeune O , 2001. Periodic spotted patterns in semi-arid vegetation explained by a propagation-inhibition model. Journal of Ecology, 89(4):616-628.

[11]
Dan M, Jeltsch F , 2007. Intraspecific facilitation: A missing process along increasing stress gradients - insights from simulated shrub populations. Ecography, 30(3):339-348.

[12]
Du J H, Yan P, Dong Y X et al., 2012. Water driving mechanism of patched vegetation formation in arid areas: A review. Chinese Journal of Ecology, 31(8):2137-2144. (in Chinese)

[13]
Dunkerley D L, Brown K J , 1999. Banded vegetation near Broken Hill, Australia: Significance of surface roughness and soil physical properties. Catena, 37(1/2):75-88.

[14]
Fan Y, Li X Y, Huang Y M et al., 2017. Shrub patch configuration in relation to precipitation and soil properties in Northwest China. Ecohydrology, 11(6):e1916.

[15]
Fu A H, Chen Y N, Li W H , 2014. Water use strategies of the desert riparian forest plant community in the lower reaches of Heihe River Basin, China. Science China: Earth Sciences, 57(6):1293-1305.

[16]
Gaitán J J, Bran D, Oliva G et al., 2014. Plant species richness and shrub cover attenuate drought effects on ecosystem functioning across Patagonian rangelands. Biology Letters , 10(10). doi: 10.1098/rsbl.2014.0673.

[17]
Greig-Smith P , 1983. Quantitative Plant Ecology. London: Blackwell.

[18]
Hamerlynck E P, McAuliffe J R, McDonald E V et al., 2002. Ecological responses of two Mojave desert shrubs to soil horizon development and soil water dynamics. Ecology, 83:768-779.

[19]
Harman C J, Lohse K A, Troch P A et al., 2014. Spatial patterns of vegetation, soils, and microtopography from terrestrial laser scanning on two semiarid hillslopes of contrasting lithology. Journal of Geophysical Research Biogeosciences, 119(2):163-180.

[20]
Holthuijzen M F, Veblen K E , 2015. Grass-shrub associations over a precipitation gradient and their implications for restoration in the Great Basin, USA. PloS One , 10(12). doi: 10.1371/journal.pone.0143170.

[21]
Hu G L, Zhao W Z, Wang G 2011. Reviews on spatial pattern and sand-binding effect of patch vegetation in arid desert area. Acta Ecologica Sinica, 31(24):7609-4616. (in Chinese)

[22]
Hufford K M, Mazer S J, Schimel J P , 2014. Soil heterogeneity and the distribution of native grasses in California: Can soil properties inform restoration plans? Ecosphere, 5(4):1-14.

[23]
Kang M Y, Dai C, Ji W Y et al., 2013. Biomass and its allocation in relation to temperature, precipitation, and soil nutrients in Inner Mongolia grasslands, China. PloS One, 8(7). doi 10.1371/journal.pone.0069561.

[24]
Kéfi S M, Rietkerk C L, Burras B J et al., 2007. Spatial vegetation patterns and imminent desertification in Mediterranean arid ecosystems. Nature, 449:213-215.

[25]
Kröpfl A I, Cecchi G A, Villasuso N M et al., 2013. Degradation and recovery processes in semi-arid patchy rangelands of northern Patagonia, Argentina. Land Degradation & Development, 24(4):393-399.

[26]
Li Q S, Zhang C, Wang F et al., 2009. Responses of spatial distribution pattern of Artemisia ordosica population to the precipitation gradient on Ordos Plateau. Chinese Journal of Applied Ecology, 20(9):2105-2110. (in Chinese)

[27]
Li X R, Zhang Z S, Huang L et al., 2013. Review of the ecohydrological processes and feedback mechanisms controlling sand-binding vegetation systems in sandy desert regions of China. Chinese Science Bulletin, 58(13):1483-1496.

[28]
Li X Y , 2011. Mechanism of coupling, response and adaptation between soil, vegetation and hydrology in arid and semiarid regions. Science Sinica Terrae, 41:1721-1730. (in Chinese)

[29]
Li X Y, Zhang S Y, Peng H Y et al., 2013. Soil water and temperature dynamics in shrub-encroached grasslands and climatic implications: Results from Inner Mongolia steppe ecosystem of north China. Agricultural and Forest Meteorology, 171/172:20-30.

[30]
Liu M L, Li X R, Liu Y B et al., 2015. Analysis of differentially expressed genes under UV-B radiation in the desert plant Reaumuria soongorica. Gene, 574:265-272.

[31]
Ludwig J A, Tongway D J, Eager R W et al., 1999. Fine-scale vegetation patches decline in size and cover with increasing rainfall in Australian savanna. Landscape Ecology, 14:557-566.

[32]
Ludwig J A, Wilcox B P, Breshears D D et al., 2005. Vegetation patches and runoff-erosion as interacting ecohydrological processes in semiarid landscapes. Ecology, 86(2):288-297.

[33]
Luo W C, Zhao W Z, He Z B et al., 2018. Spatial characteristics of two dominant shrub populations in the transition zone between oasis and desert in the Heihe River Basin, China. Catena, 170:356-364.

[34]
Ma W, Yang Y H, He J et al., 2008. Above- and below-ground biomass in relation to environmental factors in temperate grasslands, Inner Mongolia. Science China Life Sciences, 51:263-270.

[35]
Malkinson D, Jeltsch F , 2007. Intraspecific facilitation: A missing process along increasing stress gradients - insights from simulated shrub populations. Ecography, 30(3):339-348.

[36]
Mauchamp A, Montaña C, Lepart J et al., 1993. Ecotone dependent recruitment of a desert shrub, Flourensia cernua, in vegetation stripes. Oikos, 68(1):107-116.

[37]
Merino-Martín L, Breshears D D, Heras M D L et al., 2012. Ecohydrological source-sink interrelationships between vegetation patches and soil hydrological properties along a disturbance gradient reveal a restoration threshold. Restoration Ecology, 20(3):360-368.

[38]
Pueyo Y, Moret-Fernández D, Saiz H et al., 2013. Relationships between plant spatial patterns, water infiltration capacity, and plant community composition in semi-arid Mediterranean ecosystems along stress gradients. Ecosystems, 16(3):452-466.

[39]
Ravi S, D'Odorico P, Okin G S , 2007. Hydrologic and aeolian controls on vegetation patterns in arid landscapes. Geophysical Research Letters, 34(24):1061-1064.

[40]
Ravolainen V T, Bråthen K A, Ims R A et al., 2013. Shrub patch configuration at the landscape scale is related to diversity of adjacent herbaceous vegetation. Plant Ecology & Diversity, 6(2):257-268.

[41]
Schenk H J, Jackson R B , 2005. Mapping the global distribution of deep roots in relation to climate and soil characteristics. Geoderma, 126(1/2):129-140.

[42]
Schwinning S, Starr B I, Ehleringer J R , 2003. Dominant cold desert plants do not partition warm season precipitation by events size. Oecologia, 136(2):252-260.

[43]
Segoli M, Ungar E D, Shachak M , 2008. Shrubs enhance resilience of a semi-arid ecosystem by engineering and regrowth. Ecohydrology, 1(4):330-339.

[44]
Shackleton C M, Scholes R J , 2011. Above ground woody community attributes, biomass and carbon stocks along a rainfall gradient in the savannas of the central lowveld, South Africa. South African Journal of Botany, 77(1):184-192.

[45]
Sileshi G W, Arshad M A, Konaté S et al., 2010. Termite-induced heterogeneity in African savanna vegetation: mechanisms and patterns. Journal of Vegetation Science, 21(5):923-937.

[46]
Su P X, Yan Q D, Xie T T et al., 2012. Associated growth of C3 and C4 desert plants helps the C3 species at the cost of the C4 species. Acta Physiologiae Plantarum, 34:2057-2068.

[47]
Su Y Z, Zhao W Z, Su P X et al., 2007. Ecological effects of desertification control and desertified land reclamation in an oasis-desert ecotone in an arid region: A case study in Hexi Corridor, northwest China. Ecological Engineering, 29(2):117-124.

[48]
Valentin C, D’Herbès J M, Poesen J , 1999. Soil and water components of banded vegetation patterns. Catena, 37(1):1-24.

[49]
Vincenot C E, Fabrizio C, Stefano M et al., 2017. Spatial self-organization of vegetation subject to climatic stress - insights from a system synamics: Individual-based hybrid model. Frontiers in Plant Science, 7(636):1-18.

[50]
Wu G L, Wang D, Liu Y et al., 2016. Mosaic-pattern vegetation formation and dynamics driven by the water-wind crisscross erosion. Journal of Hydrology, 538:355-362.

[51]
Xie L N, Guo H Y, Gabler C A et al., 2015. Changes in Spatial Patterns of Caragana stenophylla along a climatic drought gradient on the Inner Mongolian Plateau. PloS One, 10(3). doi 10.1371/journal.pone.0121234.

[52]
Yao J, Peters D P C, Havstad K M et al., 2006. Multi-scale factors and long-term responses of Chihuahuan Desert grasses to drought. Landscape Ecology, 21(8):1217-1231.

[53]
Zhang C C, Li X Y, Wu H W et al., 2017. Differences in water-use strategies along an aridity gradient between two coexisting desert shrubs (Reaumuria soongorica and Nitraria sphaerocarpa): Isotopic approaches with physiological evidence. Plant and Soil. doi: 10.1007/s11104-017-3332-8.

[54]
Zhang P P, Shao M A, Zhang X C , 2017. Spatial pattern of plant species diversity and the influencing factors in a Gobi desert within the Heihe River Basin, Northwest China. Journal of Arid Land, 9(3):379-393.

[55]
Zhang X L, Zhou J H, Cai W T et al., 2017. Diversity characteristics of plant communities in the arid desert of the Heihe Basin under different moisture gradients. Acta Ecological Sinica, 14(7):4627-4635. (in Chinese)

[56]
Zhou Y, Boutton T W, Wu X B et al., 2017. Spatial heterogeneity of subsurface soil texture drives landscape-scale patterns of woody patches in a subtropical savanna. Landscape Ecology, 32(4):915-929.

Outlines

/