Impact of radiations on the long-range correlation of soil moisture: A case study of the A’rou superstation in the Heihe River Basin

  • ZHANG Ting 1, 2, 3 ,
  • SHEN Shi 1, 2, 3 ,
  • CHENG Changxiu , 1, 2, 3, *
Expand
  • 1 State Key Laboratory of Earth Surface Processes and Resource Ecology, Beijing Normal University, Beijing 100875, China
  • 2 Key Laboratory of Environmental Change and Natural Disaster, Beijing Normal University, Beijing 100875, China
  • 3 Center for Geodata and Analysis, Faculty of Geographical Science, Beijing Normal University, Beijing 100875, China
*Cheng Changxiu (1973-), Professor, specialized in complex system research. E-mail:

Zhang Ting (1994–), specialized in spatio-temporal analysis of disaster data. E-mail: zhangting_bnu@mail. bnu.edu.cn

Received date: 2018-10-23

  Accepted date: 2019-03-10

  Online published: 2019-12-11

Supported by

National Key R&D Program of China(No.2017YFB0504102)

National Natural Science Foundation of China(No.41771537)

Copyright

Copyright reserved © 2019. Office of Journal of Geographical Sciences All articles published represent the opinions of the authors, and do not reflect the official policy of the Chinese Medical Association or the Editorial Board, unless this is clearly specified.

Abstract

Analyses of the soil moisture evolution trend and the influence of different types of radiation on soil moisture are of great significance to the simulation and prediction of soil moisture. In this paper, soil moisture (2-60 cm) and various radiation data from 2014-2015 at the A’rou superstation were selected. The radiation data include the net radiation (NR), shortwave and longwave radiation (SR and LR). Using adaptive fractal analysis (AFA), the long-range correlation (LRC) of soil moisture and long-range cross correlation (LRCC) between moisture and three types of radiation were analyzed at different timescales and soil depths. The results show that: (1) Persistence of soil moisture and consistency between soil moisture and radiation mutate at 18-d and 6-d timescales, respectively. The timescale variation of soil moisture persistence is mainly related to the influence process of radiation on soil moisture; (2) Both the soil moisture persistence and soil moisture-radiation consistency vary substantially with soil depth. The soil depth variation of soil moisture persistence is related to the influence intensity of radiation; (3) From 2-6 day timescales, LR displays the strongest influence on soil moisture at depths of 2-10 cm through negative feedback of radiation on the soil temperature. The influence intensity decreases with depth from 2-15 cm. Therefore, the soil moisture persistence is weak and increases with depth from 2-15 cm; and (4) At more than 6 day timescales, SR and NR display a stronger influence on the soil moisture persistence at depths of 2-40 cm through positive feedback of radiation on the soil temperature, especially at depths of 2-10 cm. This influence also weakens with depth. The soil moisture persistence at depths of 2-10 cm is the weakest and increases with depth from 2-40 cm. The research results are instructive for determining timescales and soil depths related to soil water in hydrological models.

Cite this article

ZHANG Ting , SHEN Shi , CHENG Changxiu . Impact of radiations on the long-range correlation of soil moisture: A case study of the A’rou superstation in the Heihe River Basin[J]. Journal of Geographical Sciences, 2019 , 29(9) : 1491 -1506 . DOI: 10.1007/s11442-019-1673-3

1 Introduction

Hydrothermal interaction at the land surface affects the atmosphere by the energy transfer and phase change of water (Betts, 1921; Xie et al., 2008). Soil moisture can adjust the incoming energy partitioning and then impact the precipitation at the land surface (Parinussa et al., 2014). Therefore, soil moisture and radiation are two important factors in the land-atmosphere coupling (Gu et al., 2006). Many studies have indicated that there is a cross correlation between soil moisture and longwave/shortwave radiation (Porporato et al., 2002; Ni et al., 2015). With the increase of shortwave radiation (SR), the evapotranspiration from soil and vegetation increases and soil moisture is reduced, and then the precipitation is impacted (Atchley et al., 2011; Zhang et al., 2001). Many studies use different types of radiation data to retrieve the soil moisture based on this correlation (Maltese et al., 2013; Sadeghi et al., 2015). Additionally, recent research on soil moisture and radiation is focused on their interannual variation (Lei et al., 2016; Karelin et al., 2013) and spatial variation (Liu et al., 2012; Liu et al., 2012).
However, the effects of different types of radiation on soil moisture evolution trends at different timescales and soil depths are rarely analyzed quantitatively. Long-range correlation (LRC) analysis was mostly utilized to depict the long memory (persistence) of the soil moisture time series (Shen et al., 2018; Biswas et al., 2012). This method can filter the periodic trend of soil moisture and analyze the soil moisture fluctuation. For example, Gao et al. (2015) noted that the variation in the persistence of soil moisture at different soil depths may be related to solar radiation and evaporation in the agro-ecosystem of Luancheng. Furthermore, Zhang et al. (2018) proved that solar radiation has effect on the soil moisture persistence at depths of 4-20 cm, and such effect displays soil depth variation. But it hasn’t been quantitatively measured. Song et al. (2011) indicated that the trend for soil moisture in the shallow layer with soil depths of 0-70 cm is mainly affected by precipitation and evaporation, and the deeper layers may be influenced by infiltration. It is evident that there is stratified variation in the persistence of the soil moisture sequence, and this phenomenon can be explained to a certain extent by the hydrothermal interaction driven by various types of radiation.
Besides, the correlation between soil and different types of radiation is mostly evaluated by traditional linear regression analyses. The research of Huang et al. (2009) in the hilly areas of southern China demonstrated that soil water storage was negatively correlated with solar radiation. The research of Zhang et al. (2017) in alpine meadow of the Three-River Source Region has proved that net radiation (NR) affects soil moisture in shallow soil by affecting the evapotranspiration of the soil system. Although the above studies can explain the effect of radiation on soil moisture, the cross correlation at multiple timescales is ignored.
The climate-hydrological system is part of a complex system, and soil moisture, as an important element of this system, presents complex properties including nonlinearity (Song et al., 2018; Biswas et al., 2012; Yang et al., 2019). In addition, the climate-hydrological system time series exhibits incomplete random fluctuation under periodic change (Cheng et al., 2018). The LRC indices can quantitatively describe persistence or anti-persistence of soil moisture for a specific timescale (Mandelbrot, 1991). Long-range cross correlation (LRCC) analysis can identify the multiple timescale correlations between two simultaneous non-stationary sequences. It identifies the multifractal characteristics of the cross correlation. At present, this algorithm is mainly applied to the fields of finance (Wang et al., 2013), neuroscience (Wang et al., 2012), medicine (Wang et al., 2012), etc. Therefore, the LRCC indices can quantitatively describe the influence of different types of radiation on the soil moisture persistence for a specific timescale (Shadkhoo et al., 2009).
It is critical to quantitatively characterize the cross correlation between soil moisture and different types of radiation in soil systems at multiple timescales and soil depths (Fei et al., 2013). The LRCC analysis of soil moisture and different types of radiation identifies the intensity of hydrothermal interaction at multiple timescales. It can provide clarification in the evaluation of the stratification heterogeneity and timescale variation of soil moisture trends (Song et al., 2017). Moreover, researchers can improve the accuracy of soil moisture simulation and prediction in ecological and hydrological models through identifying the correlations between different types of radiation and soil moisture (Han et al., 2014; Wei et al., 2008). Additionally, the evaluation of the evolution trends and time rhythms of soil moisture can improve the soil moisture timescale downscaling model. It is also significant in the spatiotemporal downscaling study of soil moisture.
To overcome the shortcomings of previous research, the LRC indices (H) of soil moisture in this paper were calculated at various soil depths at the A'rou superstation, and the variations of soil moisture persistence at different timescales and soil depths were analyzed. The LRCC indices (Hcor) between soil moisture and different types of radiation were then also calculated. The effects of different types of radiation on soil moisture at multiple timescales and soil depths are quantitatively described. The LRC and LRCC analyses are helpful in identifying the evolution trends of soil moisture and the influence of various types of radiation on soil moisture.
The study area and research data are introduced in the following section. Section 3 focuses on the research methods. The results of the research are presented and discussed in Section 4. Section 5 presents major conclusions and prospects.

2 Study area and research data

2.1 Study area

The observation station is the A’rou superstation on the highlands of the river valley at the south side of the Babao River. Babao River is the tributary of the Heihe River at its upstream and is located in the town of A’rou in Qilian County of Qinghai Province. This area is the main runoff formation area for the Heihe River, with abundant glacier meltwater and precipitation (Ouyang et al., 2017). The average annual temperature changes from 0.08℃ to 2.67℃. And the annual precipitation of the A’rou observation field is from 309.1 mm to 573.1 mm. Its climate belongs to a typical temperate continental climate (Li et al., 2014).
The following is the information of the A’rou superstation. It is located at upstream of the hydro-meteorological observation network in the Heihe River Basin (Figure 1). It is located at 100°27'51”E, 38°2'50”N, north of A’rou, and 3033 m above sea level. Its slope angle is 3.44°. Its azimuth slope direction is 78.69° (clockwise direction relative to North). The underlying surface is alpine meadow, and the soil type is Matti-Gelic Cambosols (China Soil Taxonomy, CST). In Figure 1, the boundary of the Heihe River Basin is selected as the 2010 version.
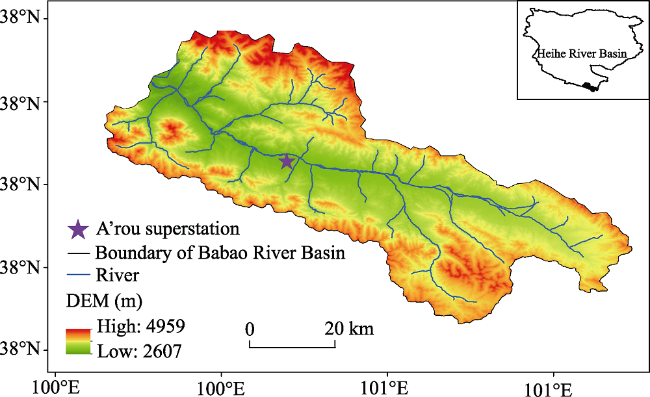
Figure 1 Geographical location of the A’rou superstation

2.2 Research data

The research dataset was obtained from the Heihe eco-hydrological remote sensing test (HiWATER) and included the soil moisture, net radiation, incoming/outgoing shortwave radiation and incoming/outgoing longwave radiation observation data from 2014-2015. The four-component radiometer is located 5 m from the meteorological tower, facing south, and the radiation data are recorded. The measurement of radiation is in units of w/m2. The soil moisture sensors are buried underground 2 m south of the meteorological tower at depths of 2 cm, 4 cm, 6 cm, 10 cm, 15 cm, 20 cm, 30 cm, 40 cm and 60 cm. The sensors measure the soil volumetric water content (%). More details about this dataset can be found in the research of Li et al. (2013) and Liu et al. (2011).
The observation interval of the original dataset was 10 min. The daily average series of soil moisture and radiation were calculated for the following analysis, recorded as {mi} and {ri}, respectively. SR in this paper refers to the results of incoming shortwave measurements minus outgoing shortwave measurements. LR refers to the results of outgoing longwave measurements minus incoming longwave measurements. NR refers to the results of SR minus LR, reflecting the net energy stored in the soil.
Table 1 Data items of A’rou superstation in the Heihe River Basin
Data items Height or depth Units
Net radiation 5 m (Height) w/m2
Incoming radiation 5 m (Height) w/m2
Outgoing radiation 5 m (Height) w/m2
Soil moisture 2, 4, 6, 10, 15, 20, 30, 40, 60 cm (Depth) Soil volumetric water content (%)

3 Methods

3.1 Calculation of LRC indices based on AFA

The Hurst exponent (H) is widely used to quantify the long memory and determine the multifractal characteristics of time series. It was first proposed by Peng et al. (1994). There are two common approaches to fit H, which are detrended fluctuation analysis (DFA) and adaptive fractal analysis (AFA).
However, by constructing overlapped sliding fitting windows, AFA has more advantages than DFA in the following aspects: (1) extracting the global smooth trend (Kuznetsov et al., 2013); (2) filtrating the self-circulation and external trend effectively (Riley et al., 2012); and (3) more reliable LRC results (Jiang et al., 2017). In addition, the results of AFA have been considered reliable in previous research and widely accepted (He et al., 2016; Cong et al., 2017). For example, Kirchner M et al. (2014) proved that AFA can extract smoother trends by comparing these two methods. Meanwhile, Gao et al. (2012)analyzed social and natural phenomena with both AFA and DFA methods and they ultimately relied on the results of AFA.
Therefore, we chose AFA to estimate the H for soil moisture series (random walk process) in this paper. The specific process is as follows:
1) Structuring the sliding window (w) to fit the global smooth trend of {mi}. During the fitting process, the size of each segment window is 2n+1, which represents (n+1) points that will be overlapped between two adjacent windows. Each window is fitted by the first order polynomial. The fitting results of segments i and i+1 are recorded as y(i)(l1) and y(i+1)(l2), respectively. The overlapped region of the fitting results is defined as y(c)(l). Weighted fitting is based on the distance between the overlapped parts and the original series.
${{y}^{\left( c \right)}}\left( l \right)={{w}_{1}}{{y}^{\left( i \right)}}\left( l+n \right)+{{w}_{2}}{{y}^{\left( i+1 \right)}}\left( l \right),\ l=1,2...,n+1$
where w1=1-d1/n and w2=1-d2/n. d1 and d2 represent the distance between the fitting points and the actual point in the overlapped part, respectively. The final global smooth trend of soil moisture can be denoted as {ami}.
2) The detrended series (the residual of the original series to the global trend) for soil moisture is m(i)-am(i). The root mean square residual at a specified window can be denoted as F(w). The relation between the F(w) and w yields the H of soil moisture according to:
$F\left( w \right)=\sqrt{\frac{1}{N}\underset{i}{\overset{N}{\mathop \sum }}\,{{\left( m\left( i \right)-am\left( i \right) \right)}^{2}}}\tilde{\ }{{w}^{H}}$
3) H is fitted by least-square (OLS) fitting under the double logarithmic coordinates of F(w) and w. The window range of H is identified by the coverage range of the specific slope.
H reveals the persistence or anti-persistence of soil moisture. H=0.5 indicates that soil moisture series can be observed as white noise but only with short memory. H>1 indicates that the tendency property of soil moisture between the future and the past cannot be explained by the LRC analysis.
0<H<0.5 indicates the anti-persistence of soil moisture. The noise level is high and the tendency is weak. With the decrease of H, the increments of soil moisture are more likely to be followed by decreases. The anti-persistence intensity peaks at H = 0.
0.5<H<1 indicates the persistence of soil moisture. The noise level is low and the tendency is evident. With the increase of H, the increments of soil moisture are more likely to be followed by increases. The persistence intensity peaks at H=1.

3.2 Calculation of LRCC indices based on AFA

The LRCC algorithm was first proposed by Podobnik et al. (2011). This method depicts multiple timescale correlations between two non-stationary time series through the covariance of two detrended series. In this study, the detrended series used to fit cross correlation exponent (Hcor) is extracted by the AFA algorithm discussed above. The specific fitness process of Hcor is as follows:
1) The detrended soil moisture and different types of radiation (NR, SR and LR) series are obtained. $~{{F}_{cor}}\left( w,m,r \right)$ is calculated through the covariance of one of the types of radiation and soil moisture detrended series, r, represented NR, SR and LR, respectively:
${{F}_{cor}}\left( w,m,r \right)=\sqrt{\frac{1}{N}\underset{i}{\overset{N}{\mathop \sum }}\,\left( m\left( i \right)-am\left( i \right) \right)\left( r\left( i \right)-ar\left( i \right) \right)}\tilde{\ }{{w}^{{{H}_{cor}}}}$
2) Hcor is fitted by OLS under double logarithmic coordinates of Hcor and w. The Hcor window range is identified by the coverage range of the different slopes.
Hcor identifies the consistent or anti-consistent change between soil moisture and the different types of radiation. Hcor=0.5 indicates that there is no cross correlation between soil moisture and the radiation and that they are independent; 0.5<Hcor<1 indicates that there is consistency between them. With the increase of Hcor, one series is more likely to increase with the other. The intensity of consistency peaks at Hcor=1; 0<Hcor<0.5 is the opposite, and the intensity of anti-consistency peaks at Hcor=0.

4 Results and analysis

Using the daily soil moisture series from 2014-2015, the timescale can be depicted from 2 days to 130 days (about 5 months) in the following LRC and LRCC analyses.

4.1 LRC analysis of soil moisture

The LRC indices (H) of soil moisture at A’rou superstation from soil depths of 2 to 60 cm were calculated using the algorithm discussed in Section 3.1. The LRC results for soil moisture at different timescales and soil depths are presented in this section.
The LRC indices at different timescales and soil depths are fitted in Figure 2. The soil moisture at the A’rou superstation is not completely random, but represents persistence at most soil depths and timescales. The linear relationships between F(w) and w are evident under the double logarithmic coordinates for each depth, and the slopes (H) are over 0.5 at all depths.
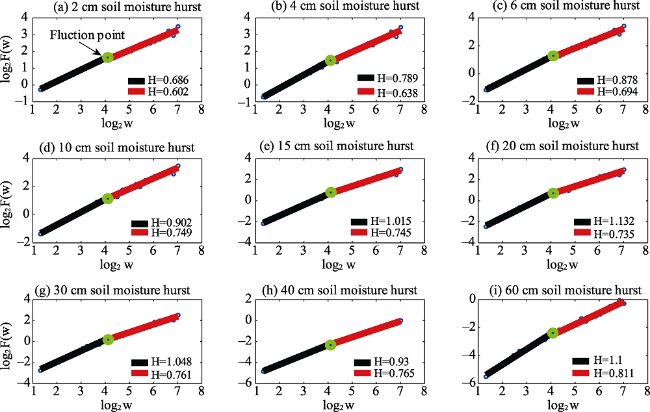
Figure 2 LRC results for soil moisture at different soil depths in A’rou superstation from 2014-2015
In addition, the intensity of the soil moisture persistence mutates at 18 d timescale for each depth. It is evident that the LRC of soil moisture displays timescale variation. F(w) of soil moisture can be fitted piecewise by two H indices. The persistency intensity inflects at each depth. From Figure 2, the small scaling region (coverage of the black line in Figure 2) covers time windows from 1.322 to 4.129 (2- to 18-d estimates). The H indices are notably higher than 1 (exceeding approximately 0.05) at deeper soil depths in this region (20 cm, 30 cm and 60 cm), which indicates that the fluctuation characteristics of soil moisture at these depths cannot be explained by the LRC analysis. The large scaling region (coverage of the red line in Figure 2) covers the log2w time windows over 4.129, which corresponds to the actual timescale over 18 d. The H indices are between 0.5 and 1. Therefore, the soil moisture series at this scaling region represents persistence.
Moreover, there is different persistence intensity for specific depths with soil depth variation. The persistence of soil moisture basically strengthens with depth at large timescales and in the shallower soil at small timescales. To analyze the soil depth variation of the soil moisture persistence, the H indices at the two scaling regions are displayed in Figure 3a. The average soil moisture during the entire research period was also described as a reference in Figure 3b. From Figure 3a, for the 2- to 18-d scaling region (dashed line in Figure 3a), the strongest persistence is represented at the 15-cm depth (H=1.015); soil moisture at a depth of 2 cm represents the weakest persistence (H=0.686). The persistence strengthens with soil depths from 2 to 15 cm. At the soil depths between 20 and 60 cm, soil moisture persistence is represented only at a depth of 40 cm. For the scaling region exceeding 18 d (solid line in Figure 3a), the values of soil moisture H at all soil depths were between 0.5 and 1, indicating persistence. The persistence strengthens with soil depth from 2 to 60 cm. The strongest and weakest persistence of soil moisture is indicated at a depth of 60 cm (H=0.811) and a depth of 2 cm (H=0.602), respectively. Furthermore, the persistence of soil moisture at depths between 2 and 10 cm depth strengthens significantly with soil depth, and the intensity of persistence at different depths varies substantially (with increments of 0.147). However, there are no notable changes in persistence for the soil moisture deeper than 10 cm (with increments less than 1).
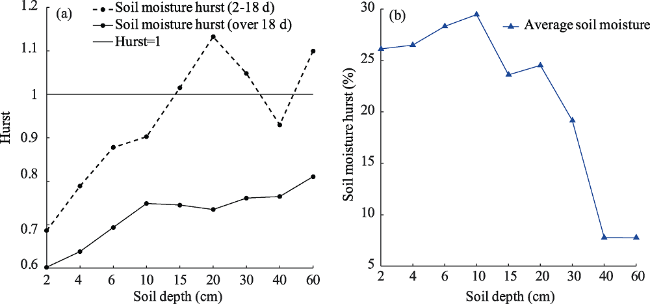
Figure 3 LRC results for soil moisture and the average soil moisture at each soil depth in A’rou superstation from 2014-2015
When comparing the persistence of the two scaling regions and different soil depths, it is evident that the persistence of soil moisture at small timescales is stronger than that at large timescales, and the H indices of soil moisture are higher in shallower soil (depths of 2 to 10 cm). It can be concluded that soil moisture is more sensitive to the changes of external factors and that external factors have a more evident impact on the soil moisture persistence in depths of 2 to 10 cm at large timescales.

4.2 LRCC analyses between soil moisture and different types of radiation

The LRCC indices (Hcor) between soil moisture and different types of radiation (NR, SR and LR) at the A’rou superstation with soil depths of 2 to 60 cm were fitted using the algorithm discussed in Section 3.2. The consistency or anti-consistency between soil moisture and the three types of radiation at different timescales and soil depths are presented in this section.
The LRCC indices at different timescales and soil depths are fitted in Figure 4. Soil moisture and various types of radiation at the A’rou superstation are not independent but display consistent or anti-consistent changes. The linear relationship between Fcor(w) and w is evident under the double logarithmic coordinates for each depth, and the slopes (Hcor) are between 0-1 at all soil depths. There are multiple timescale relationships between soil moisture and these various types of radiation.
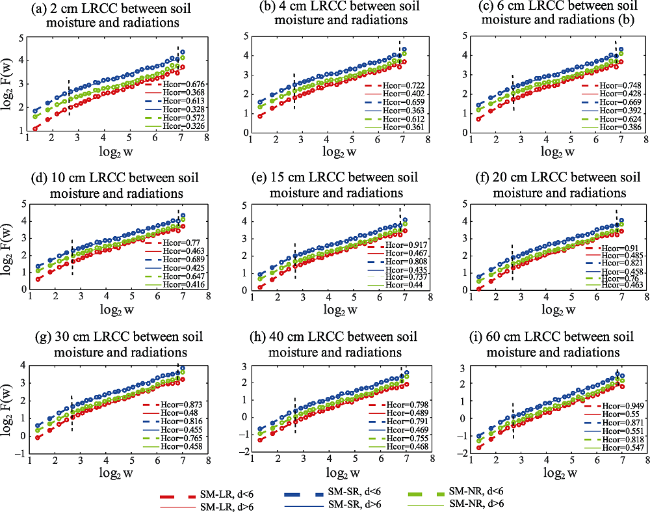
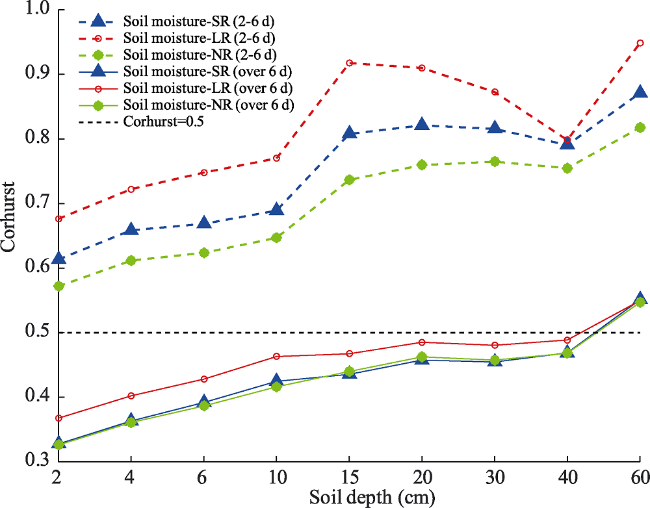
Figure 4 LRCC results for the soil moisture and radiation at each soil depth in A’rou superstation from 2014-2015
In addition, the LRCCs between soil moisture and the three types of radiation all mutate at 6 d timescale. Soil moisture and the radiation represent consistent changes at small timescales and anti-consistent changes at large timescales. It is evident that there is a timescale variation and this variation is the same for these three types of radiation. Fcor(w) can be fitted piecewise using two Hcor indices. The consistency characteristics inflect in these two scaling regions. From Figure 4, the small scaling region (coverage of the dotted line) covers time windows from 1.322 to 2.7 (2- to 6-d estimates). For these three types of radiation, the Hcor indices are between 0.5 and 1 at all soil depths in this region. The large scaling region (coverage of the solid line) covers the log2w time windows over 2.7, which correspond to the actual timescales over 6 d. For these three types of radiation, the Hcor indices are all between 0 and 0.5 at most depths (2-40 cm).
There is different consistency or anti-consistency intensity for different soil depths, with soil depth variation.
From the dotted lines in Figure 5, for 2- to 6-d timescales, the consistency between the three types of radiation and soil moisture displays the same tendency with soil depth (rise in volatility). Additionally, the Hcor indices between soil moisture and radiation all range between 0.5 and 1. The intensity of consistency increases with depth from 2-15 cm and from 40 to 60 cm and decreases with depths from 15 to 40 cm. The LR has the strongest consistency with soil moisture at all soil depths. The strongest and weakest consistencies are at a depth of 2 cm (Hcor=0.676) and 60 cm (Hcor=0.949), respectively. The second strongest consistency with soil moisture is SR (0.613≤Hcor≤0.871). The consistency between the NR and soil moisture is the weakest (0.572≤Hcor≤0.818). The consistency is the weakest at depths between 2 and 4 cm and the Hcor is approximately 0.5.
Figure 5 LRCC results for the soil moisture and radiation at different timescales in A’rou superstation from 2014-2015
From the solid lines in Figure 5, for timescales exceeding 6 d, the anti-consistency between the three types of radiation and soil moisture basically weakens with soil depths between 2 and 40 cm. Moreover, the Hcor indices between soil moisture and radiation are approximately 0-0.5 from 2 to 40 cm. The Hcor slightly exceeds 0.5 at a depth of 60 cm; therefore, there is no anti-consistency between soil moisture and the three types of radiation. The anti-consistency intensity decreases with soil depth from 2-40 cm and this phenomenon is more evident at depths from 2 to 10 cm. The SR and NR have the strongest anti- consistency with soil moisture at all soil depths. The strongest anti-consistency with soil moisture is at a depth of 2 cm, and the Hcor values for SR and NR are 0.328 and 0.326, respectively. The anti-consistency is the weakest at a depth of 40 cm, and the Hcor values for SR and NR are 0.469 and 0.468, respectively. The anti-consistency weakens substantially with soil depths from 2-10 cm (with Hcor increment of approximately 1). However, there are no notable changes in anti-consistency for the soil deeper than 10 cm (changes of Hcor less than 0.05). The anti-consistency between the LR and soil moisture is the weakest (0.368≤Hcor≤0.489). Furthermore, the anti-consistency at depths between 2 and 10 cm weakens significantly with depth.

4.3 Impact of radiation on soil moisture LRC at different timescales and different soil depths

The reasons for the timescale variations and the soil depth variations of LRC and LRCC are explained and discussed in this section.
There is a lagging response of soil moisture to the different types of radiation and there is the same response rate of soil moisture to the influence of external factors (different types of radiation, evapotranspiration, etc.) at each soil depth. The timescale variation of LRC reflects the response rate of the soil moisture to external factors. The intensity of its persistence changes at the 18-d timescale at each depth, while the anti-consistency intensity between soil moisture and radiation mutates at a 6-d timescale. It is notably smaller than the timescale of soil moisture persistence. The trend evolution change of the soil moisture series is lagging behind the impact of the radiation on soil moisture.
The soil depth variation of the soil moisture LRC is mainly affected by different types of radiation through hydrothermal interaction. Radiation affects the hydrothermal coupling process and evapotranspiration of surface soil (Malek et al., 1993; Alberto et al., 2014), and then affects the persistence of the soil moisture sequence at different depths. There are two main aspects of the hydrothermal interaction in the soil in two timescale regions. At small timescales,the soil temperature is higher with the increase of solar radiation (SR), and there will be more energy radiated from the surface (LR) (Shang et al., 2010; Ross et al., 1985). This will actually depress the increase of soil temperature and reduce the evapotranspiration (Juancamilo et al., 2010). This process illustrates “negative feedback” of radiation on the soil temperature and consistency between soil moisture and radiation. The hydrothermal interaction is suppressed, and then the reduction of soil moisture is inhibited. At large timescales,an increase of SR indicates that the surface soil receives more solar radiation, thereby increasing the soil temperature and surface evapotranspiration (Li et al., 2005; Peng et al., 2016). In addition, the increase in soil temperature increases the LR (Stanhill et al., 2013). Radiation has “positive feedback” on temperature and the anti-consistency of soil radiation. The hydrothermal interaction is activated. This process leads to the reduction of soil moisture. Therefore, the consistency property between soil moisture and different types of radiation at specific timescales and soil depths can reflect the intensity of hydrothermal interaction.
In addition, Li et al. (2003) proved that the roots of herbaceous vegetation are mainly distributed in the surface soil at depths of 0 to 40 cm, while little is distributed in deeper soil. More than 50% of the roots are distributed at depths of 0 to 10 cm (Cheng et al., 2009), indicates that the influence range of plant transpiration only exists in the soil shallower than 40 cm and centers in the depths between 2 and 10 cm. It is also indicates that the different types of radiation can only influence soil moisture persistence at soil depths from 2 to 40 cm, especially at depths between 2 and 10 cm.
At small timescales, there is consistency between soil moisture and radiation. The stronger the consistency, the more notable reduction of the evapotranspiration is. Moreover, the consistency and the persistence of soil moisture strengthen with soil depth, especially at depths of 2 to 15 cm. Soil moisture persistence in the study area was mainly affected by LR, followed by SR and NR. The consistency between soil moisture and each type of radiation was the weakest at a depth of 2 cm; therefore, the negative feedback of radiation to temperature was the weakest. The inhibition of hydrothermal interaction was the lowest at this depth, resulting in the weakest soil moisture persistence. The weak soil moisture persistence is mainly related to LR. With the increase of soil depth, the consistency gradually increases and the negative feedback effect of radiation gradually increases. Therefore, the inhibition of hydrothermal interaction increases gradually, and then the soil moisture persistence is strengthened. There is no LRC for the soil moisture series at depths of 20 cm, 30 cm and 60 cm, which might be related to its own dynamic characteristics. At the small timescales, the hydrothermal interaction is suppressed at all depths because radiation has negative feedback on soil temperature. This causes the soil moisture persistence at small timescales to be stronger than that at large timescales at all depths.
At large timescales, there is anti-consistency between soil moisture and radiation. The anti-consistency weakens with soil depth and the persistence of soil moisture strengthens with soil depth from 2 to 40 cm, especially at depths of 2 to 10 cm. Soil moisture persistence in the study area was mainly affected by SR and NR. Radiation affects the soil moisture persistence by promoting hydrothermal interaction at large timescales, and there is an increase in interaction activity as the anti-consistency becomes stronger. The anti-consistency is the strongest at a depth of 2 cm, which indicates the strongest positive feedback of radiation. The hydrothermal interaction activity reaches the highest level, leading to the weakest soil moisture persistence, and it is mainly related to SR and NR. The anti-consistency decreases substantially with soil depth ranging between 2 and 10 cm. It is evident that radiation mainly affects the soil moisture at depths of 2 to 10 cm at large timescales, and the influence weakens with depth. Therefore, the soil moisture persistence at the 2- to 10-cm soil depth range is relatively low and increases substantially with depth. The anti-consistency is relatively weak at depths of 10 to 40 cm and varies slightly with soil depth, which indicates that the influence of radiation on this soil depth range is reduced and basically the same. The soil moisture persistence at depths of 10 to 40 cm is accordingly higher, and there is little difference.

5 Conclusions and prospects

5.1 Conclusions

This paper calculated the LRC indices of soil moisture and LRCC indices between soil moisture and three types of radiation at different soil depths and timescales at the A’rou superstation from 2014 to 2015. The LRC of the soil moisture and LRCC of soil moisture-radiation clarified the soil depth variation and timescale variation. The effects of three types of radiation on the soil moisture persistence at different timescales and soil depths were analyzed through the comparison of H and Hcor indices among different soil depths and timescales.
In summary, the timescale variation of soil moisture persistence is mainly related to the influence process of radiation on soil moisture. At large timescales, the positive feedback effect of radiation on temperature promotes the hydrothermal interaction; therefore, the effect of radiation on soil moisture is stronger. Soil moisture persistence at a large timescales is weaker than that of small timescales. The soil depth variation of soil moisture persistence is mainly related to the range of vertical influence and influence intensity of radiation. Radiation mainly affects the soil moisture at depths of 2-10 cm at large timescales, and there is a depth attenuation effect on the influence intensity. The main conclusions are as follows:
First, the fluctuation of soil moisture is not completely random but represents the persistence. There is lower noise level and a more notable tendency in the soil moisture series. The persistence significantly varies with soil depth and mutates at 18-d timescales. At small timescales, the persistence strengthens with soil depth from 2-15 cm (H increasing from 0.686 to 1.015). From 20-60 cm, only 40 cm soil moisture presents the persistence. At large timescales, the soil moisture persistence strengthens with soil depth from 2-60 cm (H increasing from 0.602 to 0.811), especially from 2-10 cm.
Second, soil moisture and different types of radiation are not independent but with consistency or anti-consistency. The consistency property between them mutates at 6 d timescale and varies with depth. For different types of radiation, tendencies of Hcor indices varied with soil depth are basically the same both at two timescale regions. At small timescales, soil moisture and the radiation present consistency in all soil depths and the consistency strengthens with soil depths of 2-15 cm and 40-60 cm. LR has the strongest consistency with soil moisture (with Hcor from 0.676-0.949), followed by SR and NR. At large timescales, there is anti-consistency. The anti-consistency basically weakens with soil depth from 2-40 cm. especially from 2-10 cm. SR and NR have the strongest anti-consistency with soil moisture (with Hcor from 0.326-0.469 approximately).
Third, there is the lagging effect of response of soil moisture to the different types of radiation. And the influence process of radiation on soil moisture is different under two timescale regions, leading to the timescale variation of soil moisture persistence. At small timescales from 2-6 days, “negative feedback” of radiation on soil temperature suppresses the hydrothermal interaction. With the stronger negative feedback, the hydrothermal interaction is weakened and soil moisture persistence is enhanced. At large timescales more than 6 day, “positive feedback” of radiation on soil temperature promotes the hydrothermal interaction. With the weakness of positive feedback, the hydrothermal interaction is weakened and soil moisture persistence is enhanced. Soil moisture persistence at large timescales is weaker than that of small timescales.
Fourth, the influence intensity of radiation on soil moisture varies with soil depth, leading to the soil depth variation of soil moisture persistence. At small timescales, the soil moisture is affected by radiation at depths of 2 to10 cm. LR has the strongest influence, followed by SR and LR. And the negative feedback of LR strengthens with depth. Therefore, the soil moisture persistence at 2-cm depth is weak and increases with depth significantly. At large timescales, the soil moisture is affected by radiation at depths of 2-40 cm and the influence at 2-10 cm is more considerable. SR and LR have the stronger influence. And the influence intensity decreases with depth. As a result, the soil moisture of 2-10 cm is the weakest and increases with depth from 2-40 cm.

5.2 Prospects

The LRC of soil moisture can determine the intensities of soil moisture persistence at different timescales and soil depths. A stronger persistence indicates a higher predictability for soil moisture series (Lei et al., 2016). The results contribute to time window selection and soil depth determination in land surface climate, ecology and hydrological models. Researchers should choose time windows and soil depths of soil moisture with higher H. These choices will be more reliable for the simulation and prediction of soil moisture with stronger persistence and predictability.
Furthermore, the LRCC between soil moisture and radiation can reveal the reasons for the timescale variation and soil depth variation of the persistence to a certain extent. Hydrothermal interaction under different timescales and soil depths is qualitatively analyzed and plays a significant role in soil system.
In this study, the relationship between soil moisture and radiation was analyzed on a time scale. By LRCC indices, we actualized the quantitative evaluation of various radiations’ effects on the soil moisture persistence on the typical research site we selected. The results depict the evolution characteristics of soil moisture over time and indicate the potential influence of different types of radiation on soil moisture at the research area. The research ideas can be used as a reference in the study of this kind of problems. At the same time, the results can also be applied to a series of areas similar to the geographical environment of the research site.
In addition, researchers can also study the spatial distribution of the effects of radiation on the persistence of soil moisture by establishing multiple observatories.

Acknowledgments

Experimental data in this research is provided by the Heihe Watershed Allied Telemetry Experimental Research (HiWATER) project. It is available from the Environmental and Ecological Science Data Center for West China at http://www.heihedata.org/. We would like to thank the high-performance computing support from the Center for Geodata and Analysis, Faculty of Geographical Science, Beijing Normal University [https://gda.bnu.edu.cn/].
[1]
Alberto M C R, Quilty J R, Buresh R J et al., 2014. Actual evapotranspiration and dual crop coefficients for dry-seeded rice and hybrid maize grown with overhead sprinkler irrigation. Agricultural Water Management, 136(2):1-12.

[2]
Atchley A L, Maxwell R M , 2011. Influences of subsurface heterogeneity and vegetation cover on soil moisture, surface temperature and evapotranspiration at hillslope scales. Hydrogeology Journal, 19(2):289-305.

[3]
Betts A K , 1921. Idealized model for equilibrium boundary layer over land. Journal of Hydrometeorology, 1(6):507-523.

[4]
Biswas A, Zeleke T B, Si B C et al., 2012. Multifractal detrended fluctuation analysis in examining scaling properties of the spatial patterns of soil water storage. Nonlinear Processes in Geophysics, 19(1):1-12.

[5]
Cheng C X, Shi P J, Song C Q et al. 2018. Geographic big-data: A new opportunity for geography complexity study. Acta Geographica Sinica, 73(8):1397-1406. (in Chinese)

[6]
Cheng W J, Cui J Y, Min F H et al., 2009. Root distribution characteristics of three turfgrasses and their impact on soil nutrient content. Acta Prataculturae Sinica, 18(1):179-183. (in Chinese)

[7]
Cong X, Wang X, Mei Y et al., 2017. Scaling analysis of the wind speed time-series based on adaptive fractal analysis method. Hydropower & New Energy, ( 11):1-6. (in Chinese)

[8]
Fei X L, Zhang X M, Jing L Y et al., 2013. Vertical variability of soil moisture content in semiarid loess region: A case study of Sunjiacha basin of Lanzhou in Gansu Province. Acta Pedologica Sinica, 50(4):652-656. (in Chinese)

[9]
Gao J, Hu J, Mao X et al., 2012. Culturomics meets random fractal theory: Insights into long-range correlations of social and natural phenomena over the past two centuries. Journal of the Royal Society Interface, 73(9):1956-1964.

[10]
Gao X F, Liu Y H, Guo J Q et al., 2015. Research on change of soil moisture content based on detrended fluctuation analysis. Soils, 47(1):188-191. (in Chinese)

[11]
Gu L, Meyers T, Pallardy S G et al., 2006. Direct and indirect effects of atmospheric conditions and soil moisture on surface energy partitioning revealed by a prolonged drought at a temperate forest site. Journal of Geophysical Research Atmospheres, 111(D16). .

[12]
Han L Y, Zhang Q, Jia J Y et al., 2014. Hydrological and ecological modeling in Shiyang River Basin. Chinese Journal of Soil Science, 45(2):352-357. (in Chinese)

[13]
He H D, Wang J L, Wei H R et al., 2016. Fractal behavior of traffic volume on urban expressway through adaptive fractal analysis. Physical Statistical Mechanics & Its Applications, 443:518-525.

[14]
Huang Z G, Ouyang Z Y, Li F R et al., 2009. Spatial and temporal dynamics in soil water storage under different use types of sloping fields: A case study in a highland region of southern china. Acta Ecologica Sinica, 29(6):3136-3146. (in Chinese)

[15]
Jiang A, Gao J , 2017. Fractal analysis of complex power load variations through adaptive multiscale filtering. International Conference on Behavioral, Economic and Socio-Cultural Computing( pp.1-5). IEEE.

[16]
Juancamilo V, Davidd B, Zou C et al., 2010. Ecohydrological controls of soil evaporation in deciduous drylands: How the hierarchical effects of litter, patch and vegetation mosaic cover interact with phenology and season. Journal of Arid Environments, 74(5):595-602.

[17]
Karelin D V, Zamolodchikov D G, Zukert N V et al., 2013. Interannual changes in par and soil moisture during warm season may be more important than temperature fluctuations in directing annual carbon balance in tundra. Biology Bulletin Reviews, 3(5):371-387.

[18]
Kirchner M, Schubert P, Liebherr M et al., 2014. Detrended fluctuation analysis and adaptive fractal analysis of stride time data in Parkinson’s Disease: Stitching together short gait trials. Plos One, 9(1): e85787. .

[19]
Kuznetsov N, Bonnette S, Gao J et al., 2013. Adaptive fractal analysis reveals limits to fractal scaling in center of pressure trajectories. Annals of Biomedical Engineering, 41(8):1646.

[20]
Lei J, Xia Z, Lu W , 2016. Long-range correlations of global sea surface temperature. Plos One, 11(4), e0153774. . 0153774.

[21]
Li G W, Feng Q, Zhang F P et al., 2014. The soil infiltration characteristics of typical grassland in Babao River Basin of Qilian Mountain. Agricultural Research in the Arid Areas, 32(1):60-59. (in Chinese)

[22]
Li P, Li Z B, Hao M D et al., 2003. Root distribution characteristics of natural grassland on Loess Plateau. Research of Soil & Water Conservation, 10(1):144-843. (in Chinese)

[23]
Li X, Cheng G, Liu S et al., 2013. Heihe watershed allied telemetry experimental research (hiwater): scientific objectives and experimental design. Bulletin of the American Meteorological Society, 94(8):1145-1160.

[24]
Li Y N, Zhao L, Xu S X et al., 2005. An analysis on the effects of coverage change on soil climate of alpine Kobresia humilis meadow. Journal of Arid Land Resources & Environment, 19(Suppl.1):127-131. (in Chinese)

[25]
Liu M, Bárdossy A, Li J et al., 2012. Physically-based modeling of topographic effects on spatial evapotranspiration and soil moisture patterns through radiation and wind. Hydrology and Earth System Sciences, 16(2):357-373.

[26]
Liu S M, Xu Z W, Wang W Z et al., 2011. A comparison of eddy-covariance and large aperture scintillometer measurements with respect to the energy balance closure problem. Hydrology & Earth System Sciences, 15(4):1291-1306.

[27]
Liu W, Xu X, Kiely G , 2012. Spatial variability of remotely sensed soil moisture in a temperate-humid grassland catchment. Ecohydrology, 5(5):668-676.

[28]
Malek E , 1993. Rapid changes of the surface soil heat flux and its effects on the estimation of evapotranspiration. Journal of Hydrology, 142(1-4):89-97.

[29]
Maltese A, Bates P D, Capodici F et al., 2013. Critical analysis of thermal inertia approaches for surface soil water content retrieval. International Association of Scientific Hydrology Bulletin, 58(5):1144-1161.

[30]
Mandelbrot B B , 1991. The Fractal Geometry of Nature. BirkhauserVerlag.

[31]
Ni G Y, Zhao P, Zhu L W et al., 2015. Hydraulic responses of whole tree transpiration of Schima superba to soil moisture in dry and wet seasons. Acta Ecologica Sinica, 35(3):652-662. (in Chinese)

[32]
Ouyang X, Chen D, Duan S B et al., 2017. Validation and analysis of long-term AATSR land surface temperature product in the Heihe River Basin, China. Remote Sensing, 9(152). .

[33]
Parinussa R M, Wang G, Holmes T R H et al., 2014. Global surface soil moisture from the microwave radiation imager onboard the Fengyun-3b satellite. International Journal of Remote Sensing, 35(19):7007-7029.

[34]
Peng C K, Buldyrev S V, Havlin S et al., 1994. Mosaic organization of DNA nucleotides. Physical Review E, 49(2):1685-1689.

[35]
Peng H, Zhao C, Liang J , 2016. Daily variation of evapotranspiration rate of alpine grassland and analysis of its environmental factors in upper reach of Heihe River. Journal of Water Resources & Water Engineering, 27(1):46-53. (in Chinese)

[36]
Podobnik B, Jiang Z Q, Zhou W X et al., 2011. Statistical tests for power-law cross-correlated processes. Physical Review E Statistical Nonlinear & Soft Matter Physics, 84(2):66-118.

[37]
Porporato A, D’Odorico P, Laio F et al., 2002. Ecohydrology of water-controlled ecosystems. Advances in Water Resources, 25(8-12):1335-1348.

[38]
Riley M A, Bonnette S, Kuznetsov N et al., 2012. A tutorial introduction to adaptive fractal analysis. Frontiers in Physiology, 3: 371. . 00371.

[39]
Ross P J, Williams J, Mccrown R L , 1985. Soil temperature and the energy balance of vegetative mulch in the semi-arid tropics (1): Static analysis of the radiation balance. Australian Journal of Soil Research, 23(4):493-514.

[40]
Sadeghi M, Jones S B, Philpot W D , 2015. A linear physically-based model for remote sensing of soil moisture using short wave infrared bands. Remote Sensing of Environment, 164:66-76.

[41]
Shadkhoo S, Jafari G R , 2009. Multifractal detrended cross-correlation analysis of temporal and spatial seismic data. European Physical Journal B, 72(4):679-683.

[42]
Shang L, Lv S, Li S et al., 2010. Effect of soil freezing and thawing on surface radiation over Qinghai-Tibet Plateau. Acta Energiae Solaris Sinica, 31(1):12-16. (in Chinese)

[43]
Shen S, Ye S, Cheng C et al., 2018. Persistence and corresponding time scales of soil moisture dynamics during summer in the Babao River Basin, Northwest China. Journal of Geophysical Research: Atmospheres, 123:1-13.

[44]
Song C Q, Cheng C X, Shi P J , 2018. Geography complexity: New connotations of geography in the new era. Acta Geographica Sinica, 73(7):1204-1213. (in Chinese)

[45]
Song C Q, Yuan L H, Yang X F et al., 2017. Ecological-hydrological processes in arid environment: Past, present and future. Journal of Geographical Sciences, 27(12):1577-1594.

[46]
Song R L, Yu J J, Liu C M et al., 2011. Long-range correlations of soil moisture series with detrended fluctuation analysis. Journal of Hydraulic Engineering, 42(3):315-322. (in Chinese)

[47]
Stanhill G, Rosa R, Cohen S , 2013. The roles of water vapour, rainfall and solar radiation in determining air temperature change measured at Bet Dagan, Israel between 1964 and 2010. International Journal of Climatology, 33(7):1772-1780.

[48]
Wang D H, Suo Y Y , 2014. Cross-correlation and risk measurement between CSI 300 index futures and spot markets in China. Systems Engineering-Theory & Practice, 34(3):631-639.

[49]
Wang J, Zhao D Q , 2012. Detrended cross-correlation analysis of electroencephalogram. Chinese Physics B, 21(2):577-580. (in Chinese)

[50]
Wang P, Wang J , 2012. Detrended cross-correlation analysis: A new method for gait signal analysis. Journal of Biomedical Engineering, 29(6):1193-1196. (in Chinese)

[51]
Wang Q F, Zhang T J, Peng X Q , 2013. Freezing and thawing processes and their impact on ground surface radiation balance in the upper reaches of Heihe river. Journal of Lanzhou University, 49(2):182-191. (in Chinese)

[52]
Wei J, Dirmeyer P A, Guo Z , 2008. Sensitivities of soil wetness simulation to uncertainties in precipitation and radiation. Geophysical Research Letters, 35(15):189-193.

[53]
Xie X H, Cui Y L, Zhou Y T , 2008. Long-term correlation and multi-fractality of reference crop evapotranspiration time series. Journal of Hydraulic Engineering, 39(12):1327-1333. (in Chinese)

[54]
Yang J, Su K, Ye S J , 2019. Stability and long-range correlation of air temperature in the Heihe River Basin. Journal of Geographical Sciences, 29(9):1462-1474.

[55]
Zhang L, Dawes W R, Walker G R , 2001. Response of mean annual evapotranspiration to vegetation changes at catchment scale. Water Resources Research, 37(3):701-708.

[56]
Zhang L F, Zhang J Q, Zhang X et al., 2017. Characteristics of evapotranspiration of degraded alpine meadow in the Three-River Source region. Acta Agrestia Sinica, 25(2):273-281. (in Chinese)

[57]
Zhang T, Shen S, Cheng C et al., 2018. Long-range correlation analysis of soil temperature and moisture on A’rou hillsides, Babao River Basin. Journal of Geophysical Research: Atmospheres, 123:12606-12620.

Outlines

/