Review Articles

Evolution of transportation in China since reform
and opening up: Patterns and principles

  • JIN Fengjun 1 ,
  • CHEN Zhuo 1, 2, 3
Expand
  • 1. Institute of Geographic Sciences and Natural Resources Research, CAS, Beijing 100101, China
  • 2. University of Chinese Academy of Sciences, Beijing 100049, China
  • 3. School of Geography, Beijing Normal University, Beijing 100875, China

Jin Fengjun (1961-), Professor, specialized in transport geography and regional development studies. E-mail: jinfj@igsnrr.ac.cn

Received date: 2019-02-12

  Accepted date: 2019-04-08

  Online published: 2019-12-09

Supported by

National Natural Science Foundation of China(No.41771134)

Strategic Priority Research Program of the Chinese Academy of Sciences(No.XDA19040403)

Copyright

Copyright reserved © 2019. Office of Journal of Geographical Sciences All articles published represent the opinions of the authors, and do not reflect the official policy of the Chinese Medical Association or the Editorial Board, unless this is clearly specified.

Abstract

This paper reviews the process of transportation construction in China and investigates the developmental and spatial characteristics of transportation patterns. The principles of transportation evolution including stages, structures and orders are systematically analyzed. The investigation shows that China’s transportation construction mode has upgraded from investment-driven scale expansion to quality improvement driven by efficiency and promotion. The rapid growth and development of transportation networks has significantly influenced economic and social activities in time and space. The resulting spatial convergence and dominance have improved distribution, promoting development of the socioeconomic structure. Regional development that has traditionally been based on corridors has changed into a networked mode centered on cities and metropolitan areas. The transportation pattern follows evolutionary principles. China has been moving from a hierarchical structure to a cascade structure. Simultaneously, the socioeconomic pattern has changed from an axis to a hub-and-spoke structure with a preliminary ordered network. As transportation networks grow, China’s functional spatial structure and ordered network will gradually become stabilized and balanced.

Cite this article

JIN Fengjun , CHEN Zhuo . Evolution of transportation in China since reform
and opening up: Patterns and principles[J]. Journal of Geographical Sciences, 2019
, 29(10) : 1731 -1757 . DOI: 10.1007/s11442-019-1688-9

1 Introduction

Transport plays a fundamental role in the support and development of the national economy. It is closely related to growth in many sectors of the economy, as well as enabling the optimization of regional advances and the improvement of the living environment (Chen et al., 2000). Since 1979, with the policy of opening up and the advent of reform, the transport infrastructure in China has grown rapidly, resulting in historic increases in the size of the network. Enormous progress has been made in all parts of the infrastructure, and this has played an important role in optimizing the efficiency and environment of regional development in China.
Economic geographers need to comprehend the developmental characteristics and patterns of transport systems in China. To achieve that goal, there are three key aspects to consider. Firstly, the characteristics and spatial results of the transport network should be clarified, including the distribution, combination and different types of infrastructure, the stages and modes of network expansion, as well as the identification, evaluation and modelling of the convergence effects on improving the transport pattern. Previous studies have mainly focused on either a single-sector transport network or a regional transport network. The former included studies on freeways (Wang et al., 2011), high-speed railways (HSRs) (Jiao et al., 2017; Jin et al., 2017) and port systems (Jian et al., 2016), while the latter have mainly focused on the national strategic development regions and metropolitan areas, such as the Beijing-Tianjin-Hebei region (Chen et al., 2017) and the Yangtze River Delta region (Jiang et al., 2010). Secondly, a full understanding is needed of the economic and geographical basis of the traffic flow, which is very important for explaining the configurations and mechanisms of transport networks. Early studies in this subject area were mainly carried out with the time schedule data, which was generally collected from the timetables released by different carriers (Zhang et al., 1992; Smith and Timberlake, 2001; Wang et al., 2014). In recent years, with the development of technology for data collection and analysis, traffic information, such as the passenger flow of HSRs and freeways, is increasingly available for researchers (Ke et al. 2016; Chen et al., 2018), resulting in a significant improvement in the characterization of traffic flow networks. Last but not least, what role does transport play in regional development? The relationship between transport and regional development has always been the focus of transport geography. Previous studies mainly looked at the interaction between transport and other socioeconomic elements, including the city network (Mo and Wang, 2012; Wang et al., 2014), built-up areas (Li and Sun, 2013), land use (Cui et al., 2018) and industrial development (Wang et al., 2017). Some of these studies were carried out to clarify the role transport infrastructure plays in the formation and evolution of functional urban entities such as metropolitan areas and traffic economic belts (Han et al., 2000; Zhang et al., 2002; Jiao et al., 2016).
Previous studies have made many advances in both theoretical innovation and practical application. A relatively complete, cutting-edge measurement system has been created for the modeling and evaluation of spatial accessibility and transport dominance, allied to a transportation network analysis. However, little attention has been paid to the developmental characteristics and principles of integrated transportation geography on the national scale. Since the advent of reform and the policy of opening up, great changes have been seen in the transportation pattern in China, driven by the rapid construction of the infrastructure. It is important to understand its growth and predict the developmental trends for future planning of construction and regional development. This study, therefore, aims to reach a comprehensive understanding of the evolution of transportation in China since the reform period. The first section summarizes the stages, policies and achievements of the transport construction process. Then the developmental characteristics are explored and the spatial effects are modelled, followed by a section generalizing the principles of integrated transportation geography, including the evolutionary stages, spatial configurations and orders. The article concludes with a discussion of academic issues worth studying in the future.

2 The development of transportation in China

Remarkable achievements have been made in the development of transport in China since the founding of the People’s Republic, and especially in the last 40 years of the country’s reform and opening up. An effective integrated transportation system has been constructed, associated with a rapid increase in the scale of infrastructure and significant improvements in transport technologies. The construction of the transportation network in China went through a relatively backward stage in the 20th century, but the need to support economic and social development has led to changes in the past decade which have solved the problem of insufficient supply capacity. Numerous different data sources show that the development of transportation in China has undergone a step change to a new level of improvement.

2.1 Construction of infrastructure and the increase in transportation volumes

2.1.1 Construction of transport infrastructure
The construction of transport infrastructure accelerated during the last decade, creating an integrated network with different modes of transportation. In 2017, there were 127,000 km of railways, 4,338,600 km of standard highways, 229 civil airports, 1,913 10,000-ton capacity ship berths, 127,000 km of inland waterways and 119,300 km pipelines in China, which are 2.4, 8.3, 2.9, 13.3, 1.2 and 13.7 times the figures for 1980, respectively (Table 1). In terms of the quality of the infrastructure, from 1980 to 2017, the proportion of electrified railways, standard highways and inland waterways has increased from 3.2%, 58.7% and 49.7% to 68.5%, 90.9% and 52.1%, respectively. In 2017, there were 136,400 km of freeways connecting most of the cities with a population of more than 200,000. The operating mileage of HSR was 25,000 km, connecting 80% of cities of more than 1 million people. 88 high-grade airports (above 4D) were constructed, forming an aviation network covering major cities with Beijing, Shanghai and Guangzhou (Shenzhen) as hubs. 359 berths with a capacity of more than 100,000 tons were built, comprising seven port clusters in Liaoning, Tianjin-Hebei, Shandong, Fujian and Guangxi coastal areas, the Pearl and Yangtze river deltas, as well as five specialized port systems for oil, coal, mining, containers and grain.
Table 1 Achievements in transportation construction from 1980 to 2017 in China
Year Railways
(1000 km)
Standard highways (1000 km) Inland waterways (1000 km) Pipeline
(1000 km)
Civil airports 10,000-ton berths
Total HSR Total Freeway
1980 53.3 - 521.1 - 108.5 8.7 78 144
2000 68.7 - 1315.9 16.3 119.3 24.7 139 518
2017 127.0 25.0 4338.6 136.4 127.0 119.3 229 1913

Data sources: National Bureau of Statistics of China (http://data.stats.gov.cn/)

2.1.2 Growth and modernization of transportation vehicles
The number of vehicles has seen a huge increase and the technologies have improved significantly. In 2017, there were 209.1 million civil motors, 21,081 railway locomotives and 3,296 civil aircraft, which are 117.3, 2.0 and 16.2 times the figures for 1980, respectively (Table 2). The total deadweight tonnage of civil ships was 246.8 million tons, 21.2 times that of 1980. Transportation technology has also been significantly modernized. In 2017, electric locomotives accounted for 59.5% of the total number of locomotives, an increase of 56.8% since 1980. The number of large and medium-sized civil aircraft increased from 330 in 1995 to 3120 in 2017, accounting for 94.7% of the total civil aircraft. The average deadweight tonnage of civil ships was 1872.9 tons in 2017, of which the figure for oceangoing ships was more than 25,000 tons, indicating a significant large-scale trend. With regard to operational efficiency, in 2017 the average figures for passenger and freight turnover per locomotive were 63.8 million passenger-kilometers and 127.9 million ton-kilometers, which are 4.9 times and 2.4 times what they were in 1980, respectively. The average turnover of passenger and freight per aircraft were 289 million passenger-kilometers and 7.4 million ton-kilometers, i.e. 2.6 and 1.8 times the 1980 figures.
Table 2 Improvement in transportation vehicles from 1980 to 2017 in China
Year Civil motors
(million)
Civil aircraft Locomotives Deadweight tonnage of civil ships
Total Cars Total Large and
medium-sized ones
Total Electric ones Total
(million tons)
Average (tons)
1980 1.8 - - - 10665 287 12.2 -
2000 16.1 6.3 527 462 15253 3516 42.6 230.5
2017 209.1 185.2 3296 3120 21081 12543 246.8 1872.9

Data sources: National Bureau of Statistics of China (http://data.stats.gov.cn/)

2.1.3 Transportation volumes and structure
The ability of transport to serve the national economy and people’s livelihoods has been significantly improved. From 1980 to 2017, the Revenue Passengers (RP) have increased from 3.4 billion passengers to 18.5 billion passengers, and the Revenue Passenger Kilometers (RPK) have increased from 228.1 billion passenger-kilometers to 3281.3 billion passenger-kilometers, which are increases of 4.40 and 13.38 times respectively. The Freight Volume (FV) has increased from 3.1 billion tons to 48.1 billion tons, and the Revenue Freight Ton Kilometers (RFTK) have increased from 1,162.9 billion ton-kilometers to 19,737.3 billion ton-kilometers, which are increases of 14.5 and 16.0 times respectively (Table 3). All these figures are indicative of the great progress that has been made in the national economy and people’s living standards.
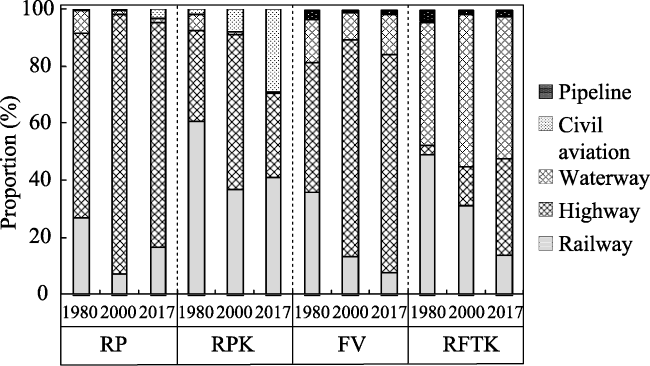
Table 3 Achievements of transportation volumes from 1980 to 2017 in China
Year RP (billion
passengers)
RPK (billion passenger- kilometer) FV (billion tons) RFTK (billion ton-kilometers)
1980 3.4 228.1 3.1 1162.9
2000 14.8 1226.1 13.6 4432.1
2017 18.5 3281.3 48.1 19737.3

Data sources: National Bureau of Statistics of China (http://data.stats.gov.cn/)

The transportation structure has been continuously optimized. For RP, highways have accounted for a far higher proportion than other modes of transport during the last 40 years (Figure 1). From 1980 to 2000, the proportion accounted for by highways increased from 64.8% to 91.1%, while the proportion accounted for by railways continued to drop from 26.8% to 7.1%. Thereafter, benefiting from railway speed increases and HSR construction, the railway proportion increased to 16.7% and highway proportion decreased to 78.9%. For RPK, a similar V- shaped pattern in railway numbers can also be observed in Figure 1, and civil aviation accounted for a growing share from 1.7% to 29.0%. For FV and RFTK, highway accounted for a higher and higher proportion while the railway volumes continued to decrease. The role waterways played in freight transportation has remained significant, RFTK staying stable at around 50% since 2000.
Figure 1 Changes in passenger and freight transportation structures from 1980 to 2017

Data sources: National Bureau of Statistics of China (http://data.stats.gov.cn/)

2.2 Development and achievements

In the past 40 years, the development of transportation in China has made outstanding advances. The scale of the infrastructure networks, the modernization of the transportation vehicles, the service capacity and scope have all reached a condition compatible with the demands arising from socioeconomic development. This progress indicates a transition in the relationship between transport and development from bottleneck to adaptation. In recent years, transport in China has entered a new stage of improvement, with the main task now being the coordination of different resources to construct a more integrated system.
The scale of transportation in China is one of the largest in the world. In 2017, the mileages of freeway, HSR and inland waterway were the longest in the world, and the mileage of HSR accounted for 66.3% of the whole world. The mileages of highway and railway were second only to those of the United States (Table 4). The largest container berth, ore berth, crude oil berth and coal berth in the world and seven of the world's top 10 ports are all located in China. Shanghai Pudong International Airport, Beijing Capital International Airport and Guangzhou Baiyun International Airport are the world’s top 20 airports in passenger throughput. The Revenue Tonne Kilometers (RTK) and RPK of civil aviation are both ranked second in the world, and the pipeline mileage is ranked third in the world after the United States and Russia.
Table 4 Comparison of transportation networks in China and other countries in the early 21st century (data in 2006, unit: 1000 km)
Types EU USA Japan Russia China China*
Highway 5000 6430 1197 755 3457 4773.5*
Freeway 63.4 102.2(1) 7.4(2) 29 45.3 136.4*
Railway 215.9 229(3) 27.6 85.5 77.1 127.0*

Notes: (1) data in 2007; (2) the national highway; (3) data in 2005; *data in 2017.
Data sources: National Bureau of Statistics of China (http://data.stats.gov.cn/); World Macroeconomic Database of SINA Finance (http://finance.sina.com.cn/worldmac/)

A significant growth has also been achieved in the transport infrastructure per capita. In 2017, the mileages of railway and highway per capita in China were 0.1 m and 3.4 m, which are 1.7 times and 3.8 times the 1980 figures, respectively (Table 5). The freeway was constructed particularly fast, and from nothing. The mileage of freeway per capita was 0.1 m in 2017, which was 0.8 times that of the EU and 1.7 times Japan respectively.
Table 5 Change in transportation infrastructure per capita from 1980 to 2017 (m)
Types 1980 2000 2017
Railway 0.05 0.05 0.09
Highway 0.90 1.33 3.43
Freeway - 0.01 0.10

Data sources: National Bureau of Statistics of China (http://data.stats.gov.cn/)

The service capacities and transport scope in China have been continuously improved, playing an important role in the expansion of living space, the sharing of resources and improvements to the living environment, thus supporting the sustainable development of the economy and society as a whole. In 2017, more than 90% of the population and industry in China were covered by the 1h service hinterland of the main transportation network, including railways, freeways and airports. More specifically, greater than 95% of the population and industry in China were covered by the 1h service hinterland of railways and freeways. Greater than 60% of the population and 75% of the industry in China were covered by the 1h service hinterland of airports. The proportion of provincial capitals connected by the main network is 100%, as are 90% and 60% of the prefecture-level cities and counties, respectively (Table 6). 99.4% of all towns have been connected by hard-surfaced roads.
Table 6 Accessibilities of administrative units in China to the railway, freeway and airport in 2017
Administrative ranks Infrastructure Accessible ones Proportion
Prefecture-level city Railway 312 93.41
Freeway 325 97.31
Airport 214 64.07
County Railway 1872 65.66
Freeway 2287 80.22
Town Hard-surfaced roads 39,645 99.39

Data sources: Calculated by authors, except for the data of towns, which is quoted from the Statistical Bulletin on the Development of the Transportation Industry in 2017 published by the Ministry of Transport of the People's Republic of China (http://www.mot.gov.cn/)

2.3 Drivers and the main policies

Serving regional development is one of the core goals of transport construction, and this has been influenced both by a regional strategy and transportation management, as well as by technological innovation. After 40 years of construction, the focus of transportation development has changed from simple expansion driven by investment to quality improvement driven by optimization and promotion.
Transportation construction in China is planned and promoted through the central government’s regional strategy. In the early period of reform and opening up (1980-1992), with the implementation of the Economic Development Strategy of Coastal Areas, the key transport construction zones moved eastward simultaneously. The rapid building of seaports, railways and national highways has enabled the development of a more open, export-oriented economy (Figure 2) since the early 1990s (1992 onwards). Inter-regional transportation corridors, such as the Beijing-Kowloon Railway and the Nanning-Kunming Railway, were constructed as strategic projects, and served the increased transport demand for inter-regional linkages and foreign trade. Subsequently, the implementation of the West Development Strategy promoted construction projects in western China. The fast-paced development of metropolitan areas made the intercity rapid transit systems and transportation corridors connecting different metropolitan areas into major construction zones. With the promotion of the Belt and Road Initiative, the transnational corridors have recently become the focus of construction.
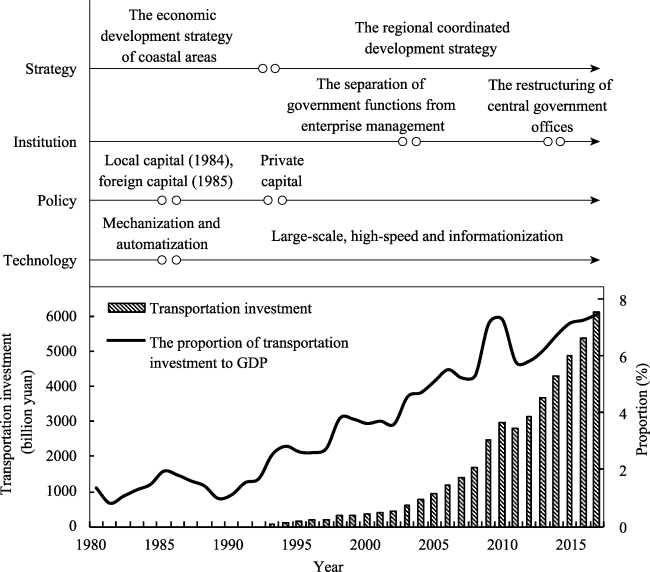
Figure 2 Driving factors and landmark events of transportation construction in ChinaData sources: The transportation investment data refer to transportation, warehousing and postal investment, and are quoted from the National Bureau of Statistics of China (http://data.stats.gov.cn/)
The management system affects not only the integrity and quality of transportation planning and construction, but also the sharing of strategic resources. Before the advent of reform and opening up policies, the transportation management system of China was characterized by a combination of government function and enterprise management. It was highly centralized, with mandatory plans for production and departmental separation, resulting in the absolute dominance of central government over investment and management. After reform, the transportation management system was gradually improved through the separation of government functions from enterprise management, the division of power between the central and local governments, and the reform of state-owned enterprises. By 2002, except for the railways, all other sectors (highways, waterways and civil aviation) achieved a separation of government functions from enterprise management, with localized control developing for highways, ports and airports. The modern management system for transport enterprise was subsequently established, encouraging enterprises and local governments to carry out transportation construction. In 2008, when the central government offices were restructured, the Ministry of Communications, the Civil Aviation Administration and the duties of urban passenger transport management of Ministry of Housing and Urban-Rural Development were all integrated to establish the Ministry of Transport of the People’s Republic of China. In 2013, the Ministry of Railways separated enterprise management from government functions. The administrative duty of formulating development plans and policies for railways was allocated to the new Ministry of Transport. At the same time, the National Railway Administration managed by the Ministry of Transport was set up to assume other administrative duties of the Ministry of Railways. With these reforms, the duties of planning, construction and management of the integrated transport system were unified in central government, ending the previous long-term departmental separations.
Transportation development policies, including investment, financing, tariffs and taxation, are closely related to the management system. Among all of the related policies, investment and financing have the most direct influence on the structure and scale of construction, being continuously diversified and market-oriented since the period of reform and opening up. Policy changes were initiated to attract a wider range of investors; in 1984 local governments were allowed to invest in ports and airports; in 1985, foreign capital was allowed for the building of ports; in 1993, use of private capital was permitted for the transportation construction. Moreover, various construction funds emphasizing the new market-oriented operation were established, including the Civil Aviation Development Fund, the Railway Development Fund, etc., and tax-reform of transportation was vigorously promoted. All these measures helped provide a more solid base for the funding of rapid construction. In 2016, transport construction investment was over CNY 5000 billion in China, increasing 864 times compared with 1980, with an average annual growth rate of more than 20% since the reform period,
Technological innovations help to improve transport capacity and service. In the early reform period, the main focus was on changes to transportation equipment, including large improvements, not only to the proportion of electrified railways and the automatic blocking mileage, but also the technology of civil aviation and navigation facilities. Moreover, a number of specialized, mechanized and automated berths were constructed along the coast. Since 1985, transport’s developmental direction has evolved towards a large-scale, high-speed, information-led and strongly professional organization. The construction of deep-water berths, large airports, freeways, HSRs, and the development of intelligent management systems have all been successfully carried out. In recent years, technological innovation has improved capacity and service standards, so that the developmental pathway has moved from simple expansion driven by investment, to quality improvement driven by a need for efficiency and promotion.

3 Evolution of the pattern of transportation geography

3.1 Spatial characteristics of the expansion of transportation networks

Improvements to the technical grade and quality of the infrastructure have been prioritized since the 1980s, with continued network expansion as a secondary aim. This has resulted in a spatial focus on the upgrading of the main transportation network gradually from east to west. From 1980 to 1990, the proportion of the national railway mileage accounted for by the eastern network increased by 1.4%. The newly built highway mileage was 195,000 km, accounting for 42.3% of the nationwide construction over the same period. The main areas of transportation construction moved to the central and western regions during the period of the Ninth Five-Year Plan (1995-2000). The proportion of the transportation investment in the central and western regions increased by 0.2% and 7.6% respectively, compared with the period of Eighth Five-Year Plan (1990-1995). As a result, newly built highway mileage in the central and western regions accounted for 35% and 32% of the nationwide newly constructed mileage respectively. Together, these formed an integrated network with main transportation corridors covering the eastern, central and western regions.
In the mid-to-late 1990s, the freeway network in China entered a period of rapid construction, which showed significant localization characteristics following a “local-regional- national” pathway (Figure 3). In the early period of freeway construction, the focus was on two aspects: one was meeting the transportation demands between the capital and other important cities in the province; the other one was meeting the transportation demands along the regional development axes, resulting in local networks centered on provincial capitals. As the local networks expanded continuously, a regional network across provinces was gradually formed with the creation of corridors of major communications between provinces. In 2005, the major freeway networks in the Beijing-Tianjin-Hebei region, Shandong Province, Henan Province and the Yangtze River Delta region were all essentially constructed, achieving a preliminary integration. The very earliest arterial freeways which were opened to traffic on the national scale included the Beijing-Shanghai freeway, the Shenyang-Haikou freeway (the section from Shenyang to Zhanjiang), and the Beijing-Hong Kong-Macau freeway. The pattern became increasingly dense around the provincial capitals and along with subsequent arterial freeways, eventually formed an integrated national network. In 2018, except for the Tibet Autonomous Region, Hainan Province and Taiwan Province, the freeway networks have all been connected together, providing effective support for socioeconomic development in China.
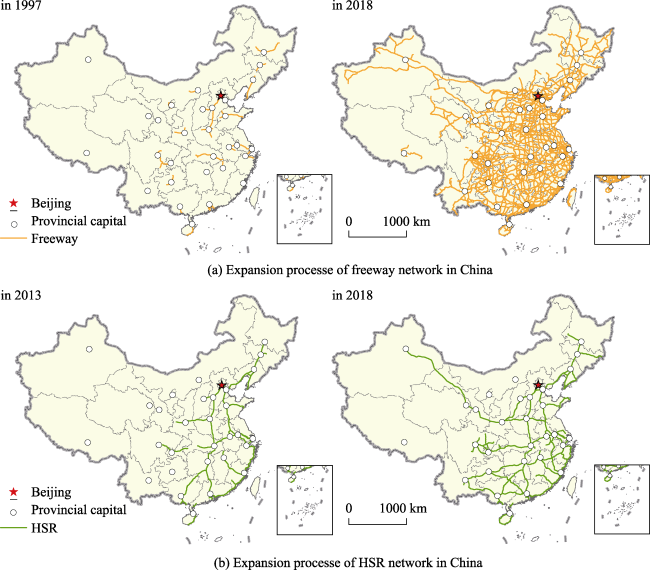
Figure 3 Expansion processes of high-speed transportation networks in China

Data sources: The data of transportation network in 2018 was collected from the Baidu Map Open Platform (http://lbsyun.baidu.com/). The data in 2003 and 2013 was collected from the maps published by the Thematic Database for Human-earth System of Chinese Academy of Sciences (http://www.data.ac.cn/xiazai/xiazainew.asp), and the National Geomatics Center of China (http://www.ngcc.cn/).

Contrasting with the freeway network, the HSR (built since the early 21st century), was developed as a major national network after a period of point-to-point construction (Figure 4). In 2013, the national arterial HSRs such as Beijing-Shanghai HSR and Beijing-Guangzhou HSR were completed. Most of the others which opened, including Zhengzhou-Xi’an HSR, Shijiazhuang-Taiyuan HSR, Harbin-Dalian HSR, and Southeast Coast HSR, belonged to the main national network. Subsequently, as the main network continually expanded, some local networks began, centered on regional cities, such as Guangzhou, Nanjing, Chengdu, Wuhan, Changsha and Zhengzhou.
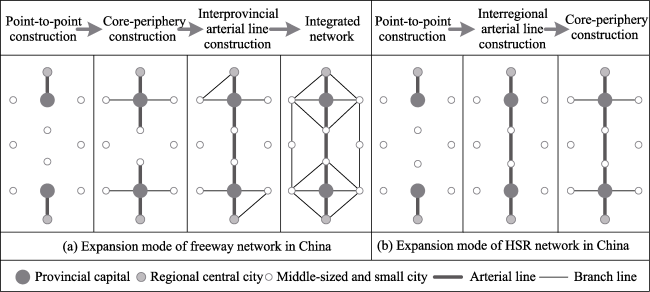
Figure 4 Expansion modes of the high-speed networks in China
The variation in the expansion modes of the freeway and HSR networks is mainly due to differences in technical and economic characteristics, socioeconomic service objectives, and the different entities investing in the two networks. The freeway, which can be adapted for both passengers and freight, has an absolute advantage over shorter distances, i.e. less than 300 km (Shen and Deng, 2003), and is suitable for serving regional hub-and-spoke transportation demand networks centered on cities. The HSR, which is characterized by large capacity and high speed, has an advantage over longer distances, and is suitable for serving the intensive passenger demands along the main development axes at both national and regional scales. In terms of investment entities, freeways implement localized management soonest of all the transportation modes. The proportion of local self-raised funds in the total investment has been above 40% since 2003, and has been close to 50% in some years. For railway investment, the proportion of local self-raised funds was less than 30% from 2008 to 2014, and only 21.1% in 2014. The different technical/economic characteristics and investment composition mean that there is an important role for local government in the construction of the freeway network. This results in the local-regional-national expansion model of the freeway network centered on the provincial capitals, while the expansion mode of HSR network entails the construction of inter-regional arterial lines first.
The airport and port systems have undergone changes that tend to promote clustering. If we examine the construction of hub and arterial airports, 119 civilian airports had been built before 2000, including 57 of grade 4D or 4E, and 62 of 4C or 3C. The province-level municipalities and provincial capitals all had 4D or 4E airports, forming the preliminary pattern of the airport system in China. Since 2000, projects such as extension, relocation and second airport construction have all been carried out to improve the capacity of hub and arterial airports. However, focusing on improvements to the spatial layout of the system, many feeder airports around the hub and arterial airports have also been constructed to expand the service. In 2017, there were 229 civil airports in China, including 49 airports of 4E or 4F, 35 airports of 4D, and 145 airports of 4C or 3C. The province-level municipalities and provincial capitals all had 4D or 4F airports. Six clusters had been formed in North China, Northeast China, East China, Central and South China, Southwest China and Northwest China.
With regard to ports, as development towards larger scale and deeper water intensified, the capacity of hub ports was rapidly expanded. In 2000, there were more than 30 10,000-ton berths in the ports of Shanghai, Tianjin, Dalian, Qingdao, Shenzhen and Guangzhou. In 2017, there were over 10,010,000-ton berths in Shanghai, Ningbo-Zhoushan, Tianjin, Suzhou and Dalian, and over 7,010,000-ton berths in Qingdao, Xiamen, Guangzhou and Shenzhen. Around the hubs, the construction of feeder ports spread widely. In 2017, there were more than 230,010,000-tons berths and 300 docklands along the coastline of China, covering every coastal prefecture-level city and more than 70% of the coastal counties. Seven clusters had been formed: along the Liaoning coast, the Tianjin-Hebei coast, the Shandong coast, the southeast coast and the southwest coast, as well as the port clusters of the Yangtze River Delta and the Pearl River Delta.

3.2 Regional differences

Regional differences between the sizes and per capita mileage of the transport networks have changed significantly (Figure 5). The sizes of highway networks in the three economic zones have increased. From 1980 to 2016, the proportions in the eastern and middle zones compared to the whole country decreased from 32.8% and 34.4% to 28.4% and 33.1%, respectively (Table 7), while the proportion in the western zone increased from 32.8% to 38.5%. In terms of inter-regional difference, the proportions in SCC, East China (EC) and SWC compared to the whole country increased from 17.4%, 13.6%, 13.3% to 19.1%, 16.6%, 18.9% respectively, while the proportion in NEC decreased from 18.0% to 10.4% and the proportions in NC and Northwest China (NWC) declined slightly. As for the per capita mileage, the three economic zones have all seen growth, with per capita highway mileage in the eastern zone, the middle zone and the western zone increasing from 0.5 m, 0.5 m and 0.6 m to 2.1 m, 3.2 m and 4.4 m respectively. The inter-regional differences in the per capita mileage have been enlarged. In 1980, the per capita highway mileage in NEC and NWC was 0.9 m and 1.0 m respectively, and was less than 0.6 m in other regions. In 2016, the per capita highway mileage in NWC and SWC was more than 4 m, while the per capita mileage in SCC, EC and NC was less than 3 m.
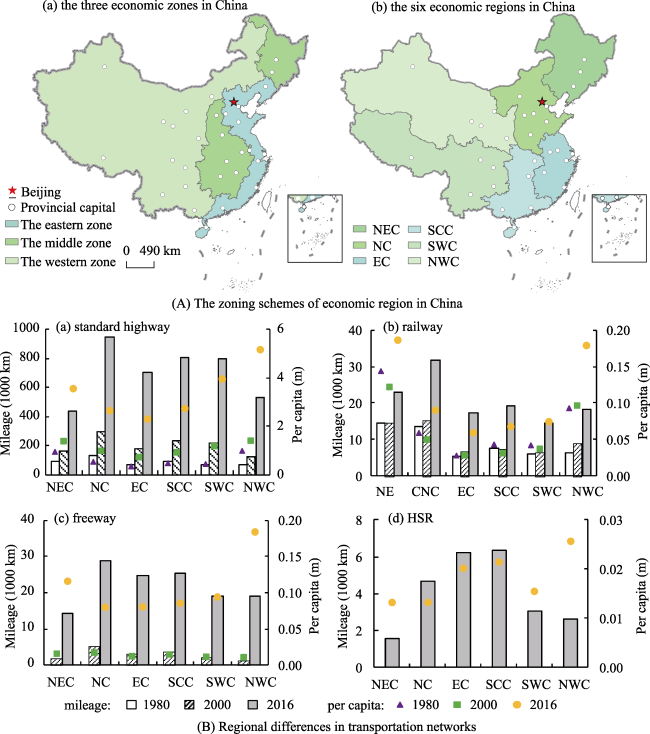
Figure 5 Evolution of regional differences in transportation networks in China Data sources: National Bureau of Statistics of China (http://data.stats.gov.cn/)
Table 7 Evolution of differences between the three economic zones in transportation networks
Indicators Standard highway Railway Freeway HSR
1980 2000 2016 1980 2000 2016 2000 2016 2016
Total (10,000 km) Eastern 17.09 41.25 120.09 1.39 1.49 3.45 0.91 4.15 0.99
Middle 17.94 34.87 139.90 2.07 2.17 3.93 0.36 4.19 0.70
Western 17.11 45.47 162.67 1.88 2.21 5.02 0.37 4.76 0.77
Per capita mileage (m) Eastern 4.58 8.47 20.95 0.37 0.31 0.60 0.19 0.72 0.17
Middle 5.32 8.37 32.35 0.61 0.52 0.91 0.09 0.97 0.16
Western 5.99 12.76 43.48 0.66 0.62 1.34 0.10 1.27 0.21

Data sources: National Bureau of Statistics of China (http://data.stats.gov.cn/)

Regional differences between the sizes of freeway networks have decreased. From 2000 to 2016, the proportion in the eastern zone compared to the whole country decreased from 55.6% to 31.7%, while the proportions in the middle and western zones increased from 21.9% and 22.5% to 32.0% and 36.3%, respectively. In terms of inter-regional differences, the proportions in NC and SCC compared to the whole country decreased from 31.2% and 22.2% to 21.9% and 19.4% respectively, while the proportion in NWC increased from 5.5% to 14.5%, with the proportions in NEC, EC and SWC increasing slightly. The differences in the per capita mileage among the three economic zones have evolved from a pattern of “eastern zone > western zone > central zone” to a pattern of “western zone > central zone > eastern zone”. As for the inter-regional differences, the per capita freeway mileages in NC, NEC and SCC were over 0.014 m, while in other regions they were less than 0.011 m in 2000. In 2016, the per capita freeway mileage in NWC was 0.187 m, representing a rapid growth. The per capita freeway mileage in NEC was 0.117 m; other regions were less than 0.1 m.
Differences between the sizes of railway networks in the three economic zones have increased. From 1980 to 2016, the proportion in the middle zone compared to the whole country decreased from 38.8% to 31.7%, while the proportions in the eastern and western zones increased from 26.0% and 35.2% to 27.8% and 40.5%, respectively. In terms of inter-regional differences, the proportions in EC and NWC compared to the whole country increased from 9.9% and 12.1% to 13.9% and 14.82%, while the proportion in NEC decreased from 27.2% to 18.6%. The proportions in SCC and SWC increased slightly and the proportion in NC declined slightly. Regional differences in per capita railway mileage have increased. Between the eastern zone and the middle zone the increase was from 0.024 m per capita to 0.031 m per capita, and between the eastern zone and the western zone the increase was from 0.029 m per capita to 0.074 m per capita. The inter-regional differences between NEC, NWC and other regions have gradually increased. In NEC, the per capita railway mileage has increased from 0.093 m to 0.18 m, three times as much as EC and SCC. The size of the HSR is still expanding rapidly, showing large regional differences. In 2016, the proportion in the eastern zone compared to the whole country was 40.3%, while both the central and western zones accounted for less than 32%. Inter-regional differences were mainly caused by the differences between EC, SCC and other regions. In 2016, these two regions accounted for 51.3% of the figure for the whole country. The regional differences in the per capita mileage of the HSR networks were mainly caused by differences between SCC, EC, NWC and other regions. The per capita mileages of those three regions were more than 0.020 m, while in the other regions they were less than 0.016 m.
The regional variations in airport and port systems are mainly reflected in clustering differences. In terms of the airport system, early construction was concentrated in the middle and the eastern zones. In 2000, the East China airport cluster accounted for 26.1% of airports nationwide. The proportion represented by the Central and South China airport cluster was 20.2%. Since 2000, aiming to expand the service, more new airports have been constructed in the western zone than the eastern and middle zones. From 2000 to 2016, the proportion represented by the North China, Northwest and Southwest airport clusters compared to the whole country increased from 10.9%, 15.1% and 16.8% to 15.7%, 18.4% and 20.3% respectively, while the proportion of the East China airport cluster decreased to 19.8%, and the proportion of the Central and South China airport cluster decreased to 15.7%. The proportion of the Northeast China airport cluster decreased slightly.
Looking at port systems, the early construction was mainly concentrated in the economically developed areas such as the Yangtze and Pearl River Deltas. In 2000, the 10,000-ton berths in the Yangtze and Pearl River Deltas accounted for 39.4% and 18.4% of the national total respectively. Since 2000, port construction has been rapid in the Yangtze River Delta, while construction along the Tianjin-Hebei, Shandong, southeast and southwest coasts has accelerated, and construction in the Pearl River Delta has decelerated. From 2000 to 2016, the 10,000-ton berths in the Yangtze River Delta accounted for about 38% of the national total. The proportions of the port clusters along the Tianjin-Hebei, Shandong, southeast and southwest coasts compared to the whole country increased from 11.4%, 10.6%, 5.2% and 4.8% to 12.7%, 12.4%, 7.3% and 6.4% respectively. The proportion of the Pearl River Delta port cluster decreased to 13.2%, and the proportion of the port clusters along the Liaoning coast decreased slightly.

3.3 Construction and evolution of the transportation corridor system

Highly modernized corridors with large capacities are the backbone of China’s integrated transportation network and a major support of the economy. Since the reform period, a modernized hierarchical corridor system has been built and it plays an important role in optimizing the regional distribution patterns of socioeconomic development.
The corridor system has been described as “Five Verticals North to South and Five Horizontals East to West” and has undergone continuous infrastructure improvement, in terms of types, capabilities and quality. In the early stages, the upgrading of highways and railways was carried out, greatly improving their technical condition. Since the 1990s, the construction of the “Five Verticals North to South and Seven Horizontals East to West” highways marked the time when the corridor system in China entered its freeway phase. Six railway enhancement projects which started in 1997 as well as the rapid construction of HSRs in recent years have greatly improved the operational efficiency of the arterial system. Some integrated transportation corridors, such as the Beijing-Shanghai and Yangtze River corridors, have been investigated in separation of passengers and freight, resulting in a significant improvement to both the capacity and service quality.
The transport corridor network gradually expanded from east to west. From the 1980s to the early 1990s, the north-south and east-west corridors in the eastern and middle zones were built, as well as the access corridors for Northeast China, Northwest China, Southeast China, the energy base in the western parts of Shanxi Province, Shaanxi Province and the Inner Mongolia Autonomous Region. Since the early 1990s, with the advent of the central government’s regional coordinated development strategy, transport construction was focused on inter-regional corridors. Following the aim of connecting the most important corridors in the eastern and middle zones, the main transportation network was gradually built in the western zone, resulting in an expansion of the system from the east to the west.
The transport corridors have gradually evolved from a checkerboard to a hub-and-spoke network. In the early period, coastal cities acted as gateway hubs and played an important role in the spatial organization of the transverse transport corridors, connecting the inland provincial capitals in series. The longitudinal corridors focused on meeting the intensive transport demands between the national and provincial capitals, as well as the demands between different provincial capitals. With transverse and longitudinal corridors, a checkerboard network was created, which effectively met the transportation needs of socioeconomic organization and the development of an export-oriented economy in China. In recent years, metropolitan areas have played a more and more prominent role in regional development. In order to adapt to the socioeconomic pattern of the metropolitan areas being the organizational subjects, the corridor network has been designed around the main regional cities, resulting in a hub-and-spoke network centred on them (Figure 6). At the same time, with the promotion of the Belt and Road Initiative, a new pattern of all round access has been created. As a result, one of the key functions of the corridor network has changed from supporting the eastward access to opening up all directions. Greater attention has been paid to the construction of the gateways along the land borders. The changes discussed above arose particularly from “13th Five-Year Plan for the Development of a Modern Integrated Transportation System”, in which the “Ten Verticals North to South and Ten Horizontals East to West” network was proposed.
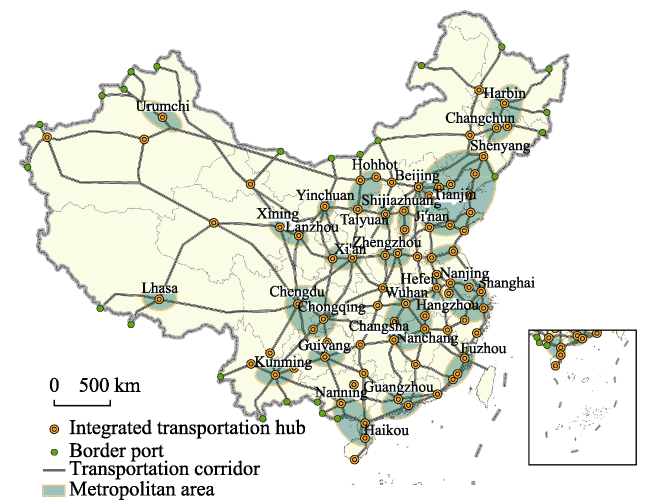
Figure 6 The distribution of transportation corridors and metropolitan areas in China

Data sources: The 13th Five-Year Plan for the Development of Modern Integrated Transportation System and National Main Functional Zone Planning published by the State Council, PRC

3.4 The regional transport system

The regional transport system in China has been under construction since the reform period, and has played an important role in the development of metropolitan areas, the improvement of carrying capacity and furthering of the country’s development.
The quality and capacity of the transportation infrastructure in China has been continuously improved, and a high-speed transport system has been created. As of 2018, the freeway networks in the metropolitan areas of China have all been built. Transport construction projects in some eastern and central metropolitan areas are now focused on the intercity railway networks. This is intended to meet the requirement for an efficient, high concentration, high density transportation system in metropolitan areas, and is becoming one of the dominant influences on their spatial reorganization.
The main cities have gradually developed into integrated transportation hubs, thus playing an important role centering on the spatial organization and helping to optimize the regional system. Before 2010, the planning and construction of hubs in China was based on a single transportation mode, but the central cities of major metropolitan areas have now gradually developed into integrated transportation hubs of two or more modes. Since the 12th Five-Year Plan, the focus of transport development has moved towards the formation of a coordinated network, resulting in more attention than ever being paid to the planning and construction of integrated transportation hubs. The central cities of major metropolitan areas have been planned as international or national transport hubs, the key projects being the Beijing-Tianjin, Shanghai, Guangzhou-Shenzhen, Chengdu-Chongqing international hubs, which are becoming an essential component for the integration of China into the global network.
The organization of the transportation network has formed two basic modes: the “ring + radiation pattern” and the “corridor pattern”. There are two main spatial forms of transportation demand in metropolitan areas; one is the radial demand with the central city as the origin or destination; the other is the demand along important regional development axes. In order to match the spatial distribution of transportation demand, the network layout in metropolitan areas adopts the “ring + radiation pattern” with central cities as hubs, and the “corridor pattern” along the important regional development axes. This applies especially to the layouts of the freeway and intercity railway networks. The two modes effectively meet the transportation demand between the central city and the surrounding areas, and ensuring the formation and development of core-periphery, point-axis and hub-and-spoke systems in metropolitan areas.

4 Spatial effects of the development of transportation

4.1 Spatial accessibility and convergence

The improvement of transport infrastructure and the modernization of vehicles have changed the spatial and temporal relationship of social activities, creating a spatial convergence which continuously affects changes in production and lifestyle, as well as the spatial evolution of socioeconomic structure.
The accessibility of cities is constantly improving. In 1985, the shortest average travel time between 337 cities in China was 26.4 h, which decreased 29.1% in 2003 to 18.7 h. In 2016, the shortest average travel time further decreased to 12.1 h, only 45.8% of that in 1985. In the future, with the rapid construction of HSRs, the accessibility of cities in China will be further improved. It is expected that the shortest average travel time between cities will be lowered to less than 8 hours in 2030. Continuous accessibility improvement strengthens the country’s overall integrity. It promotes socioeconomic linkages among cities and the continuous spatial evolution of city and industrial systems; it eventually becomes a significant component of a new national structure.
The scope of the spatial radiation and attraction associated with the central cities has kept expanding (Figure 7). Looking at residents’ travel and industrial activities, the 1h transport circle around a central city can be regarded as the typical travel range for residents’ daily activities. The area inside a 3h transport circle can be reached with a one-day round trip, which is suitable for the development of business and logistical activities. This can, therefore, be regarded as the best size for organising regional division of labour around a central city. In 1985, the proportion of areas covered by a 1h transportation circle around the provincial capitals was 0.9%, which increased to 1.3% in 2003 and 7.8% in 2016, 8.9 times that of 1985. The expansion of the residents’ daily activity space has thus changed the spatial relationship between home and work place, altering the traditional concept of neighborhood, and becoming an important driver for the evolution of urban spatial organization. Correspondingly, in 2016, the proportion covered by a 3h transportation circle around provincial capitals reached 37.6%, which was 5.1 times as much as in 1985. For the eastern and central provinces of Liaoning, Shandong, Jiangsu, Zhejiang, Anhui, Guangdong and Henan, the proportions exceeded 90%. These changes have helped to optimize the allocation of resources at a larger scale and to promote the continuous development of a regional labor system; they can thus be seen as an important force driving regional change.
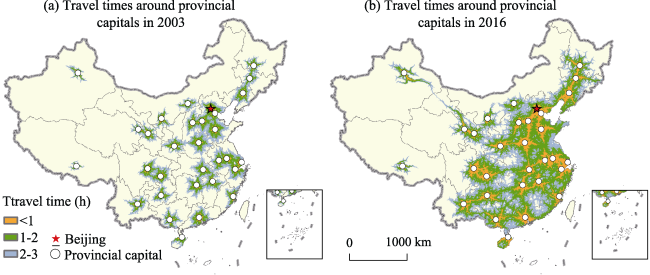
Figure 7 Evolution of travel times around provincial capitals in China

Data sources: The data of transportation network in 2016 was collected from the Baidu Map Open Platform (http://lbsyun.baidu.com/). The data in 2003 was collected from the maps published by the Thematic Database for Human-earth System of Chinese Academy of Sciences (http://www.data.ac.cn/xiazai/xiazainew.asp), and the National Geomatics Center of China (http://www.ngcc.cn/). The calculation was based on the ARCGIS platform. For the specific method, please refer to Jin et al. (2017)

4.2 Evolution of the transport dominance pattern

Transport infrastructure can improve living and production space through the effect of spatial convergence and high-quality services, optimizing organization and directly affecting the opportunities for regional development. Since the reform period, transport in various regions in China has been greatly improved (Figure 8). From 1985 to 2016, the counties (districts) with fair, good and excellent transport dominance increased from 612, 229 and 65 to 1,197, 507 and 503 respectively. The proportions of the country covered by counties (districts) with fair, good and excellent transport dominance increased from 7.9%, 1.5% and 0.3% to 28.7%, 6.9%, and 4.0%; these also showed population and GDP increases of 90% and 95% respectively.
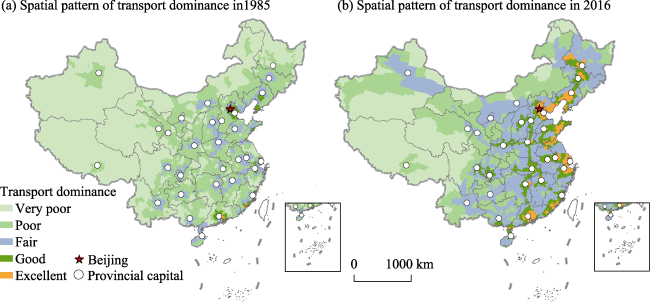
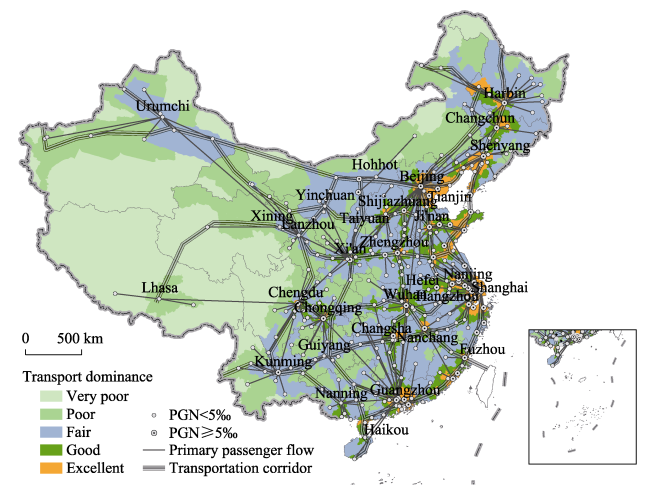
Figure 8 Evolution of the pattern of transportation dominance in China

Data sources: The data of the spatial pattern of transportation dominance in 1985 was quoted from “Infrastructure and Economic-social Spatial Organization (Beijing: Science Press, 2012) authored by Jin Fengjun. The data in 2016 was calculated by authors. The raw data was mainly collected from Baidu Map (https://map.baidu.com/), Thematic Database for Human-earth System of Chinese Academy of Sciences (http://www.data.ac.cn/ xiazai/xiazainew.asp), and the National Geomatics Center of China (http://www.ngcc.cn/). The calculation was based on the ARCGIS platform. For the specific method, please refer to Jin et al. (2008).

The expansion of areas with higher dominance has primarily been around metropolitan areas or along major infrastructure corridors. In 1985, the counties (districts) with good and excellent transportation dominance (point-shaped on Figure 8) were distributed in the areas surrounding cities along the eastern coast, and the counties (districts) with fair dominance (shaped as blocks on Figure 8) were mainly distributed around the provincial capitals. In 2016, counties (districts) with excellent transport dominance formed areas around cities in the eastern and central zones, especially in the coastal areas of Beijing-Tianjin-Hebei, Yangtze River Delta, Pearl River Delta, Central and Southern Liaoning, Shandong Peninsula and the west coast of Taiwan Straits. Except for those areas rated as excellent, counties (districts) with good transport dominance typically formed belts along the main development axes in the eastern and central zones, especially along the Beijing-Shanghai, Beijing-Guangzhou and Yangtze River infrastructure corridors. Counties (districts) rated as fair (polygons on Figure 8) are distributed in the eastern and central zones, covering the areas east of Beijing-Guangzhou infrastructure corridor. In the west, counties (districts) rated fair mainly form belts along the important development axes.

4.3 Coupling of transportation and socioeconomic spatial patterns

A linkage has been created between the spatial convergence coming from rapid expansion of the transportation network and socioeconomic organization, strongly influencing the development of socioeconomic patterns.
Large and medium-sized cities with efficient transport have gradually developed into hubs of different types and classes, resulting both in their expansion and functional enhancement. In 2016, the population and GDP of these 81 hub cities accounted for 37.5% and 54.4% of the national totals respectively, and made the hub cities into strategic support points in China’s socioeconomic organization. Meanwhile, cities with arterial seaports and airports have become gateways for China to participate in the international labor market, the development of an export-oriented economy and the all round opening up of the country. In 2016, the total foreign trade volume of the 25 arterial seaport cities and the 23 arterial airport cities accounted for 52.3% and 50.3% of the national total respectively, and also accounted for 85.2% and 97.8% respectively, of the foreign direct investment.
On the regional scale, rapid transportation networks have gradually been built around the central cities with both the capacity and quality continuously improved, thus playing an important role in providing direction for the development of the metropolitan areas. In 2016, the GDP of the three major metropolitan areas of Beijing-Tianjin-Hebei, Yangtze River Delta and Pearl River Delta totalled CNY 29 trillion, making up 39% of the national total. GDP per unit area and GDP per capita were 6.1 times and 1.5 times the national average respectively, making them world-class metropolitan areas. Other metropolitan areas, including Chengdu-Chongqing, Zhengzhou, Shandong Peninsula and the west coast of Taiwan Strait, grew strongly and became main centres of human and economic activity, as well as important platforms for participation in the international labor market and competition.
On the national scale, the transportation corridors composed of arterial lines connecting different types and classes of hubs in series, formed a zone of significant transport dominance, which gave direction to the development of different regional axes. Before 1985, the progress of human and industrial activity in China was closely related to the state of railway and waterway transportation. 47.2% of the population and 52.1% of the gross industrial product were concentrated in coastal and riverside areas, as well as areas along the Beijing-Shanghai, Beijing-Guangzhou and Longhai-Lanxin railways (Figures 9 and 10). With the rapid construction, industrialization and urbanization phase, large-capacity and modernized corridors had been built in those areas, and they have strongly supported socioeconomic development. Population and industry were also tending to gather in those areas, forming the main development axes that support regional development. In 2016, the shares of China’s population and gross industrial product concentrated along the north-south coastal transport corridor, the Yangtze River and Beijing-Shanghai corridors, the Manzhouli corridor to Hong Kong, Macao and Taiwan, and the land-bridge corridor were 62.3% and 85.2% respectively, up by 15.2% and 33.1% as compared with 1985.
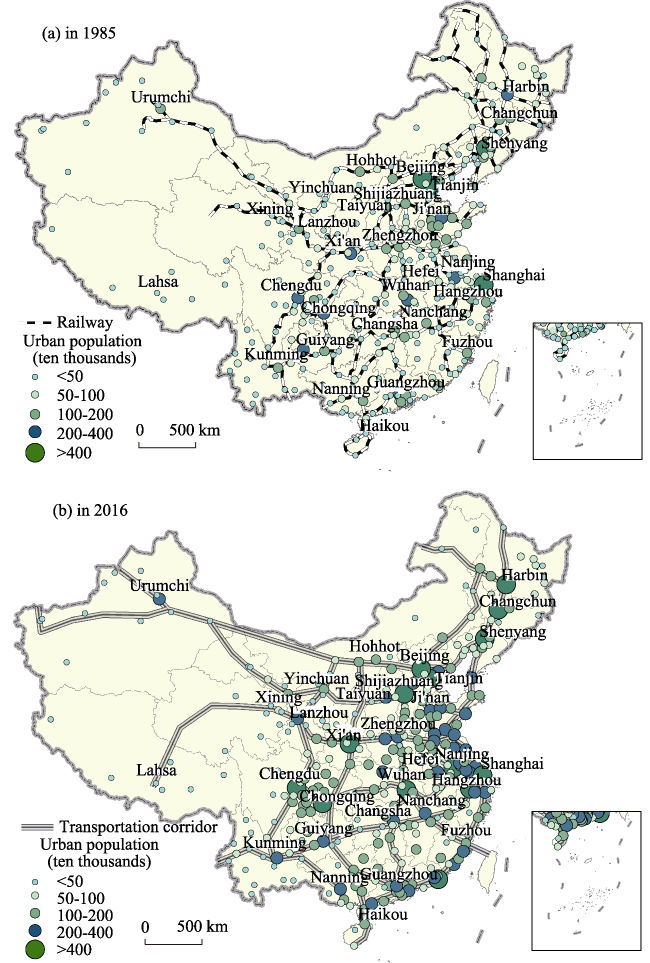
Figure 9 Transportation construction and the evolution of the urban development pattern in China

Data sources: 1985 China Urban Statistical Yearbook and 2016 China Urban Statistical Yearbook

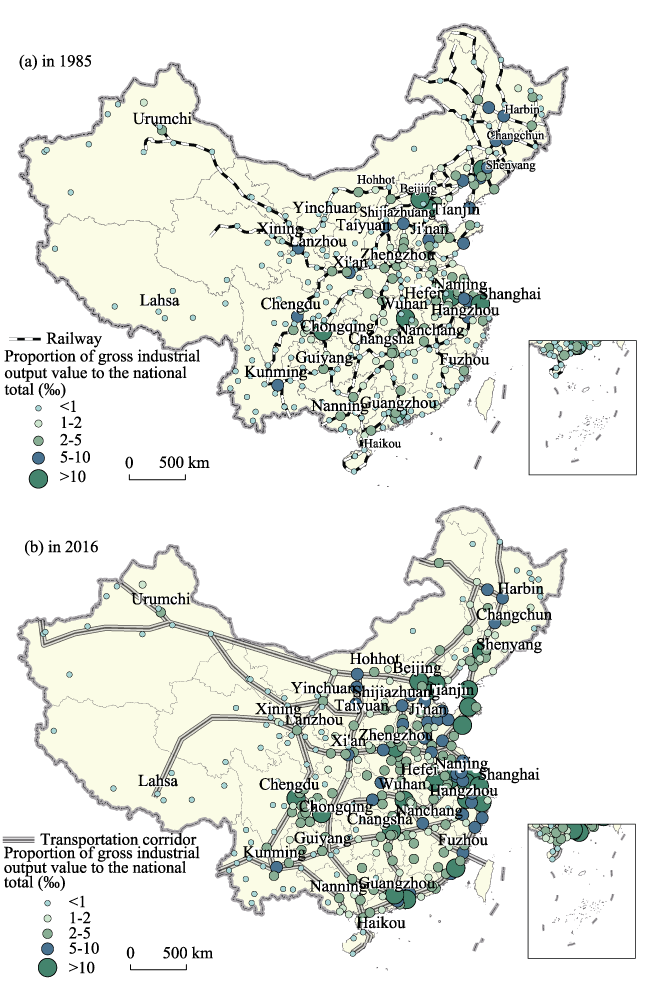
Figure 10 Transportation construction and the evolution of economic development pattern in China

Data sources: 1985 China Urban Statistical Yearbook and 2016 China Urban Statistical Yearbook

4.4 The support for the spatial pattern of regional development

Due to its shaping of the pattern of socioeconomic growth, the infrastructure network has gradually formed a mature support system for regional development. Firstly, the network supports the growth of regional development axes at different spatial scales. In addition to the macro-development axes, different classes of axes have been formed on the provincial and municipal scales, which play an important role in shaping the patterns of regional development. Secondly, the network supports the growth of metropolitan areas, and promotes the formation of hub-and-spoke network regions centered on major cities for the integration and distribution of resources as well as the coordination of industries and functions. Thirdly, the transportation infrastructure network supports the formation of a balanced spatial pattern of regional development. The development of metropolitan areas in the central and western zones and the transportation corridor system have supported the gradient diffusion of economic development in China from east to west and the interaction between Northern and Southern China. Fourthly, an international transportation corridor system mainly composed of railways, maritime and air routes with land ports, large seaports and hub airports as the gateways has been built, and this has supported the widespread opening up and participation of China in the international labor market. Moreover, an energy development and transportation system composed of oil and gas pipelines, arterial railways and coastal ports has been constructed; this has promoted efficient operation of domestic energy centres and the international energy security system.
In the future, as metropolitan areas become the main form of socioeconomic development in China, the traditional regional development structure centered on the main axes will gradually be transformed into a networked structure centered on cities and metropolitan areas. A high-speed, convenient and efficient regional transport system centered on the cities, and a modernized, networked, hierarchical, integrated corridor network, constructed to meet the transportation demands between different metropolitan areas and promote their integration into the global production and collaboration networks, have become the focus of the current phase of development. In response to this trend in recent years, HSRs and inter-city railways in some metropolitan areas have entered a period of rapid construction. The integrated corridor system has been designed as a “hub-and-spoke” network centering on metropolitan areas and reaching the major border ports, which will further enhance the capacity of the system to support the networked structure of regional development, creating a favorable infrastructure environment for refined development and regulation.

5 Principles of the evolution of transportation geography

5.1 Stages of spatial evolution

The large-scale structure of the pattern of transportation geography generally experienced six stages: scattered structure, simple structure, local structure, whole-region structure, hierarchical structure and cascade-link structure (Figure 11). After nearly 100 years of investment and construction before the reform period, a transport network covering most of China had been built up to the point where it was moving from local to whole-region structure. In the early period of reform and opening up, the scale was expanding and the integrated transport network gradually covered the whole country. The development axes on a national scale, such as the coastal development axis, the Yangtze River development axis and the Beijing-Guangzhou development axis kept growing, resulting in a complex, integrated and coordinated system. From the mid-to-late 1980s until the beginning of the 21st century, the focus of construction changed from expansion alone, to both expansion and quality improvement. As a result, the transport network gradually reached a condition of basic adaptation to socioeconomic demands. The continued improvements to regional development, integrity, coordination and relevance of the spatial system, meant that the network pattern had entered the stage of a hierarchical structure. Since the early 21st century, the development of transportation has turned more to quality improvement and service optimization, forming a spatial network characterized by differences in hierarchies and service quality, which continued to play an important role in socioeconomic development. These characteristics indicate the beginning of the transition to the stage of cascade-link structure.
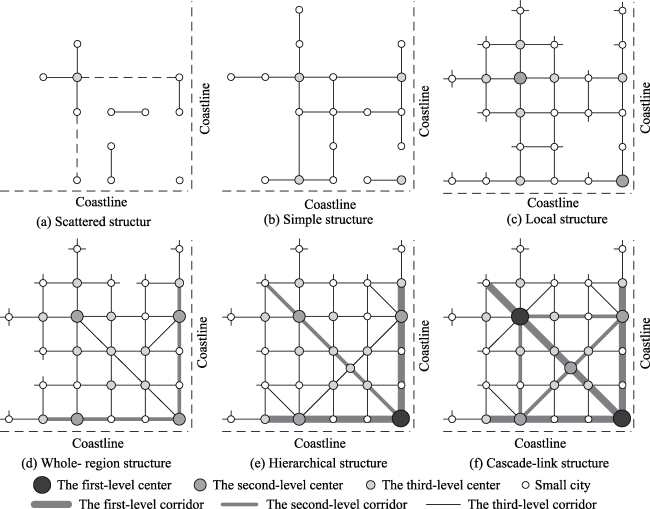
Figure 11 Evolution stages of the spatial pattern of transportation geography

5.2 Evolution from the axis structure to the hub-and-spoke structure

Supported by the transport network, the socioeconomic pattern has evolved from an axis to a hub-and-spoke structure. Before the 21st century, socioeconomic development in China was characterized by a point-axis structure, resulting in a spatial pattern shaped by the belt areas along the important corridors. The development axes, such as the coastal, Yangtze River, Beijing-Guangzhou and Beijing-Shanghai development axes, are all supported by large-capacity, high-quality transport corridors. With large to medium-sized cities and transportation hubs along the corridors acting as core platforms, the development axes attracted population and industry, gradually becoming economic development belts of national significance. This resulted in China’s spatial development taking on the form of an axis structure.
Continuous improvement and upgrading of the transportation network led to the overall pattern being transformed from point- and line-shaped to polygonal. Thanks to a high-efficiency regional transport network with a backbone of infrastructure and central cities as hubs, the main metropolitan areas in China gradually evolved into more efficient block-shaped areas. This change involved the transition from an axis structure to a hub-and-spoke structure (Figure 12). Hub-and-spoke networked regions are gradually formed, centered on the main cities with surrounding cities as nodes, and characterized by dense radial socioeconomic linkages. These control the integration and distribution of resources, as well as the evolution of a regional labor system. On a national scale, the rapid development of metropolitan areas has promoted the transition of regional development to a multi-polarized and networked structure. Some of the well-developed metropolitan areas, such as the Beijing-Tianjin-Hebei region, the Yangtze River Delta and the Pearl River Delta, have become hubs of the regional development network. Through industrial transfer and technical cooperation, collaboration and organization of labor have been achieved, so as to continuously promote synergistic development between different metropolitan areas.
Figure 12 The hub-and-spoke structure of economic and social development in China

5.3 Spatial efficiency and cascade structure

Transportation networks can effectively guide both the agglomeration and the diffusion of socioeconomic resources, promoting the formation and interaction of various functional areas, finally forming a hierarchical and orderly network through spatial convergence and increased dominance (Jin, 2013). On the one hand, transportation networks can guide the construction and growth of various types of functional areas, such as industrial parks, cities, metropolitan areas, economic development belts, etc. They also play an important role in functional enhancement and improvement of efficiency in these areas. On the other hand, transportation networks can improve the environment for the development of various functional zones, such as metropolitan areas. They promote interactions and linkages, resulting in a network system with spatial hierarchy and coordinated socioeconomic division of labor.
The continuous development of the transportation network means that the cascade structure of various functional areas in China will gradually become mature and stable, finally reaching a relatively balanced state. Firstly, the pattern of transport dominance centered on cities and metropolitan areas will guide the socioeconomic development pattern as those metropolitan areas gradually stabilize. The construction of the “Ten Verticals North to South and Ten Horizontals East to West” corridor system will promote the transition from a regional development structure centered on the development axis, into a networked structure centered on cities and metropolitan areas. In particular, the metropolitan areas in the central and western zones will be further developed, and the role of the metropolitan areas in the eastern zone will be more and more important in leading national economic development and participating in the international labor market. Secondly, functional regional entities, such as economic development belts and metropolitan areas, are constrained by the capacity of transport networks and their agglomeration or diffusion dynamics, resulting in the gradual stabilization of spatial boundaries and patterns. Thirdly, the interdependence and stability of various elements within these entities will continue to increase. In the context of the rapid construction of railways, hub-and-spoke networks of socioeconomic linkages centered on the main cities as well as economic division and cooperation networks between metropolitan areas will all be strengthened.

6 Academic issues worth studying

(1) Optimized configuration of transport resources. As transportation construction in China enters the quality improvement stage, the optimization of existing resources has become an important trend of development, which not only includes the optimization and integration of resources within a single transportation sector, such as the reorganization of airlines and shipping companies, but also involves the integrated coordination of resources among different transportation sectors. At the same time, the influence of technology on the configuration of transport resources has become increasingly prominent. A series of new transportation formats have appeared, including shared bicycles, shared cars, web taxis and so on. The release and widespread use of new travel and navigation procedures make travel mode selection and path planning more rational. This is the application frontier and a research hotspot for transportation geography to scientifically study the effect of best configuration of transportation resources, grasp the potential influence on the evolution of national and regional transportation patterns, and put forward suggestions on the optimal configuration of transportation resources from the perspective of geography.
(2) Spatial, temporal and organizational patterns of transport activities. Previous studies have mainly focused on mechanisms for the generation and evolution of passenger and freight flow, as well as their economic and geographical basis. These tend to ignore individual travel behaviors and transportation activities of enterprises. In recent years, the development of data collection and analysis technology has provided good measurements for spatial analysis of transportation activities based on both individuals and enterprises. By refining the research granularity and deepening the study of the spatial, temporal and organizational patterns of transport activities, the deep-seated mechanism of spatial interaction and universally significant scientific parameters could be further explored. This subject should occupy the attention of future transportation geographers and would provide scientific support for socioeconomic organization.
(3) Principles of transportation and regional development. The relationship between transportation and regional development has always been a core concern of transportation geography. Previous studies have focused on the role of transportation in regional development and the relationship between transportation and socioeconomic structure. To develop these research fields, the focus should be aimed at the principles of transportation and regional development, in order to clarify the logical relationships in time and space, as well as the balance mechanism of transportation and regional development. On this basis, the design and development of prediction models and modeling techniques should be improved, in order to provide scientific support for transportation construction and regional development in China.
(4) The scientific mechanisms of transportation organization in cities and metropolitan areas. As the main platform for population and industrial agglomeration, cities and metropolitan areas play an important role as growth centres and strategic support points of the socioeconomic pattern in China, and transport construction in these areas directly affects the efficiency of regional development. Systematic studies on the spatial mechanisms of transportation organization and the identification, evaluation and simulation of the geographical effects of construction in cities and metropolitan areas, are of great significance for exploring the collaborative organizational mode of transportation and land use, industry and ecological spaces. Such studies would also be helpful for strengthening the driving force of regional development and improving the carrying capacity and ecological resilience of the country.
(5) Geographical effects of transportation management reform. In terms of the development of the last 40 years, transportation management reforms, especially the separation of government functions from enterprise management, the reform of the investment and financing system and the restructuring of central government offices have directly affected the process of transportation planning and construction in China, also playing an important role in shaping the pattern of transportation geography. In the future, institutional reform will remain one of the main themes of development in China. Against this background, we need a comprehensive and scientific assessment of the impact and mechanism of management reform. Identifying, evaluating and modeling the geographical effects would be of great value for understanding the evolution of transportation geography in China.
[1]
Chen H, Zhang W C, Jin F J , 2000. Transportation Geography in China. Beijing: Science Press. (in Chinese)

[2]
Chen Y, Jin F J, Lu Y Q , et al., 2017. Development history and accessibility evolution of land transportation network in Beijing-Tianjin-Hebei region. Acta Geographica Sinica, 72(12):2252-2264. (in Chinese)

[3]
Chen Z, Jin F J, Yang Y , et al., 2018. Distance-decay pattern and spatial differentiation of expressway flow: An empirical study using data of expressway toll station in Fujian Province. Progress in Geography, 37(8):1086-1095. (in Chinese)

[4]
Cui X G, Fang C L, Zhang Q , 2018. Spatial relationship between high-speed transport superiority degree and land-use efficiency in Shandong Peninsula urban agglomeration. Acta Geographica Sinica, 73(6):1149-1161. (in Chinese)

[5]
Han Z L, Yang Y K, Zhang W C , et al., 2000. The basic theory and life-circle pattern of traffic economic belt’s development and evolvement. Scientia Geographica Sinica, 20(4):195-300. (in Chinese)

[6]
Jian L X, Li D B, Zhao S C , 2016. China’s coastal port complex network evolution. Economic Geography, 36(12):96-103. (in Chinese)

[7]
Jiang H B, Xu J G, Qi Y , 2010. The influence of Beijing-Shanghai High-speed Railways on land accessibility of regional center cities. Acta Geographica Sinica, 65(10):1287-1298. (in Chinese)

[8]
Jiao J J, Wang J E, Jin F J , et al., 2016. Impact of high-speed rail on inter-city network based on the passenger train network in China. Acta Geographica Sinica, 71(2):265-280. (in Chinese)

[9]
Jiao J J, Wang J E, Jin F J , 2017. Impacts of high-speed rail lines on the city network in China. Journal of Transport Geography, 60(4):257-266. (in Chinese)

[10]
Jin F J , 2012. Infrastructure and Spatial Organization. Beijing: Science Press. (in Chinese)

[11]
Jin F J , 2013. Organization Mechanism of Efficacy Space and Spatial Welfare: Spatial Organization and Efficiency. Beijing: Science Press. (in Chinese)

[12]
Jin F J, Jiao J J, Qi Y J , et al., 2017. Evolution and geographic effects of high-speed rail in East Asia: An accessibility approach. Journal of Geographical Sciences, 27(5):515-532. (in Chinese)

[13]
Jin F J, Wang C J, Li X W , 2008. Discrimination method and its application analysis of regional transport superiority. Acta Geographica Sinica, 63(8):787-798. (in Chinese)

[14]
Ke W Q, Lu Y Q Chen W , et al., 2016. Evolutionary stages and theoretical model of high-speed traffic network spatio-temporal structure: A case study of expressway traffic flow network in Jiangsu province. Acta Geographica Sinica, 71(2):281-292. (in Chinese)

[15]
Li P X, Sun W , 2013. Pattern and driving mechanisms of urban expansion of southern Jiangsu province since reform and opening up. Resources and Environment in the Yangtze Basin, 22(12):1529-1536. (in Chinese)

[16]
Mo H H, Wang J E , 2012. Complex Transport Network: Structure, Process & Mechanism. Beijing: Economy & Management Publishing House. (in Chinese)

[17]
Shen Z Y, Deng X J , 2003. Transportation Engineering. Beijing: China Communications Press. (in Chinese)

[18]
Smith D A, Timberlake M F , 2001. World city networks and hierarchies, 1977-1997: An empirical analysis of global air travel links. American Behavioral Scientist, 44(10):1656-1678.

[19]
Wang C J, Ding J X, Yang W , 2011. Policy and spatial effect of expressway planning network in China. Acta Geographica Sinica, 66(8):1076-1088. (in Chinese)

[20]
Wang F H, Liu Y, Wang J E , 2014. Transport networks, intraurban structure and system of cities: A Sino-US comparative perspective. Progress in Geography, 33(10):1289-1299. (in Chinese)

[21]
Wang H J, Miao C H , 2014. China’s central cities railway Passenger transport connects and its distribution base on O-D network. Economic Geography, 34(5):83-90. (in Chinese)

[22]
Wang L, Cao Y H, Qiu F D , 2017. Spatial change and driving mechanism of the industry in regions of HSR stations before and after the opening: A case study of Nanjing HSR station. Scientia Geographica Sinica, 37(1):19-27. (in Chinese)

[23]
Zhang W C, Jin F J, Fan J , 2002. Traffic Economic Belt. Beijing: Science Press. (in Chinese)

[24]
Zhang W C, Jin F J Rong C H , et al., 1992. Spatial Transportation Linkages: Theoretical Research, Empirical Analysis and Prediction Method. Beijing: China Railway Publishing House. (in Chinese)

Outlines

/