Research Articles

Investigating the spatially heterogeneous relationships between climate factors and NDVI in China during 1982 to 2013

  • GAO Jiangbo 1 ,
  • JIAO Kewei 1, 2 ,
  • WU Shaohong 1, 3
Expand
  • 1. Key Laboratory of Land Surface Pattern and Simulation, Institute of Geographic Sciences and Natural Resources Research, CAS, Beijing 100101, China
  • 2. Key Laboratory of Forest Ecology and Management, Institute of Applied Ecology, CAS, Shenyang 110016, China
  • 3. University of Chinese Academy of Sciences, Beijing 100049, China

Gao Jiangbo, PhD, specialized in climate change risk and adaptation. E-mail: gaojiangbo@igsnrr.ac.cn

Received date: 2019-01-10

  Accepted date: 2019-03-20

  Online published: 2019-12-09

Supported by

National Key R&D Program of China(No.2018YFC1508900)

National Key R&D Program of China(No.2018YFC1509003)

National Key R&D Program of China(No.2018YFC1508801)

National Natural Science Foundation of China(No.41671098)

Strategic Priority Research Program of the Chinese Academy of Sciences(No.XDA19040304)

Strategic Priority Research Program of the Chinese Academy of Sciences(No.XDA20020202)

Copyright

Copyright reserved © 2019. Office of Journal of Geographical Sciences All articles published represent the opinions of the authors, and do not reflect the official policy of the Chinese Medical Association or the Editorial Board, unless this is clearly specified.

Abstract

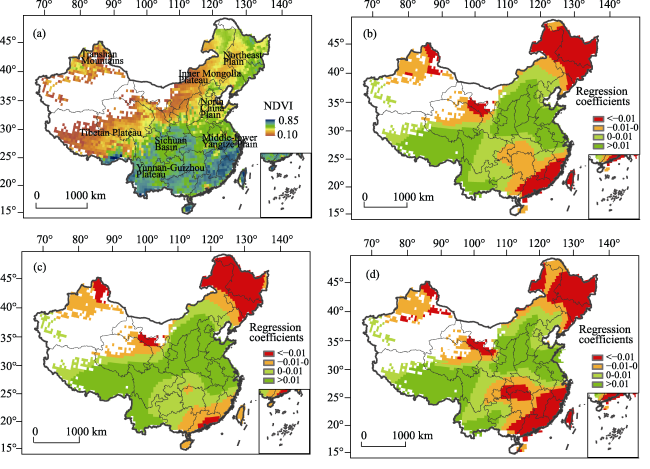
Climate change is a major driver of vegetation activity, and thus their complex processes become a frontier and difficulty in global change research. To understand this relationship between climate change and vegetation activity, the spatial distribution and dynamic characteristics of the response of NDVI to climate change were investigated by the geographically weighted regression (GWR) model during 1982 to 2013 in China. This model was run based on the combined datasets of satellite vegetation index (NDVI) and climate observation (temperature and moisture) from meteorological stations nationwide. The results showed that the spatial non-stationary relationship between NDVI and surface temperature has appeared in China: the significant negative temperature-vegetation relationship was located in Northeast, Northwest and Southeast China, while the positive correlation was more concentrated from southwest to northeast. By comparing the normalized regression coefficients from GWR model for different climate factors, it presented the regions with moisture dominants for NDVI were in North China and the Tibetan Plateau, and the areas of temperature dominants were distributed in East, Central and Southwest China, where the annual mean maximum temperature accounted for the largest areas. In addition, regression coefficients from GWR model between NDVI dynamics and climate variability indicated that the higher warming rate could result in the weakened vegetation activity through some mechanisms such as enhanced drought, while the moisture variability could mediate the hydrothermal conditions for the variation of vegetation activity. When the increasing rate of photosynthesis exceeded that of respiration, the positive correlation between vegetation dynamics and climate variability was reflected. However, the continuous and dynamic process of vegetation activity response to climate change will be determined by spatially heterogeneous conditions in climate change and vegetation cover. Furthermore, the dynamic description of climate-induced vegetation activity from its rise to decline in different regions is expected to provide a scientific basis for initiating ecosystem-based adaptation strategies in response to global climate change.

Cite this article

GAO Jiangbo , JIAO Kewei , WU Shaohong . Investigating the spatially heterogeneous relationships between climate factors and NDVI in China during 1982 to 2013[J]. Journal of Geographical Sciences, 2019 , 29(10) : 1597 -1609 . DOI: 10.1007/s11442-019-1682-2

1 Introduction

Vegetation is a sensitive indicator for global environmental change and plays an important role in the energy transfer between land and atmosphere and in the maintenance and optimization of ecosystem services (Wang et al., 2012; Fu et al., 2017). The normalized difference vegetation index (NDVI) is an important indicator for large-scale vegetation coverage and productivity. The magnitude of the NDVI indicates the intensity of vegetation activity (Fang et al., 2010; Gao et al., 2017), and this intensity further reflects the structure and functional features of the ecosystem. The NDVI is widely used in the research fields of geography, ecology, and global change (Fang et al., 2004; Andrew et al., 2017). As an external environmental factor necessary for vegetation growth and development, climate factors (e.g., temperature and moisture) play an important role in the changes of vegetation activity (Zhao and Running, 2010; Jiang et al., 2017). Changes in climate conditions may also have adverse effects on vegetation activity while promoting vegetation growth and physiological and biochemical effects on vegetation (Ding et al., 2013). Therefore, revealing the spatial nonstationary relationship and the response pattern between vegetation activity and climate change can provide a theoretical basis for coping with climate change and improving ecosystem adaptability and has become an important part of current global change research (Levine, 2015).
On global and regional scales, the relationship between climate change and vegetation activity has received extensive attention (Krishnaswamy et al., 2014; Zhou et al., 2015). On global scales, the potential net primary productivity (NPP) increased by 13% under the influence of climate change in the last century (Del Grosso et al., 2008). On regional scales, the response process of vegetation activity depends on the spatial heterogeneity of climate conditions and background environment (Zeppel et al., 2014; Seddon et al., 2016). For example, the NPP in arid areas increases under the influence of concentrated precipitation (Baez et al., 2013), while the NPP in humid and semi-humid areas is inhibited under conditions of increased precipitation (Du et al., 2011; Hoover et al., 2014). In most of the cold and wet northern regions, maximum temperature is positively correlated with the NDVI, while it shows negative relationship in temperate arid regions. The NDVI has a more complex response to minimum temperature (Peng et al., 2013). In addition, the selection of time scales in studies on the response of vegetation to climate change is equally important. An increase in temperature in winter and spring promotes photosynthesis and prolongs the growth period of vegetation, which is conducive to vegetation growth and nutrient accumulation. However, an increase in temperature in autumn has a negative effect on the NDVI (Piao et al., 2014). Therefore, the superimposed effects of climate on multi-scaled vegetation activity lead to uncertainty and complexity of the climate-vegetation relationship.
At present, studies on the spatial nonstationary relationship and the response pattern of vegetation activity to climate change mainly focus on trend analysis and process identification. However, the spatio-temporal variability of climate factors and vegetation activity on macroscale using spatial statistical analysis methods should still be promoted to reveal the dominant regional climate factors and the dynamic response mechanism of vegetation activity (Reyer et al., 2013; Wu et al., 2015; Han et al., 2016). To this end, we applied the geographically weighted regression (GWR) method in this study for the spatial nonstationary relationship between the NDVI and different climate factors and the variability of these factors in China in the past 30 years (1982-2013). Our aim was to identify the controlling effects of climate factors on vegetation activity and to analyze the spatial pattern of dynamic response of vegetation activity to climate change to deepen and expand the research field of vegetation-climate relationships.

2 Data and methods

2.1 Climate indicators

The climate indicators selected in this study included temperature indicators (average temperature, maximum temperature, and minimum temperature) and moisture indicators (precipitation and relative humidity). The climate data were the monthly surface climate datasets provided by the China Meteorological Science Data Service Sharing Network. After excluding the sites with missing data, 652 meteorological stations nationwide were selected with a time span of 1982-2013. The monthly temperature and relative humidity data were averaged. The annual mean maximum and minimum temperatures were the annually averaged monthly highest and lowest temperatures, which represented the temperature conditions during the daytime and nighttime, respectively. Precipitation data were summed to obtain the annual climatological data. The climatological station data were then interpolated into 50-km gridded data using Auspline software for the following analysis. Finally, the meteorological stations that were not used in the interpolation were selected with a random time period, whose climatological data were compared with the data in the corresponding interpolation grids. The results show that the correlation coefficient between the interpolated and measured temperature indicator data was larger than 0.99 and the correlation coefficients between the interpolated and measured precipitation and relative humidity reached 0.92 and 0.86, respectively, indicating good interpolation accuracy that generally met the requirements of this study. Additionally, a spatial resolution of 50 km was chosen in this study for two reasons. First, this resolution ensured that the research data could pass the collinearity test in the spatial analysis. Second, a 50-km resolution was consistent and comparable with that in existing studies (especially for the gridded precipitation dataset) (Zhao et al., 2014).

2.2 Normalized Difference Vegetation Index (NDVI)

NDVI data are commonly used to characterize vegetation activity such as vegetation growth, coverage, and dynamic changes (Wright et al., 2012). In this study, the Global Inventory Monitoring and Modeling Studies (GIMMS) NDVI dataset from 1982 to 2013 was selected as an indicator for vegetation activity. The GIMMS NDVI dataset was provided by the U.S. National Aeronautics and Space Administration (NASA) with a spatial resolution of 8 km and a temporal resolution of 15 days. It is characterized by its high accuracy and long time series and widely used in studies of vegetation change on global and regional scales (Mao et al., 2012; Kong et al., 2017). The monthly NDVI values were obtained by using the maximum value composite (MVC) method. The annual mean NDVI was used to reflect the evolution characteristics of vegetation coverage driven by climate change, and the spatial relationships between the annual mean NDVI and climate change were further analyzed (Piao et al., 2014; Duo et al., 2016). To make the spatial resolution of NDVI consistent with that of the climate indicators, the NDVI data were resampled using ArcGIS 10.3 to convert it with 8-km spatial resolution to 50-km grid data.

2.3 Trend analysis

In this study, an ordinary least squares (OLS) method based on grid size was used to analyze the climate and vegetation trend on interannual time scales. This was achieved using the raster calculator of ArcGIS 10.3. The calculation equation for trend analysis is:
${{\theta }_{slope}}=\frac{n\times \sum\limits_{i=1}^{n}{i}\times {{Y}_{i}}-\sum\limits_{i=1}^{n}{i}\sum\limits_{i=1}^{n}{{{Y}_{i}}}}{n\times \sum\limits_{i=1}^{n}{{{i}^{2}}}-{{(\sum\limits_{i=1}^{n}{i})}^{2}}}$
where${{\theta }_{slope}}$is the slope of the linear regression, indicating the changing trend and rate of the studied objects; n represents the total number of the studied years, and it is 32 in this study; and Yi is the value of climate or vegetation indicators in the ith year.

2.4 Geographically Weighted Regression (GWR)

The GWR model is a simple but practical regional spatial analysis method proposed by Brunsdon et al. (1996) and is useful for revealing internal spatial relationship in the studied area. The GWR model is an extension of general linear regression methods (e.g., OLS). Parameters of this method are functions of spatial position and evaluate the relationship between independent and dependent variables on spatial scales. The model can be expressed as:
${{y}_{i}}={{\beta }_{0}}({{\mu }_{i}},{{\nu }_{i}})+\sum\limits_{k=1}^{p}{{{\beta }_{k}}({{\mu }_{i}},{{\nu }_{i}}){{x}_{ik}}+{{\varepsilon }_{i}}}$
where yi, xik, and εi represent the dependent variable, independent variable, and random error, respectively, at a spatial point i; (μi, vi) is the spatial position of point i; k is the number of independent variables; βk is the regression coefficient at point i; and β0 is the intercept. In this study, the annual mean NDVI and its variability were used as dependent variables and climate indicators and their variability were used as independent variables to analyze the effects of climate indicators on the spatial heterogeneity of the NDVI. The definition of the GWR model enables this method to greatly focus on the range of regions dominated by a certain type of vegetation; therefore, the annual mean NDVI can characterize the status of vegetation coverage. It should be noted that the spatial resolution of the GWR model was chosen as 50 km due to the large range of the studied area, which avoided data redundancy of the input variables and thus eliminated multicollinearity of the model.
The GWR model adopts the locally weighted least squares method. The weights are functions of spatial distance from the evaluated point to all the other observation points, and they attenuate with distance. The parameter equation is:
$\beta ({{\mu }_{i}},{{\nu }_{i}})={{({{X}^{T}}W({{\mu }_{i}},{{\nu }_{i}})X)}^{-1}}{{X}^{T}}W({{\mu }_{i}},{{\nu }_{i}})Y$
where β(μi, vi) is the unbiased estimate of the regression coefficient; W(μi, vi) is the weighting matrix; and X and Y are matrices of independent and dependent variables, respectively.
The GWR method generally uses a Gaussian model as a weighting function, where bandwidth is a function describing weighting values ​​and distances. The weighting function is expressed as:
${{\omega }_{ij}}=\exp \left( -\frac{d_{ij}^{2}}{{{b}^{2}}} \right)$
where ωij is the weight of point j at observation point i; dij represents the Euclidean distance from point i to j; and b is the bandwidth. If the distance between the observation points dij is larger than b, ωij equals 0; if dij equals 0, ωij equals 1. A Gaussian model was used to determine the optimal bandwidth as per the Akaike information criterion (AIC). As an index for assessing the complexity and accuracy of the model, the simulation effect is better for lower values of AIC. In general, when the difference between the AIC values of two models is larger than 3, the bandwidth b of the model with the smaller AIC value is the optimal bandwidth (Brown et al., 2012).

3 Results and analysis

3.1 Nonstationarity verification

The premise of the application of the GWR method is that there is a spatial difference between the geospatially associated independent and dependent variables. That is, the regression coefficient varies with the spatial position of the independent variables (Zhang et al., 2017). To verify whether the relationships between NDVI and climate change were spatially stationary, spatial autocorrelation analysis was performed on the regression parameters of the mean value and variability (Table 1). The results show that the autocorrelation coefficients of the regression parameters of the GWR model used in this study were all greater than 0, indicating that the selected parameters have positive spatial autocorrelation, these regression parameters were spatially nonstationary. The Z values ​​were all greater than 2.58, suggesting that the autocorrelation was statistically significant at the significance level of 0.01. Therefore, the GWR method can comprehensively reflect the quantitative effects of various climate factors on the NDVI and its variability in different geographical locations.
Table 1 Moran’s I and Z scores of regression coefficients for each factor in GWR model
Regression coefficients Average temperature Maximum temperature Minimum
temperature
Precipitation Relative humidity
Moran’s I Mean 0.75 0.75 0.74 0.76 0.76
Variability 0.68 0.73 0.70 0.70 0.63
Z Mean 41.58 42.03 41.22 42.07 41.99
Variability 34.18 39.72 36.64 37.28 30.54

3.2 Spatial nonstationary relationship between NDVI and temperature indicators

The spatial pattern of annual mean NDVI in China from 1982 to 2013 is shown in Figure 1a. It can be seen that the annual mean NDVI showed a decreasing trend from the southeast to the northwest during 1982 to 2013. From the GWR results of the NDVI and temperature indicators, it can be seen that the NDVI was spatially negatively correlated with temperature in Northeast, Northwest, and Southeast China (Figures 1b, 1c and 1d), indicating that the spatial distribution of vegetation activity was inhibited as temperature increased in these regions.
Figure 1 Spatial pattern of NDVI (a) and spatial regression coefficients between NDVI and temperature (b: average; c: maximum; d: minimum) in GWR model from 1982 to 2013
In the northeastern and northwestern regions, the three temperature indicators had negative effects on the NDVI. Spatially, the weakening of vegetation activity was due to the accelerated evapotranspiration of soil moisture and enhanced droughts as the temperature increased. In the southeastern region, especially in the Wushan-Xuefengshan Mountains and the Dongtinghu-Honghu Lake plain areas, the minimum temperature had the strongest negative effect on the NDVI (Figure 1d), indicating that vegetation activity was inhibited by the increase in nighttime temperature, which promoted respiration and accelerated the consumption of organic matter. In addition, the NDVI and moisture indicators in China from 1982 to 2013 were spatially positively correlated except for a few areas along the southeastern coast, indicating that changes in moisture factors such as precipitation and relative humidity generally played a positive role in vegetation activity.

3.3 Climate determinants for the spatial distribution of NDVI in different regions

To avoid the dimensional influence and perform comparison between the temperature and moisture indicators, it was necessary to normalize the values of the NDVI and climate indicators ​​to a range between 0 and 1. Then, the normalized regression coefficient was calculated using the GWR method to obtain the response pattern of vegetation activity to different climate indicators. Finally, based on the changing trend of vegetation activity and climate indicators, the normalized coefficients of different factors were compared to determine the most influential climate indicators and identify the dominant climate factors for the spatial distribution of vegetation activity and their impact areas (Figure 2).
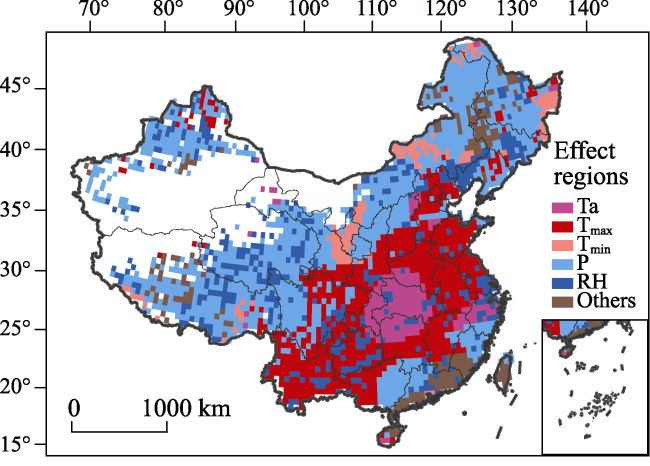
Figure 2 Affected regions of climatic factors to vegetation activity during 1982-2013 from GWR model
Overall, the NDVI was more prominently controlled by temperature in the North China Plain, the Middle-Lower Yangtze Plain, the Sichuan Basin, and the Yunnan-Guizhou Plateau (Figure 2). Among the temperature indicators, the maximum temperature had the largest impact area on the NDVI, accounting for 24.81% of the total area of ​​the country (Table 2). In most areas, the spatially gradual increase of temperature promoted the enhancement of vegetation activity. However, in the temperature-affected areas located in the northwestern and southwestern parts of China, the NDVI was negatively correlated with the annual mean temperature and maximum temperature (Figure 1b, c). Therefore, the weakening of vegetation activity in these areas was mainly driven by the increase of temperature.
Table 2 The distribution proportion of affected regions of climatic factors in China
Average temperature Maximum
temperature
Minimum
temperature
Precipitation Relative
humidity
Other factors
Number of grids 187 743 131 1278 454 202
Proportion (%) 6.24 24.81 4.37 42.67 15.16 6.74
In the Northeast China Plain, Inner Mongolia Plateau, Lvliang Mountains, Tianshan Mountains, and Tibetan Plateau, the spatial characteristics of the NDVI were more strongly affected by moisture. Among the moisture indicators, precipitation had the largest distribution of impact areas on the NDVI, accounting for 42.67% of the total area of ​​the country, while the distribution of the impact areas of relative humidity on the NDVI was scattered (Figure 2). Based on the changing trend of precipitation over the past 30 years (Figure 3b), it can be seen that precipitation in the northwestern part of the Northeast China Plain decreased. The spatially weakening of vegetation activity was driven by the moisture conditions, while the increase in temperature accelerated evapotranspiration, leading to aridification and further enhancing the inhibitory effect of hydrothermal conditions on vegetation activity. The upward trend of the NDVI was most substantial in the Lvliang Mountain area (Figure 3a), and precipitation also showed an upward trend. The abundant moisture and heat promoted the gradual enhancement of vegetation activity.
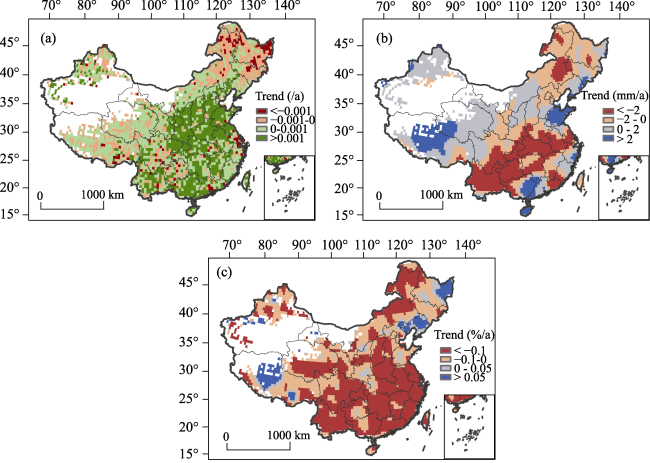
Figure 3 Spatial distribution of NDVI (a), precipitation (b) and relative humidity trends (c) from 1982 to 2013

3.4 Response pattern of the NDVI variation to climate variability

The GWR calculation results for climate and the NDVI variability showed that the areas where the NDVI variability and the variability of the three temperature indicators were spatially negatively correlated were mainly distributed from the Songnen Plain to the southern part of Greater Khingan Mountains and in the eastern and southern coastal regions (Figure 4). Except for parts of the eastern coastal regions, the NDVI increased slightly (Figure 3a), increases in the rate of temperature rise enhanced the slower rate of vegetation activity. However, most of these areas were not located in the impact areas of ​​temperature indicators (Figure 2). Therefore, vegetation activity in these areas was affected by moisture or other factors to a greater extent than temperature. It can be seen that the increase in the rate of temperature rise in these areas accelerated the loss of soil moisture and water of vegetation itself, thus inhibiting regional vegetation activity.
In the northern part of the Yunnan-Guizhou Plateau and the western part of the Middle-Lower Yangtze Plain, the NDVI generally showed an upward trend (Figure 3a). The NDVI variability was spatially positively correlated with the minimum temperature variability, but negatively correlated with the average/maximum temperature variability (Figure 4). Therefore, the adverse effects of temperature variability on vegetation activity were mainly caused by the maximum temperature variability. Spatially, the gradual increase of maximum temperature variability inhibited vegetation activity by enhancing respiration and reducing the photosynthesis of vegetation. All of the moisture indicators in the two regions showed decreasing trends (Figures 3b and 3c). The spatial relationships between the NDVI variability and moisture variability in the two regions were different. In the Yunnan-Guizhou Plateau, the variability of the NDVI and the variability of precipitation and humidity were mainly spatially negatively correlated, regions where moisture factors decreased rapidly were also regions where vegetation activity were enhanced rapidly. In the western part of the Middle-Lower Yangtze Plain, the NDVI variability was positively correlated with moisture variability, the increasing rate of vegetation activity decreased as the decreasing rate of moisture increased (Figure 5).
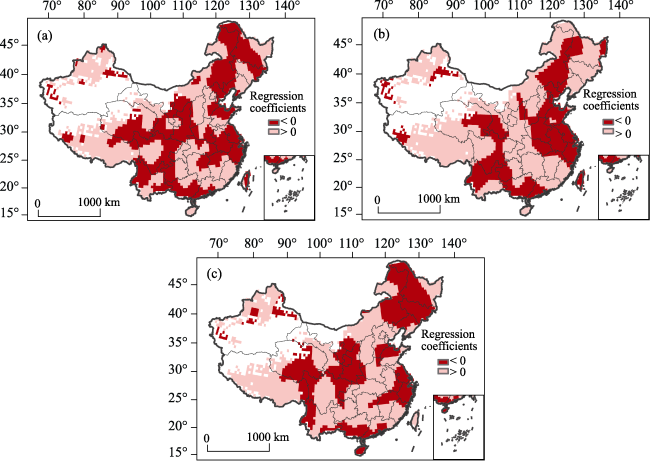
Figure 4 Spatial regression coefficients between NDVI variability and temperature variability (a. average; b. maximum; c. minimum) from GWR model from 1982 to 2013
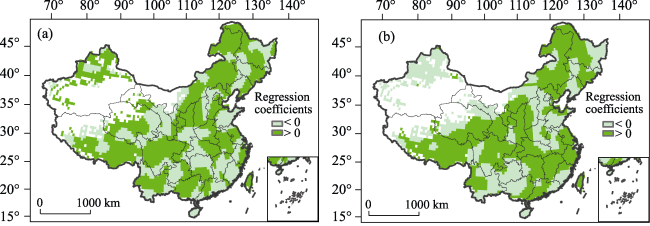
Figure 5 Spatial regression coefficients between NDVI variability and moisture variability (a. precipitation; b. relative humidity) from GWR model from 1982 to 2013
In the northern Greater Khingan Mountains and Changbai Mountains in northeast China, the variations of the NDVI and moisture indicators showed downward trends (Figure 3). The NDVI variability was spatially positively correlated with the variability of maximum temperature, but negatively correlated with the variability of average/minimum temperature (Figure 4). Therefore, the adverse effects of temperature variability on vegetation activity were mainly caused by the variability of minimum temperature. The increase in minimum temperature variability accelerated the consumption of biomass by increasing the assimilation rate of vegetation during the nighttime and was the main driving factor for the weakening of vegetation activity. The NDVI variability and moisture variability were spatially posi-tively correlated (Figure 5), indicating that the weakening of vegetation activity in these areas was affected by a combined effect of temperature and moisture variability. Similarly, in the Loess Plateau, where the influence of minimum temperature variability was prominent, the NDVI and precipitation both showed upward trends (Figure 3a, b) and the NDVI variability and precipitation variability were also positively correlated (Figure 5a). Therefore, the enhancement of vegetation activity in this area was more substantially affected by precipitation variability, weakening the inhibitory effect of temperature variability on vegetation activity to some extent. This was also consistent with the results that indicated that this region was located in the impact areas of precipitation (Figure 2).

4 Conclusions and discussion

Studies on different regions of China have shown that the responses of vegetation activity to temperature become more pronounced as temperature increases (Piao et al., 2011; Urban, 2015). Before the optimal temperature for photosynthesis is reached, the increase in temperature promotes photosynthesis (Michaletz et al., 2014). When the optimal temperature is exceeded, the increase in temperature enhances the respiration of vegetation, accelerating the consumption of nutrients; however, it accelerates evapotranspiration, reducing the accumulation of organic matter (Brohan et al., 2006). Moreover, the impacts of maximum and minimum temperatures on vegetation activity have different forms. Changes in moisture can regulate vegetation activity to a certain extent, while increased moisture content may inhibit vegetation activity through increased cloud cover and relative humidity. Therefore, vegetation activity exhibit nonlinear processes and compound effects in response to climate change. It is necessary to detect the patterns of spatial distribution and temporal variation of vegetation activity from the perspective of comprehensive analysis with multiple factors.
In this study, the spatial nonstationary relationships between vegetation activity and climate factors were simulated. The dominant climate factors and their mechanisms in different regions were identified based on the regression of the NDVI variation and the variability of hydrothermal indicators. Regions where moisture plays a dominant role in the NDVI are mainly concentrated in the northern part of China and the Tibetan Plateau. Vegetation growth in these areas is limited by moisture content. Increases in precipitation and humidity can promote the growth of vegetation, while increases in temperature may enhance water evapotranspiration and intensify drought tendency (Feng et al., 2016). Regions where temperature affects the NDVI are concentrated in East China, Central China, and Southwest of China. Soil moisture content in these areas is high and precipitation is abundant. Increases in temperature are conducive to the extension of the vegetation growth season and the accumulation of organic matter, thus the relationship between vegetation activity and temperature is closer than that between vegetation activity and moisture (Fang et al., 2004).
A regression analysis of climate variability is an effective complement to the response of vegetation activity to climate factors. A regression analysis reflects the dynamic process of vegetation response to climate change and can better explain the dynamic relationship between climatic factors and vegetation activity. A rise in the temperature increase rate has an inhibitory effect on the NDVI. The degree of impact of different temperature indicators is different and the regional difference is very substantial. The response pattern of vegetation activity to moisture change rate is unevenly distributed, which to some extent can balance the hydrothermal combination necessary for vegetation growth and play an important role in regulating vegetation activity. The intensity of vegetation activity depends on the response rate of photosynthetic and respiratory processes to climate factors (Wang et al., 2005). When the increase in the rate of photosynthesis exceeds that of respiration, a positive correlation of climate variability manifests. Therefore, the analysis of NDVI variation and climate variability can better reflect the relationship between vegetation activity variation and climate change, highlighting the impact of climate change on the mechanism of vegetation activity.
However, the NDVI is affected by both climate and non-climate factors. In this study, only climate factors are considered in the analysis of the influencing factors of the NDVI spatial heterogeneity in different regions. In fact, many other environmental factors can also affect the spatial heterogeneity of vegetation activity, including topography and soil conditions. For example, vegetation coverage in some areas is substantially positively correlated with elevation. Areas with vegetation degradation are mainly located at low altitudes and on low slopes (Li et al., 2014), while differences in soil physical and chemical properties can also affect the spatial heterogeneity of vegetation attributes and types (Wang et al., 2016). In addition, large-scale ecological engineering is also an important factor affecting the vegetation activity (et al., 2015; Zhang et al., 2017). The GWR model used in this study is based on the spatial regression of local ranges. Human activity in the neighborhood have a certain degree of similarity. Therefore, this method can reveal the influence of climate factors on the spatial heterogeneity of NDVI. Furthermore, since it is difficult for the GWR method to completely avoid the impact of human activity on ecosystems, the spatial regression parameters of NDVI-climate factors obtained in this study can also indirectly reflect the degree of influence of human activity and its spatial differences.
[1]
Andrew R L, Guan H D, Batelaan O , 2017. Large-scale vegetation responses to terrestrial moisture storage changes. Hydrology and Earth System Sciences, 21(9):4469-4478.

[2]
Baez S, Collins S L, Pockman W T , et al., 2013. Effects of experimental rainfall manipulations on Chihuahuan Desert grassland and shrubland plant communities. Oecologia, 172(4):1117-1127.

[3]
Brohan P, Kennedy J J, Harris I , et al., 2006. Uncertainty estimates in regional and global observed temperature changes: A new data set from 1850. Journal of Geophysical Research-Atmospheres, 111(D12):121-133.

[4]
Brown S, Versace V L, Laurenson L , et al., 2012. Assessment of spatiotemporal varying relationships between rainfall, land cover and surface water area using geographically weighted regression. Environmental Modeling and Assessment, 17(3):241-254.

[5]
Brunsdon C, Fotheringham A S, Charlton M E , 1996. Geographically weighted regression: A method for exploring spatial nonstationarity. Geographical Analysis, 28(4):281-298.

[6]
Del Grosso S, Parton W, Stohlgren T et al., 2008. Global potential net primary production predicted from vegetation class, precipitation, and temperature. Ecology, 89(8):2117-2126.

[7]
Ding Yongjian, Zhou Chenghu, Shao Mingan et al., 2013. Studies of earth surface processes: Progress and prospect. Advances in Earth Science, 28(4):407-419. (in Chinese)

[8]
Du Jiaqiang, Shu Jianmin, Zhang Linbo et al., 2011. Responses of vegetation to climate change in the headwaters of China’s Yellow River Basin based on zoning of dry and wet climate. Chinese Journal of Plant Ecology, 35(11):1192-1201. (in Chinese)

[9]
Duo A, Zhao W, Qu X , et al., 2016. Spatio-temporal variation of vegetation coverage and its response to climate change in North China Plain in the last 33 years. International Journal of Applied Earth Observation and Geoinformation, 53:103-117.

[10]
Fang J Y, Piao S L, He J S , et al., 2004. Increasing terrestrial vegetation activity in China, 1982-1999. Science in China Series C: Life Sciences, 47(3):229-240.

[11]
Fang J Y, Tang Y H, Son Y , 2010. Why are East Asian ecosystems important for carbon cycle research? Science China-Life Sciences, 53(7):753-756.

[12]
Feng X M, Fu B J, Piao S L , et al., 2016. Revegetation in China’s Loess Plateau is approaching sustainable water resource limits. Nature Climate Change, 6(11):1019-1022.

[13]
Fu Bojie, Yu Dandan, Nan , 2017. An indicator system for biodiversity and ecosystem services evaluation in China. Acta Ecologica Sinica, 37(2):341-348. (in Chinese)

[14]
Gao J B, Jiao K W, Wu S H et al., 2017. Past and future effects of climate change on spatially heterogeneous vegetation activity in China. Earth’s Future, 5(7):679-692.

[15]
Han Ya, Zhu Wenbo, Li Shuangcheng , 2016. Modelling relationship between NDVI and climatic factors in China using geographically weighted regression. Acta Scientiarum Naturalium Universitatis Pekinensis, 52(6):1125-1133. (in Chinese)

[16]
Hoover D L, Knapp A K, Smith M D , 2014. Resistance and resilience of a grassland ecosystem to climate extremes. Ecology, 95(9):2646-2656.

[17]
Jiang L L, Jiapaer G, Bao A M et al., 2017. Vegetation dynamics and responses to climate change and human activity in Central Asia. Science of the Total Environment, 599:967-980.

[18]
Kong Dongdong, Zhang Qiang, Huang Wenlin , et al., 2017. Vegetation phenology change in Tibetan Plateau from 1982 to 2013 and its related meteorological factors. Acta Geographica Sinica, 72(1):39-52. (in Chinese)

[19]
Krishnaswamy J, John R, Joseph S , 2014. Consistent response of vegetation dynamics to recent climate change in tropical mountain regions. Global Change Biology, 20(1):203-215.

[20]
Levine J M , 2015. Ecology: A trail map for trait-based studies. Nature, 529(7585):163-164.

[21]
Li Hengkai, Liu Xiaosheng, Li Bo , et al., 2014. Vegetation coverage variations and correlation with geomorphologic factors in red soil region: A case in south Jiangxi Province. Scientia Geographica Sinica, 34(1):103-109. (in Chinese)

[22]
Y H, Zhang L W, Feng X M et al., 2015. Recent ecological transitions in China: Greening, browning, and influential factors. Scientific Reports, 5:8732.

[23]
Mao D H, Wang Z M, Luo L , et al., 2012. Integrating AVHRR and MODIS data to monitor NDVI changes and their relationships with climatic parameters in Northeast China. International Journal of Applied Earth Observation and Geoinformation, 18(1):528-536.

[24]
Michaletz S T, Cheng D, Kerkhoff A J et al., 2014. Convergence of terrestrial plant production across global climate gradients. Nature, 512(7512):39-43.

[25]
Peng S S, Piao S L, Ciais P , et al., 2013. Asymmetric effects of daytime and night-time warming on Northern Hemisphere vegetation. Nature, 501(7465):88-92.

[26]
Piao S L, Nan H J, Huntingford C , et al., 2014. Evidence for a weakening relationship between interannual temperature variability and northern vegetation activity. Nature Communications, 5:5018.

[27]
Piao S L, Wang X H, Ciais P , et al., 2011. Changes in satellite-derived vegetation growth trend in temperate and boreal Eurasia from 1982 to 2006. Global Change Biology, 17(10):3228-3239.

[28]
Reyer C P O, Leuzinger S, Rammig A , et al., 2013. A plant's perspective of extremes: terrestrial plant responses to changing climatic variability. Global Change Biology, 19(1):75-89.

[29]
Seddon A W R, Macias-Fauria M, Long P R et al., 2016. Sensitivity of global terrestrial ecosystems to climate variability. Nature, 531(7593):229-243.

[30]
Urban M C , 2015. Accelerating extinction risk from climate change. Science, 348(6234):571-573.

[31]
Wang J M, Wang H D, Cao Y G , et al., 2016. Effects of soil and topographic factors on vegetation restoration in opencast coal mine dumps located in a loess area. Scientific Reports, 6:22058.

[32]
Wang Q, Ni J, Tenhunen J , 2005. Application of a geographically-weighted regression analysis to estimate net primary production of Chinese forest ecosystems. Global Ecology and Biogeography, 14(4):379-393.

[33]
Wang Q, Zhang Q P, Zhou W , 2012. Grassland coverage changes and analysis of the driving forces in Maqu County. Physics Procedia, 33:1292-1297.

[34]
Wright C K, de Beurs K M, Henebry G M , 2012. Combined analysis of land cover change and NDVI trends in the Northern Eurasian grain belt. Frontiers of Earth Science, 6(2):177-187.

[35]
Wu Shaohong, Zhao Yan, Tang Qiuhong , et al., 2015. Land surface pattern study under the framework of Future Earth. Progress in Geography, 34(1):10-17. (in Chinese)

[36]
Zeppel M J B, Wilks J V, Lewis J D , 2014. Impacts of extreme precipitation and seasonal changes in precipitation on plants. Biogeosciences, 11(11):3083-3093.

[37]
Zhang Xuemei, Wang Kelin, Yue Yuemin et al., 2017. Factors impacting on vegetation dynamics and spatial non-stationary relationships in karst regions of southwest China. Acta Ecologica Sinica, 37(12):4008-4018. (in Chinese)

[38]
Zhao M S, Running S W , 2010. Drought-induced reduction in global terrestrial net primary production from 2000through 2009. Science, 329(5994):940-943.

[39]
Zhao Yufei, Zhu Jiang, Xu Yan , 2014. Establishment and assessment of the grid precipitation datasets in China for recent 50 years. Journal of the Meteorological Sciences, 34(4):414-420. (in Chinese)

[40]
Zhou Guangsheng, He Qijin, Yin Xiaojie , 2015. Adaptability and Vulnerability of Chinese Vegetation/Terrestrial Ecosystems under Climate Change. Beijing: China Meteorological Press. (in Chinese)

Outlines

/