
Journal of Geographical Sciences >
Spatiotemporal changes in the bud-burst date of herbaceous plants in Inner Mongolia grassland
|
Tao Zexing, PhD, specialized in climate change and phenology. E-mail: taozx.12s@igsnrr.ac.cn |
Received date: 2019-04-28
Accepted date: 2019-09-17
Online published: 2019-12-06
Supported by
National Key R&D Program of China, No(2018YFA0606102)
National Natural Science Foundation of China, No(41771056)
National Natural Science Foundation of China, No(41901014)
Copyright
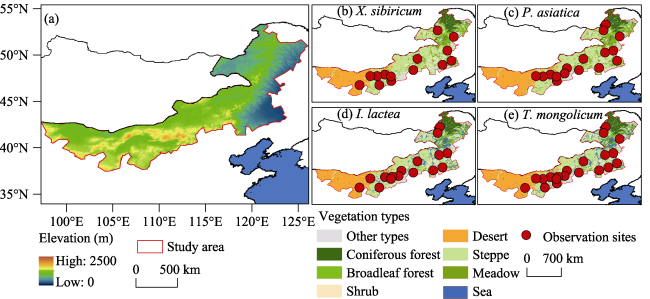
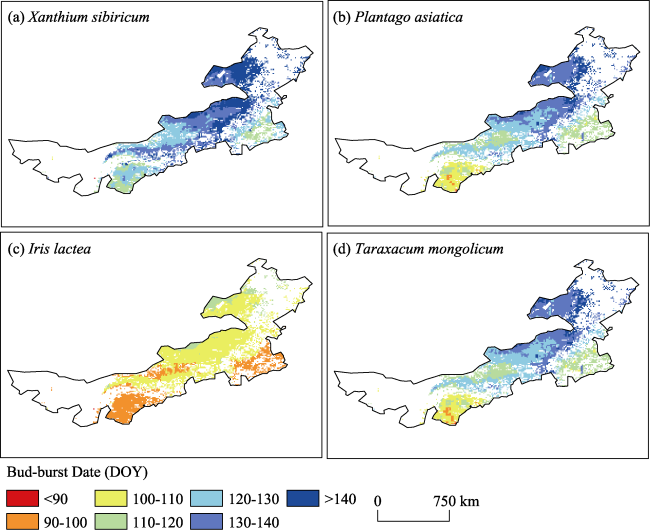
Phenological modeling is not only important for the projection of future changes of certain phenophases but also crucial for systematically studying the spatiotemporal patterns of plant phenology. Based on ground phenological observations, we used two existing temperature-based models and 12 modified models with consideration of precipitation or soil moisture to simulate the bud-burst date (BBD) of four common herbaceous plants—Xanthium sibiricum, Plantago asiatica, Iris lactea and Taraxacum mongolicum—in temperate grasslands in Inner Mongolia. The results showed that (1) increase in temperature promoted the BBD of all species. However, effects of precipitation and soil moisture on BBD varied among species. (2) The modified models predicted the BBD of herbaceous plants with R 2 ranging from 0.17 to 0.41 and RMSE ranging from 9.03 to 11.97 days, better than classical thermal models. (3) The spatiotemporal pattern of BBD during 1980-2015 showed that species with later BBD, e.g. X. sibiricum (mean: day of year 135.30) exhibited an evidently larger spatial difference in BBD (standard deviation: 13.88 days) than the other species. Our findings suggest that influences of temperature and water conditions need to be considered simultaneously in predicting the phenological response of herbaceous plants to climate change.
TAO Zexing , DAI Junhu , WANG Huanjiong , HUANG Wenjie , GE Quansheng . Spatiotemporal changes in the bud-burst date of herbaceous plants in Inner Mongolia grassland[J]. Journal of Geographical Sciences, 2019 , 29(12) : 2122 -2138 . DOI: 10.1007/s11442-019-1708-9
Table 1 Summary of four herbaceous plants investigated in this study |
| Species number | Scientific name | Life form | Mean BBD (day of the year) | Number of records |
|---|---|---|---|---|
| 1 | Xanthium sibiricum | Annual | 127 | 247 |
| 2 | Plantago asiatica | Perennial | 109 | 425 |
| 3 | Iris lactea | Perennial | 100 | 421 |
| 4 | Taraxacum mongolicum | Perennial | 103 | 512 |
Table 2 Summary of observation sites in this study |
| Site number | Site name | Long. (°E) | Lat. (°N) | Ele. (m) | Winter T (°C) | Species |
|---|---|---|---|---|---|---|
| 1 | Chifeng | 118.93 | 42.27 | 568.00 | -8.50 | 2, 3, 4 |
| 2 | Tongliao | 122.27 | 43.60 | 178.50 | -10.71 | 1, 2, 4 |
| 3 | Zhalantun | 122.73 | 48.00 | 306.50 | -15.93 | 1, 2, 4 |
| 4 | Xilin Gol | 116.07 | 43.95 | 989.50 | -16.12 | 1, 2, 3, 4 |
| 5 | Guyang | 110.05 | 41.03 | 1360.40 | -11.08 | 1, 2, 3, 4 |
| 6 | Urad Qianqi | 108.65 | 40.73 | 1020.40 | -7.68 | 1, 2, 4 |
| 7 | Bayannur | 107.4 | 40.77 | 1039.30 | -7.05 | 1, 2, 3, 4 |
| 8 | Ergun Youqi | 120.18 | 50.25 | 581.40 | -25.34 | 2, 3, 4 |
| 9 | Junggar | 111.22 | 39.87 | 1221.40 | -9.99 | 1, 2, 4 |
| 10 | Tuquan | 121.55 | 45.40 | 305.30 | -11.29 | 1, 2, 3, 4 |
| 11 | Hulun Buir | 119.75 | 49.15 | 620.80 | -22.14 | 1, 2, 3, 4 |
| 12 | Naiman | 120.65 | 42.85 | 362.90 | -9.62 | 1, 3, 4 |
| 13 | Xianghuangqi | 113.08 | 42.23 | 1322.10 | -11.99 | 2, 3, 4 |
| 14 | Qaharyouyizhongqi | 112.62 | 41.27 | 1747.80 | -13.68 | 2, 3, 4 |
| 15 | Wuchuan | 111.45 | 41.10 | 1595.00 | -12.57 | 3, 4 |
| 16 | Tumdzuoqi | 111.15 | 40.68 | 1020.30 | -8.24 | 1, 2, 3, 4 |
| 17 | Taipusi | 115.27 | 41.88 | 1468.90 | -15.16 | 1, 2, 3, 4 |
| 18 | Bayartuhushuo | 120.03 | 45.07 | 628.30 | -14.86 | 2, 3, 4 |
| 19 | Uxinqi | 109.03 | 39.10 | 1312.20 | -7.18 | 1, 3, 4 |
| 20 | Jilantai | 105.38 | 39.08 | 1235.00 | -4.25 | 1, 3, 4 |
Note: Long., Lat., Ele. and Winter T indicate longitude, latitude, elevation, and winter (previous December to February) temperature, respectively. Species number: 1. Xanthium sibiricum; 2. Plantago asiatica; 3. Iris lactea; 4. Taraxacum mongolicum. |
Figure 1 Location and terrain of the Inner Mongolia grassland. Red circles indicate the locations of phenological observation sites for four species. |
Table 3 Partial correlation coefficients between the bud-burst date and climatic factors for each species |
| Species number | Species | GDD | CD | AP | SM |
|---|---|---|---|---|---|
| 1 | X. sibiricum | -0.16* | 0.13 | 0.07 | 0.16* |
| 2 | P. asiatica | -0.15** | -0.01 | -0.03 | -0.16** |
| 3 | I. lactea | -0.13* | 0.05 | -0.12* | -0.14* |
| 4 | T. mongolicum | -0.12* | 0.03 | -0.01 | -0.13** |
GDD: growing degree days; CD: chilling days; AP: accumulated precipitation; SM: soil moisture. **: p<0.01, *: p<0.05 |
Table 4 Spring phenological models constructed in this study |
| Number | Model | Influencing factors | Equations | Parameters |
|---|---|---|---|---|
| 1 | SW | Temperature | (1) | t0, Tb, F0 |
| 2 | TSC | Temperature | (1), (2) | t0, Tb, a, b, f |
| 3 | SW-H1 | Temperature, soil moisture | (1), (3) | t0, Tb, FSM1, n1 |
| 4 | TSC-H1 | Temperature, soil moisture | (1), (2), (3) | t0, Tb, a, b, f, n1 |
| 5 | SW-H2 | Temperature, soil moisture | (1), (5) | t0, Tb, FSM2, k1 |
| 6 | TSC-H2 | Temperature, soil moisture | (1), (2), (5) | t0, Tb, a, b, f, k1 |
| 7 | SW-H3 | Temperature, soil moisture | (1), (7) | t0, Tb, FSM3, k2 |
| 8 | TSC-H3 | Temperature, soil moisture | (1), (2), (7) | t0, Tb, a, b, f, k2 |
| 9 | SW-P1 | Temperature, precipitation | (1), (4) | t0, Tb, FPRE1, n1 |
| 10 | TSC-P1 | Temperature, precipitation | (1), (2), (4) | t0, Tb, a, b, f, n1 |
| 11 | SW-P2 | Temperature, precipitation | (1), (6) | t0, Tb, FPRE2, k1 |
| 12 | TSC-P2 | Temperature, precipitation | (1), (2), (6) | t0, Tb, a, b, f, k1 |
| 13 | SW-P3 | Temperature, precipitation | (1), (8) | t0, Tb, FPRE3, k2 |
| 14 | TSC-P3 | Temperature, precipitation | (1), (2), (8) | t0, Tb, a, b, f, k2 |
Table 5 Results of parameter fitting of the optimal spring phenological model for each species |
| Species | Optimal model | Parameter values | |||||
|---|---|---|---|---|---|---|---|
| X. sibiricum | SW-H3 | t0 | Tb | F0 | k2 | ||
| 18 | 0.66 | 202.91 | -2.7 | ||||
| P. asiatica | TSC-H2 | t0 | Tb | a | b | f | k1 |
| 29 | 9.46 | 58.54 | 112 | 2.43 | 4.6 | ||
| I. lactea | TSC-P3 | t0 | Tb | a | b | f | n1 |
| 27 | 2.3 | 50.67 | 188.27 | 4.78 | 1.94 | ||
| T. mongolicum | TSC-H2 | t0 | Tb | a | b | f | k1 |
| 22 | 8.29 | 69.16 | 154.92 | 2.26 | 4.85 | ||
Table 6 Validation of the 14 phenological models for simulating the bud-burst dates of four species in Inner Mongolia |
| Species | Model | Internal validation | Cross-validation | ||||||
|---|---|---|---|---|---|---|---|---|---|
| Record number | RMSE | R2 | AIC | Record number | RMSE | R2 | AIC | ||
| X. sibiricum | SW | 86 | 11.90 | 0.36** | 433.98 | 78 | 12.82 | 0.33** | 406.01 |
| TSC | 86 | 11.82 | 0.34** | 436.85 | 78 | 12.65 | 0.33** | 407.86 | |
| SW-H1 | 86 | 11.91 | 0.35** | 436.07 | 78 | 12.69 | 0.35** | 406.32 | |
| TSC-H1 | 86 | 11.81 | 0.34** | 440.65 | 78 | 12.64 | 0.33** | 411.73 | |
| SW-H2 | 86 | 11.87 | 0.36** | 435.55 | 78 | 12.74 | 0.35** | 406.96 | |
| TSC-H2 | 86 | 11.73 | 0.35** | 437.49 | 78 | 12.59 | 0.34** | 409.07 | |
| SW-H3 | 86 | 11.63 | 0.39** | 432.07 | 78 | 11.97 | 0.41** | 397.19 | |
| TSC-H3 | 86 | 11.41 | 0.39** | 432.67 | 78 | 12.02 | 0.41** | 401.92 | |
| SW-P1 | 86 | 13.19 | 0.35** | 453.73 | 78 | 14.97 | 0.23** | 432.18 | |
| TSC-P1 | 86 | 11.78 | 0.35** | 438.11 | 78 | 12.67 | 0.33** | 410.11 | |
| SW-P2 | 86 | 11.91 | 0.36** | 436.13 | 78 | 12.68 | 0.35** | 406.29 | |
| TSC-P2 | 86 | 11.84 | 0.33** | 439.05 | 78 | 12.88 | 0.31** | 412.66 | |
| SW-P3 | 86 | 11.90 | 0.36** | 435.94 | 78 | 12.72 | 0.34** | 406.69 | |
| TSC-P3 | 86 | 11.82 | 0.34** | 438.77 | 78 | 12.55 | 0.34** | 408.65 | |
| P. asiatica | SW | 128 | 10.21 | 0.16** | 602.74 | 122 | 10.68 | 0.22** | 585.91 |
| TSC | 128 | 8.90 | 0.12** | 571.74 | 122 | 9.30 | 0.26** | 556.20 | |
| SW-H1 | 128 | 10.22 | 0.16** | 605.15 | 122 | 10.68 | 0.22** | 587.91 | |
| TSC-H1 | 128 | 8.89 | 0.12** | 575.31 | 122 | 9.29 | 0.26** | 559.88 | |
| SW-H2 | 128 | 8.26 | 0.14** | 550.67 | 122 | 9.24 | 0.22** | 552.43 | |
| TSC-H2 | 128 | 7.81 | 0.16** | 540.09 | 122 | 9.03 | 0.23** | 550.91 | |
| SW-H3 | 128 | 10.32 | 0.16** | 607.48 | 122 | 10.53 | 0.22** | 584.46 | |
| TSC-H3 | 128 | 8.91 | 0.13** | 573.86 | 122 | 9.44 | 0.25** | 561.67 | |
| SW-P1 | 128 | 11.59 | 0.12** | 637.18 | 122 | 11.17 | 0.20** | 598.93 | |
| TSC-P1 | 128 | 8.89 | 0.11** | 573.24 | 122 | 9.27 | 0.26** | 557.40 | |
| SW-P2 | 128 | 9.98 | 0.16** | 598.93 | 122 | 10.34 | 0.22** | 579.89 | |
| TSC-P2 | 128 | 8.84 | 0.12** | 571.94 | 122 | 9.26 | 0.26** | 557.12 | |
Table 6 (Continued 1) Validation of the 14 phenological models for simulating the bud-burst dates of four species in Inner Mongolia |
| Species | Model | Internal validation | Cross-validation | ||||||
|---|---|---|---|---|---|---|---|---|---|
| Record number | RMSE | R2 | AIC | Record number | RMSE | R2 | AIC | ||
| SW-P3 | 128 | 9.81 | 0.15** | 594.65 | 122 | 10.14 | 0.23** | 575.27 | |
| TSC-P3 | 128 | 8.54 | 0.13** | 562.96 | 122 | 9.06 | 0.25** | 551.79 | |
| I. lactea | SW | 134 | 12.68 | 0.02 | 688.75 | 129 | 13.28 | 0.08** | 675.20 |
| TSC | 134 | 10.59 | 0.03 | 644.39 | 129 | 11.30 | 0.11** | 637.58 | |
| SW-H1 | 134 | 12.68 | 0.02 | 690.75 | 129 | 15.85 | 0.05* | 722.86 | |
| TSC-H1 | 134 | 10.58 | 0.03* | 648.20 | 129 | 13.11 | 0.06* | 679.86 | |
| SW-H2 | 134 | 9.48 | 0.04* | 612.66 | 129 | 9.99 | 0.12** | 603.71 | |
| TSC-H2 | 134 | 8.92 | 0.05** | 600.54 | 129 | 9.87 | 0.11** | 604.59 | |
| SW-H3 | 134 | 12.31 | 0.03 | 682.74 | 129 | 13.15 | 0.09** | 674.66 | |
| TSC-H3 | 134 | 10.53 | 0.03* | 644.89 | 129 | 11.25 | 0.11** | 638.47 | |
| SW-P1 | 134 | 10.52 | 0.03 | 644.66 | 129 | 11.23 | 0.11** | 637.90 | |
| TSC-P1 | 134 | 14.11 | 0.01 | 719.39 | 129 | 14.63 | 0.02 | 702.25 | |
| SW-P2 | 134 | 12.39 | 0.05* | 684.60 | 129 | 12.63 | 0.10** | 664.24 | |
| TSC-P2 | 134 | 10.22 | 0.05** | 636.80 | 129 | 11.14 | 0.14** | 635.91 | |
| SW-P3 | 134 | 11.67 | 0.06** | 668.59 | 129 | 12.32 | 0.12** | 657.80 | |
| TSC-P3 | 134 | 9.48 | 0.09** | 616.73 | 129 | 10.00 | 0.17** | 608.14 | |
| T. mongolicum | SW | 167 | 12.81 | 0.03* | 859.71 | 161 | 12.78 | 0.12** | 828.36 |
| TSC | 167 | 10.40 | 0.03* | 794.03 | 161 | 11.46 | 0.12** | 797.21 | |
| SW-H1 | 167 | 12.81 | 0.03* | 861.71 | 161 | 16.50 | 0.06** | 912.61 | |
| TSC-H1 | 167 | 10.40 | 0.03* | 798.03 | 161 | 15.58 | 0.05* | 900.16 | |
| SW-H2 | 167 | 9.46 | 0.05** | 760.50 | 161 | 11.72 | 0.16** | 802.66 | |
| TSC-H2 | 167 | 8.99 | 0.05** | 747.47 | 161 | 10.56 | 0.19** | 772.95 | |
| SW-H3 | 167 | 12.78 | 0.04* | 860.87 | 161 | 12.75 | 0.12** | 829.70 | |
| TSC-H3 | 167 | 10.71 | 0.03* | 805.88 | 161 | 11.33 | 0.14** | 795.62 | |
| SW-P1 | 167 | 10.68 | 0.03 | 805.12 | 161 | 11.35 | 0.14** | 796.13 | |
| TSC-P1 | 167 | 13.88 | 0.02 | 888.48 | 161 | 13.81 | 0.08** | 855.33 | |
| SW-P2 | 167 | 12.57 | 0.03* | 855.44 | 161 | 12.92 | 0.11** | 833.91 | |
| TSC-P2 | 167 | 10.73 | 0.03* | 806.63 | 161 | 11.09 | 0.16** | 788.73 | |
| SW-P3 | 167 | 12.13 | 0.04* | 843.63 | 161 | 12.55 | 0.13** | 824.70 | |
| TSC-P3 | 167 | 10.15 | 0.03* | 788.16 | 161 | 10.86 | 0.15** | 782.05 | |
**: p<0.01, *: p<0.05 |
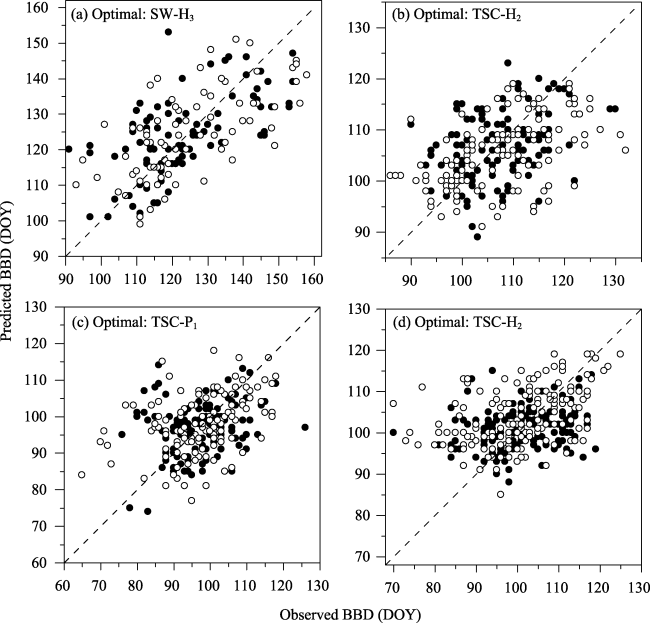
Figure 2 Comparison of observed and simulated bud-burst date (BBD) using the optimal phenological model for (a) Xanthium sibiricum, (b) Plantago asiatica, (c) Iris lactea and (d) Taraxacum mongolicum. Dots and circles represent data in internal validation and cross-validation, respectively. Dashed line is 1:1. DOY: day of the year. |
Figure 3 Spatial pattern of the mean bud-burst date for four species in the Inner Mongolia grassland during 1980-2015. DOY: day of the year |
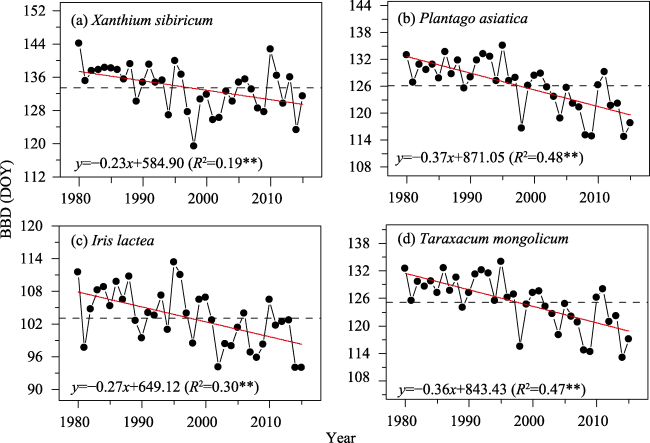
Figure 4 Interannual variation of bud-burst date (BBD) for the four species in the Inner Mongolia grassland during 1980-2015. Red line refers to linear regression and dashed line to the multi-year mean BBD. **: p<0.01 |
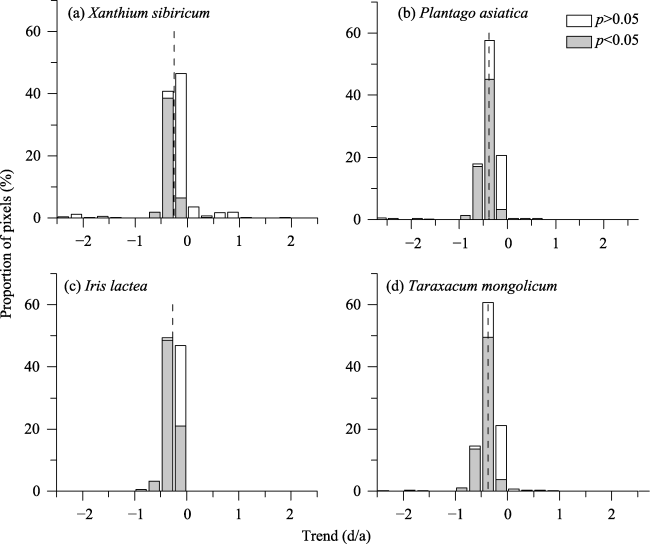
Figure 5 Frequency distribution of the trend in the bud-burst date for four species in the Inner Mongolia grassland during 1980-2015. Dashed line shows the mean linear trend for each species. |
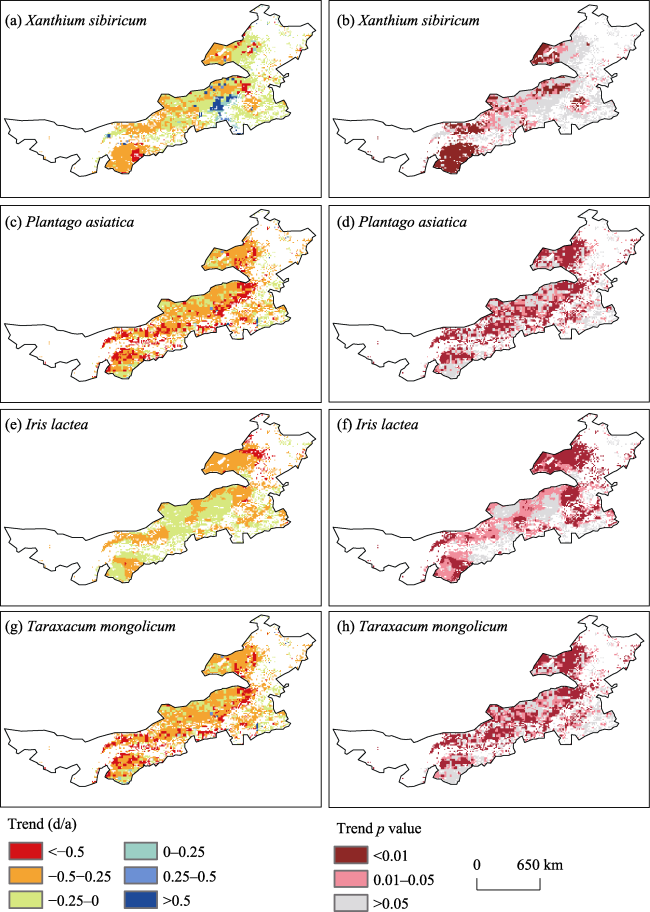
Figure 6 Spatial pattern of the trend in bud-burst date for four species in the Inner Mongolia grassland during 1980-2015. Images on the right represent significance level. |
| 1 |
|
| 2 |
|
| 3 |
|
| 4 |
|
| 5 |
|
| 6 |
|
| 7 |
|
| 8 |
|
| 9 |
|
| 10 |
|
| 11 |
|
| 12 |
|
| 13 |
|
| 14 |
|
| 15 |
|
| 16 |
|
| 17 |
|
| 18 |
|
| 19 |
|
| 20 |
|
| 21 |
|
| 22 |
|
| 23 |
|
| 24 |
|
| 25 |
|
| 26 |
|
| 27 |
|
| 28 |
|
| 29 |
|
| 30 |
|
| 31 |
|
| 32 |
|
| 33 |
|
| 34 |
|
| 35 |
|
| 36 |
|
| 37 |
|
| 38 |
|
| 39 |
|
| 40 |
|
| 41 |
|
| 42 |
|
| 43 |
|
| 44 |
|
| 45 |
|
| 46 |
|
| 47 |
|
| 48 |
|
| 49 |
|
| 50 |
|
| 51 |
|
| 52 |
|
| 53 |
|
| 54 |
|
/
| 〈 |
|
〉 |