
Journal of Geographical Sciences >
Moisture sources of the Alashan Sand Seas in western Inner Mongolia, China during the Last Glacial Maximum and mid-Holocene: Interpretation from modern analogues, paleoclimatic simulations and geological records
|
Feng Yingying (1994–), specialized in palaeoclimatic simulations. |
Received date: 2019-01-26
Accepted date: 2019-09-09
Online published: 2019-12-06
Supported by
National Natural Science Foundation of China, No(41430532)
National Natural Science Foundation of China, No(41672182)
Copyright
Knowledge of moisture sources is of great significance for understanding climatic change and landscape evolution in desert environments. In this paper, we aim to clarify moisture origins for the Alashan (Alxa) Sand Seas (ALSS) in western Inner Mongolia and their transport pathways during the Last Glacial Maximum (LGM) and the mid-Holocene using modern analogues and paleoclimatic simulations. Precipitation data for the period 1959-2015 from meteorological stations in the study area and wind and specific humidity data from the European Center for Medium-Range Weather Forecasts (ECMWF) daily reanalysis were adopted to determine the moisture sources of summer precipitation in the ALSS. In addition paleoclimate simulations under PMIP3/CMIP5 protocols were used to detect the atmospheric circulation and precipitation at 21 ka BP and 6 ka BP over the ALSS. We also reviewed paleoclimate records from the ALSS to acquire a semi-quantitative reconstruction of the moisture history during the late Pleistocene and Holocene. Our results suggest that the summer monsoon transported water vapor from the Indian Ocean and the South China Sea to the ALSS during July and August, causing increased precipitation. The dominant moisture source was from the southwest monsoon, while the East Asian summer monsoon also partly contributed to precipitation in the ALSS. The increased humidity during the period 8.2-4.2 ka BP in the ALSS, as derived from both climate simulation outputs and sedimentary records, was caused by monsoons according to the outputs of simulations. At 21 ka BP, the moisture sources of the ALSS were greatly associated with the prevailing westerlies.
FENG Yingying , YANG Xiaoping . Moisture sources of the Alashan Sand Seas in western Inner Mongolia, China during the Last Glacial Maximum and mid-Holocene: Interpretation from modern analogues, paleoclimatic simulations and geological records[J]. Journal of Geographical Sciences, 2019 , 29(12) : 2101 -2121 . DOI: 10.1007/s11442-019-1707-x
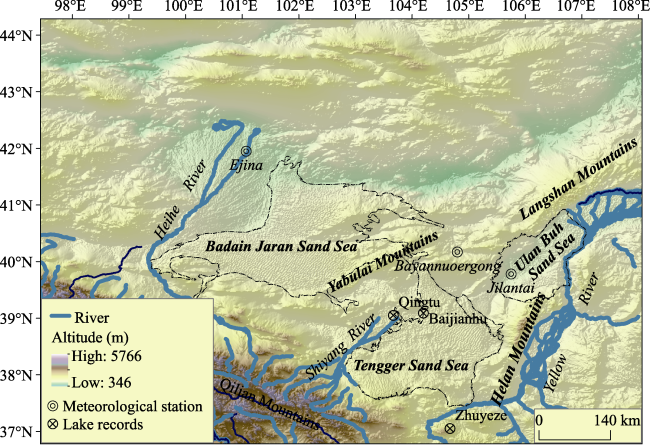
Figure 1 Overview of the Alashan Sand Sea (Badain Jaran Sand Sea, Tengger Sand Sea, Ulan Buh Sand Sea) with the locations of the meteorological stations and main lake record sites referenced in this paper. |
Table 1 Standard precipitation intensity levels (part of inland regions)* |
| Light rain | Moderate rain | Heavy rain | Rainstorm | |
|---|---|---|---|---|
| 24 h Precipitation | 0.1-9.9 mm | 10.0-24.9 mm | 25.0-49.9 mm | 50.0-99.9 mm |
*Issued by the China Meteorological Administration (http://www.gov.cn/ztzl/2008tffy/content_1113935.htm). |
Table 2 Basic information of the five climate models within PMIP3 used for the LGM and mid-Holocene experiments in this study |
| Model | Model type | Atmospheric resolution | Length of run analyzed (year) |
|---|---|---|---|
| CCSM4 | AOGCM | 1.25° ´ ~0.9°, L26 | 301 |
| FGOALS-g2 | AOVGCM | ~2.8° ´ 3-6°, L26 | 100 |
| CNRM-CM5 | AOGCM | ~1.4° ´ 1.4°, L31 | 200 |
| MPI-ESM-P | AOGCM | 1.875° ´ ~1.9°, L47 | 100 |
| MRI-CGCM3 | AOGCM | 1.125° ´ ~1.1°, L48 | 100 |
Note: AOGCM represents coupled atmosphere-ocean general circulation model; AOVGCM represents atmosphere-ocean-vegetation general circulation model. |
Table 3 Boundary conditions of orbital parameters and trace gas concentrations in the climate simulations for the LGM and mid-Holocene |
| Eccentricity | Obliquity (°) | Precession (ω-180°) | CO2 (ppm) | CH4 (ppb) | N2O (ppb) | |
|---|---|---|---|---|---|---|
| LGM | 0.018994 | 22.949 | 114.42 | 185 | 350 | 200 |
| Mid-Holocene | 0.018682 | 24.105 | 0.87 | 280 | 650 | 270 |
Table 4 List of proxy record sites from the ALSS in the late Pleistocene |
| SiteNo. | Site name | Lat. (°N) | Lon. (°E) | Proxy type | Dating method | Number of dates | References |
|---|---|---|---|---|---|---|---|
| 1 | Jilantai | 39.74 | 105.70 | Pollen, grain size | OSL | 4 | Fan et al. (2017) |
| 2 | Tengger | 39.15 | 104.16 | Lacustrine terraces | 14C | 14 | Zhang et al. (2004) |
| 3 | Southeastern margin of Tengger | 37.34 | 105.23 | Grain size, Carbonate content. Elemental composition | OSL | 4 | Qiang et al. (2010) |
| 4 | Southeast of Badain Jaran | - | - | Aeolian deposits | OSL | 26 | Fan et al. (2016) |
Table 5 List of proxy record sites from the ALSS in the Holocene |
| SiteNo. | Site name | Lat. (°N) | Lon. (°E) | Proxy type | Dating method | Number of dates | References |
|---|---|---|---|---|---|---|---|
| 1 | Badain Jaran | - | - | Lacustrine deposits, Aeolian deposits | 14C,TL | 5 | Yang and Williams (2003) |
| 2 | Badain Jaran | - | - | Shorelines | 14C | 9 | Yang et al. (2010) |
| 3 | Badain Jaran | - | - | Lacustrine deposits, Aeolian deposits, Calcareous cementation layers, cemented plant roots | 14C,TL | 7 | Yang et al. (2003) |
| 4 | Huahai | 40.43 | 98.07 | Grain size, C/N, Carbonate, TOC | 14C | 17 | Wang et al. (2013) |
| 5 | Tengger | 39.15 | 104.16 | Lacustrine terraces | 14C | 14 | Zhang et al. (2004) |
| 6 | Zhuyeze | 37.05 | 104.67 | Grain size, pollen, TOC, T/N | 14C | 13 | Li et al. (2008) |
| 7 | Baijian Hu | - | - | Shorelines | OSL | 25 | Long et al. (2012) |
| 8 | Qingtu Hu | 39.05 | 103.67 | Grain size, carbonate, TOC, C/N, δ13C | 14C,OSL | 16 | Long et al. (2010) |
| 9 | Qingtu Hu | 39.07 | 103.61 | Pollen | 14C | 5 | Zhao et al. (2008) |
| 10 | Ulan Buh | 39.77 39.86 | 105.76 106.39 | GPR reflecting, Grain size | OSL | 6 | Fan et al. (2010) |
| 11 | Ulan Buh | - | - | Grain size, Loss on ignition, Pollen analysis | OSL | 14 | Chen et al. (2014) |
| 12 | Ulan Buh | - | - | Grain size, elevation | OSL | 19 | Zhao et al. (2012) |
| 13 | Alashan Sand Sea | - | - | Calcareous root tubes | 14C | 34 | (Li et al., 2015a, Li et al., 2015b) |
Table 6 Details of 47 precipitation events during the period 1959-2015 that affected more than two meteorological stations in the ALSS region with maximum daily precipitation exceeding 10 mm. |
| No | Start date | Duration (days) | Number of station | Precipitation (min) | Precipitation (max) | Moisture source |
|---|---|---|---|---|---|---|
| 1 | 1958-08-01 | 1 | 2 | 11.4 | 25.7 | Westerlies |
| 2 | 1958-08-07 | 1 | 2 | 33.2 | 41.3 | Westerlies |
| 3 | 1960-07-19 | 3 | 2 | 14.5 | 17 | Westerlies |
| 4 | 1961-07-31 | 2 | 2 | 12 | 40.4 | Westerlies |
| 5 | 1961-08-06 | 2 | 2 | 26.6 | 36.5 | Westerlies |
| 6 | 1963-07-20 | 2 | 2 | 14.6 | 29.9 | Westerlies |
| 7 | 1969-06-15 | 2 | 2 | 11 | 14 | Westerlies |
| 8 | 1969-08-09 | 1 | 2 | 13.5 | 14.2 | Westerlies |
| 9 | 1970-08-01 | 1 | 2 | 14 | 18 | Westerlies |
| 10 | 1970-08-17 | 2 | 2 | 24.2 | 33.1 | Monsoon |
| 11 | 1973-08-10 | 4 | 3 | 11.9 | 32.9 | Monsoon |
| 12 | 1973-08-15 | 2 | 2 | 10.2 | 36.6 | Westerlies |
| 13 | 1974-07-28 | 3 | 4 | 10.6 | 42.1 | Monsoon |
| 14 | 1977-07-28 | 1 | 3 | 11.6 | 44 | Westerlies |
| 15 | 1977-08-19 | 2 | 3 | 10.2 | 34.2 | Westerlies |
| 16 | 1978-07-27 | 3 | 4 | 10.9 | 20.3 | Westerlies |
| 17 | 1979-07-01 | 2 | 2 | 10.9 | 15 | Westerlies |
| 18 | 1979-07-18 | 4 | 3 | 13 | 32.4 | Monsoon |
| 19 | 1979-08-06 | 2 | 2 | 26.5 | 27.9 | Monsoon |
| 20 | 1980-08-01 | 2 | 2 | 10.3 | 13.5 | Monsoon |
| 21 | 1981-07-02 | 1 | 3 | 14.6 | 23.8 | Westerlies |
| 22 | 1983-08-13 | 1 | 2 | 20.1 | 20.9 | Monsoon |
| 23 | 1984-06-13 | 1 | 2 | 13.8 | 19.3 | Westerlies |
| 24 | 1993-07-20 | 2 | 2 | 28.4 | 31.2 | Westerlies |
| 25 | 1993-08-10 | 1 | 2 | 13.4 | 17.7 | Westerlies |
| 26 | 1993-08-29 | 1 | 2 | 14.2 | 21 | Westerlies |
| 27 | 1994-07-07 | 1 | 2 | 20.2 | 28.7 | Westerlies |
| 28 | 1994-08-12 | 1 | 3 | 14 | 18 | Westerlies |
| 29 | 1995-08-10 | 1 | 2 | 10.4 | 14.8 | Westerlies |
| 30 | 1995-08-15 | 2 | 2 | 18 | 24.1 | Westerlies |
| 31 | 1996-07-27 | 3 | 3 | 13.1 | 24 | Westerlies |
| 32 | 1997-07-30 | 1 | 2 | 12.4 | 17.6 | Monsoon |
| 33 | 1998-06-11 | 1 | 3 | 10.3 | 44 | Monsoon |
| 34 | 1999-07-06 | 1 | 2 | 11.1 | 20.5 | Westerlies |
| 35 | 2000-08-07 | 1 | 2 | 11.9 | 19.1 | Westerlies |
| 36 | 2002-06-07 | 2 | 3 | 18.9 | 31.2 | Monsoon |
| 37 | 2002-06-21 | 1 | 2 | 21.3 | 23 | Westerlies |
| 38 | 2003-06-25 | 1 | 3 | 14.1 | 24.8 | Westerlies |
| 39 | 2003-08-29 | 1 | 2 | 11.4 | 14.3 | Westerlies |
Table 6 Details of 47 precipitation events during the period 1959-2015 that affected more than two meteorological stations in the ALSS region with maximum daily precipitation exceeding 10 mm. (Continued 1) |
| No | Start date | Duration (days) | Number of station | Precipitation (min) | Precipitation (max) | Moisture source |
|---|---|---|---|---|---|---|
| 40 | 2006-08-17 | 2 | 2 | 13.5 | 26 | Monsoon |
| 41 | 2008-07-28 | 2 | 3 | 12.1 | 33.2 | Monsoon |
| 42 | 2009-08-18 | 1 | 3 | 13.3 | 26.5 | Westerlies |
| 43 | 2012-06-27 | 1 | 2 | 16.5 | 34.6 | Westerlies |
| 44 | 2012-07-29 | 2 | 2 | 14.5 | 33.1 | Monsoon |
| 45 | 2016-06-02 | 1 | 2 | 12.2 | 18.3 | Westerlies |
| 46 | 2016-07-10 | 1 | 2 | 13 | 16.3 | Westerlies |
| 47 | 2016-08-13 | 1 | 2 | 14.5 | 22.6 | Monsoon |
Note: Start date refers to the first day of a precipitation event. Precipitation (min) is the minimum daily precipitation (mm) of all meteorological stations observing precipitation. Precipitation (max) is the maximum daily precipitation (mm) of all meteorological stations observing precipitation. Number of stations is the number of meteorological stations that recorded a rainfall event. The statistics include four meteorological stations: Minqin (38.63°N, 103.08°E), Bayannuoergong (40.17°N, 104.8°E), Jilantai (39.78°N, 105.75°E) and Ejina (41.95°N, 101.07°E). The bold font indicates “regional severe precipitation events”. |
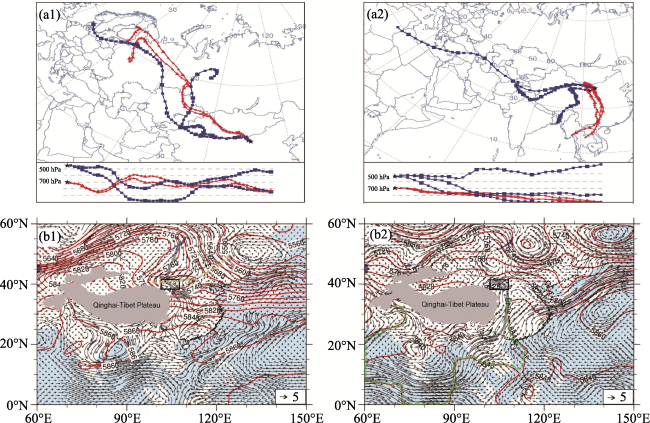
Figure 2 Backward water vapor trajectories before rainfall in the ALSS (a1, a2) and the atmospheric circulation (500 hPa geopotential height (gpm) and water vapor flux (g/(m*s)) at 700 hPa) (b1, b2) of two typical rainfall events. a1, b1: Rainfall event on June 15, 1969, where the westerlies transported the moisture for precipitation in ALSS. a2, b2: Rainfall event on July 30, 1974, where the summer monsoon transported the moisture. The blank rectangle refers to the ALSS region, the yellow dashed line is the westerly trough, and the green dashed line circles the trough region between the Arabian Peninsula High and the West Pacific Subtropical High. |
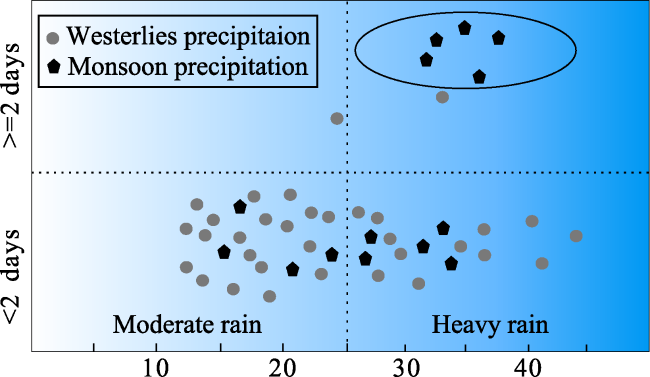
Figure 3 Moisture source statistics for the following rain types: moderate rain, and heavy rain refer to rainfall for 2 or fewer days, and rainfall for more than 2 days, respectively. Only rainfall events covering more than two of the four meteorological stations were analyzed. |
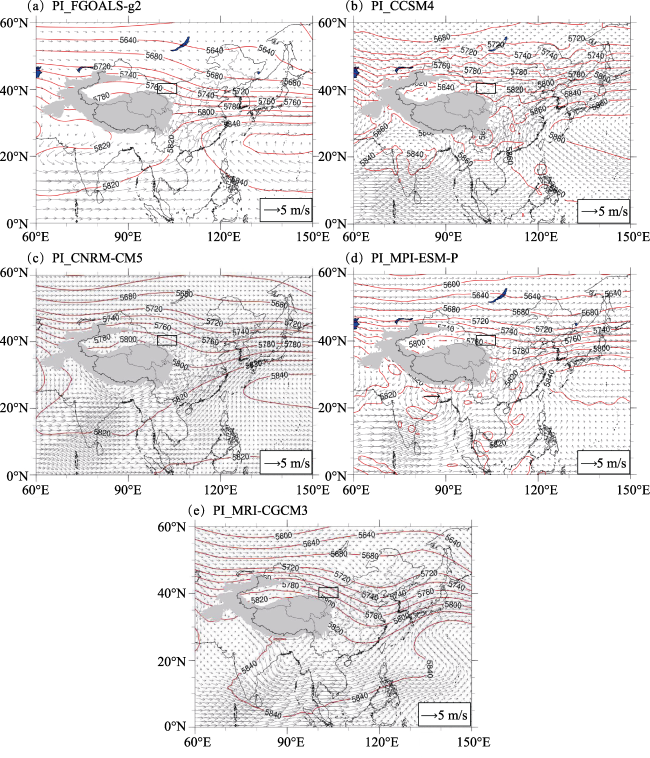
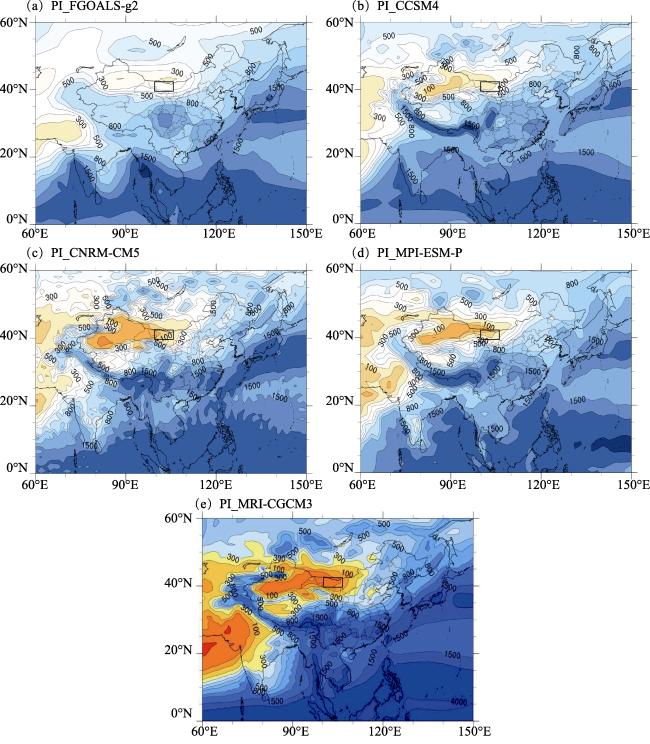
Figure 4 The simulation outputs for the water vapor flux at 700 hPa (g/(m*s)) and 500 hPa geopotential height (gpm) for the PI control experiment. (a): FGOALS-g2; (b): CCSM4; (c): CNRM-CM5; (d): MPI-ESM-P; and (e): MRI-CGCM3. The blank rectangle refers to the ALSS region. |
Figure 5 The simulation outputs for annual precipitation (mm) in the PI control experiment. (a): FGOALS-g2; (b): CCSM4; (c): CNRM-CM5; (d): MPI-ESM-P; and (e): MRI-CGCM3. The blank rectangle refers to the ALSS region. |
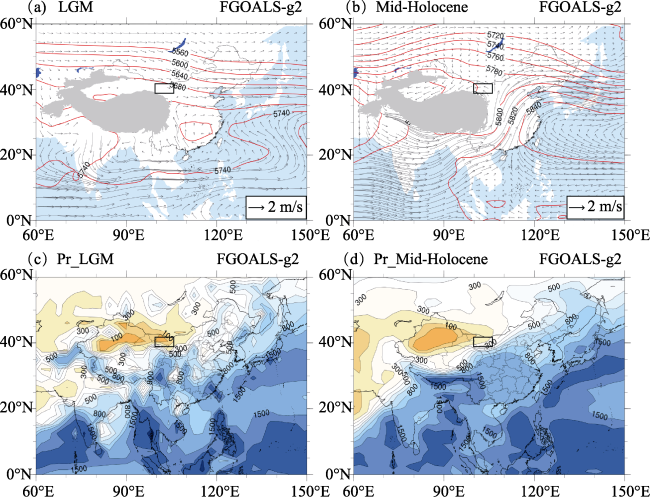
Figure 6 The FGOALS-g2 simulation outputs for the LGM and mid-Holocene. (a-b): atmospheric circulation (water vapor flux at 700 hPa (g/(m*s)) and 500 hPa geopotential height (gpm)); (c-d): annual precipitation (mm). The blank rectangle refers to the ALSS region. |
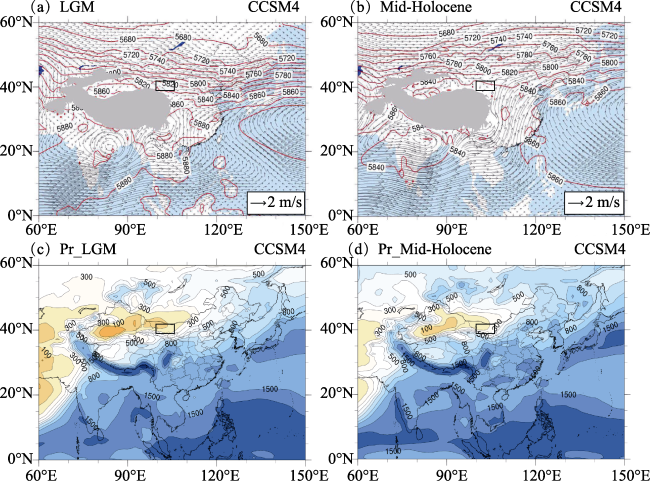
Figure 7 The CCSM4 simulation outputs for the LGM and mid-Holocene. (a-b): atmospheric circulation (water vapor flux at 700 hPa g/(m*s)) and 500 hPa geopotential height (gpm)); (c-d): annual precipitation (mm). The blank rectangle refers to the ALSS region. |
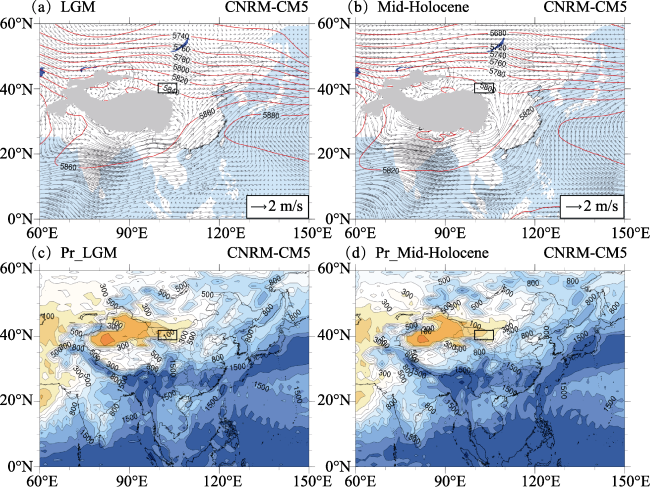
Figure 8 The CM5 simulation outputs for the LGM and mid-Holocene. (a-b): atmospheric circulation (water vapor flux at 700 hPa (g/(m*s)) and 500 hPa geopotential height (gpm)); (c-d): annual precipitation (mm). The blank rectangle refers to the ALSS region. |
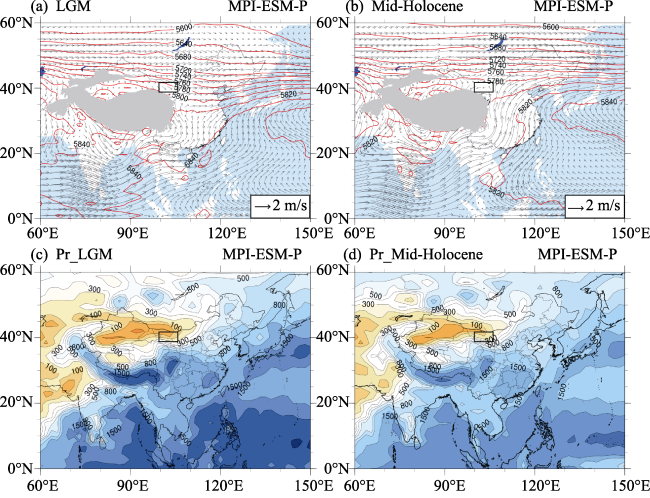
Figure 9 The MPI-ESM-P simulation outputs for the LGM and mid-Holocene. (a-b): atmospheric circulation (water vapor flux at 700 hPa (g/(m*s)) and 500 hPa geopotential height (gpm)); (c-d): annual precipitation (mm). The blank rectangle refers to the ALSS region. |
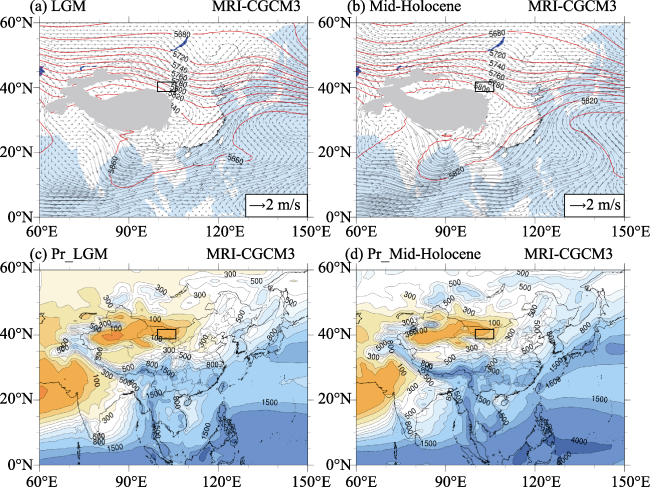
Figure 10 The MRI-CGCM3 simulation outputs for the LGM and mid-Holocene. (a-b): atmospheric circulation (water vapor flux at 700 hPa (g/(m*s)) and 500 hPa geopotential height (gpm)); (c-d): annual precipitation (mm). The blank rectangle refers to the ALSS region. |
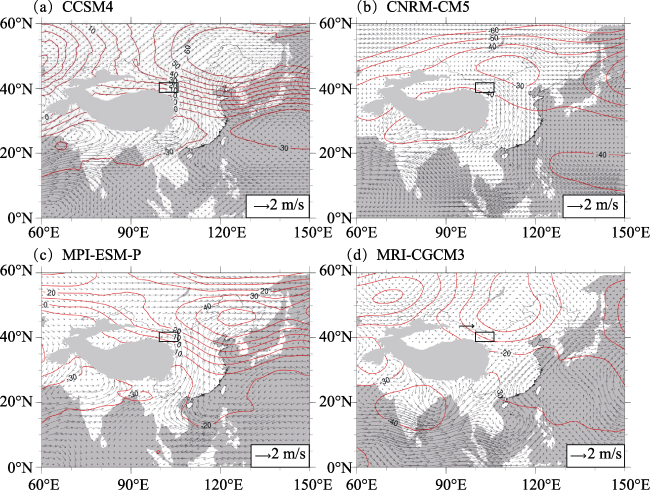
Figure 11 The difference in the atmospheric circulation between the mid-Holocene and LGM (water vapor flux at 700 hPa (g/(m*s)) and 500 hPa geopotential height (gpm)). (a): CCSM4; (b): CNRM-CM5; (c): MPI-ESM-P; and (d): MRI-CGCM3. The blank rectangle refers to the ALSS region. |
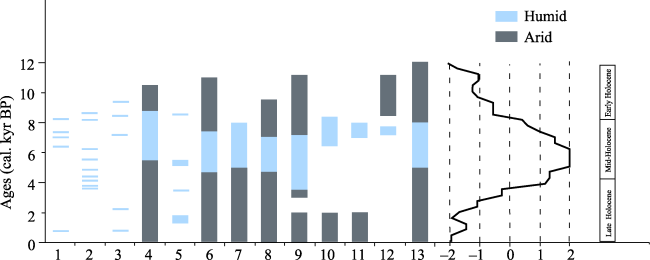
Figure 12 Holocene moisture evolution of the ALSS region in previous studies and our calculated moisture index. -2, -1, 0, +1, and +2 represent the calculated moisture index. -2 indicates the most arid intervals for each site; -1 indicates an arid environment; 0 indicates a climate condition of intermediate stage; 1 indicates a humid environment; and 2 indicates the most humid environment. The locations of sediment sites marked by the numbers 1-13 in this figure are given in Table 5. |
| 1 |
|
| 2 |
|
| 3 |
|
| 4 |
|
| 5 |
|
| 6 |
|
| 7 |
|
| 8 |
|
| 9 |
|
| 10 |
|
| 11 |
|
| 12 |
|
| 13 |
|
| 14 |
|
| 15 |
|
| 16 |
|
| 17 |
|
| 18 |
|
| 19 |
|
| 20 |
|
| 21 |
|
| 22 |
|
| 23 |
|
| 24 |
|
| 25 |
|
| 26 |
|
| 27 |
|
| 28 |
|
| 29 |
|
| 30 |
|
| 31 |
|
| 32 |
|
| 33 |
|
| 34 |
|
| 35 |
|
| 36 |
|
| 37 |
|
| 38 |
|
| 39 |
|
| 40 |
|
| 41 |
|
| 42 |
|
| 43 |
|
| 44 |
|
| 45 |
|
| 46 |
|
| 47 |
|
| 48 |
|
| 49 |
|
| 50 |
|
| 51 |
|
| 52 |
|
| 53 |
|
| 54 |
|
| 55 |
|
| 56 |
|
| 57 |
|
| 58 |
|
| 59 |
|
| 60 |
|
| 61 |
|
| 62 |
|
| 63 |
|
| 64 |
|
| 65 |
|
| 66 |
|
| 67 |
|
| 68 |
|
| 69 |
|
| 70 |
|
| 71 |
|
| 72 |
|
/
| 〈 |
|
〉 |