Research Articles

Impact of climate change on Tibet tourism based on tourism climate index

  • ZHONG Linsheng 1, 2, 3 ,
  • YU Hu , 1, 2 ,
  • ZENG Yuxi 1, 3
Expand
  • 1. Institute of Geographic Sciences and Natural Resources Research, CAS, Beijing 100101, China
  • 2. Key Laboratory of Regional Sustainable Development Modeling, CAS, Beijing 100101, China
  • 3. University of Chinese Academy of Sciences, Beijing 100049, China
Yu Hu (1986–), PhD and Associate Professor, specialized in geographical tourism. E-mail: .

Zhong Linsheng (1971–), PhD and Professor, specialized in ecotourism and geographical tourism, protected area management. E-mail: zhongls@igsnrr.ac.cn.

Received date: 2019-01-26

  Accepted date: 2018-03-25

  Online published: 2019-12-06

Supported by

National Key R&D Program of China, No(2017YFC0506401)

National Natural Science Foundation of China, No(41671527)

Copyright

Copyright reserved © 2019. Office of Journal of Geographical Sciences All articles published represent the opinions of the authors, and do not reflect the official policy of the Chinese Medical Association or the Editorial Board, unless this is clearly specified.

Abstract

Climate change is an important factor affecting the sustainable development of tourist destinations. Based on the monthly observation data of the main meteorological stations on the ground in Tibet from 1960 to 2015, this paper constructs a tourism climate index model. This index is used to quantitatively evaluate the tourism climate changes in Tibet, and investigate the impact of climate change on tourism. The results show that from 1960 to 2015, the temperature in Tibet increased by 1.35°C, and the tourism climate index changed significantly, especially in the regions of Changtang, Ngari and Kunlun Mountain. The fluctuation of temperature-humidity index, wind-chill index and index of clothing of these areas was larger than that of other regions. The changes of each index in different months are different, where spring observes larger changes while summer observes smaller changes. The tourism climate index in northwestern Tibet has increased, and the climate comfort period is expanding. In southeastern Tibet, the comfort level has declined and the comfort level in the central part has been slowly increasing. The comfort index in the southeastern part of Tibet has gradually declined, and the comfort index in central Tibet has slowly increased. According to the comprehensive assessment method including temperature and humidity index, wind-chill index, index of clothing and altitude adaptability index, the types of tourism climate index in Tibet can be divided into reduced, low-speed growth, medium-speed growth and rapid growth. Different regions should adopt alternative tourism products, strengthen energy conservation and emission reduction technology applications and green infrastructure construction, and appropriately control the scale of tourism activities so as to adapt to and mitigate the impact of climate change on tourist destinations.

Cite this article

ZHONG Linsheng , YU Hu , ZENG Yuxi . Impact of climate change on Tibet tourism based on tourism climate index[J]. Journal of Geographical Sciences, 2019 , 29(12) : 2085 -2100 . DOI: 10.1007/s11442-019-1706-y

1 Introduction

The effects of climate change can first be assessed through changes in physical conditions essential to tourism. Using climate indexes to measure the impact of climate change on the attractiveness of tourist destinations is very important for their sustainable development (Jaume, 2014; Scott et al., 2004). Like natural resources, climate resources are not only an important attraction and component of tourist destinations, but also the basic driving force for seasonal demand for tourism (Gŏssling et al., 2004). Together with other factors, it determines the appropriate location of a series of tourism activities, thus affecting the development of regional tourism. Any change in climate may create opportunities or threats to the development of tourism in natural tourist destinations (Scott et al., 2007; Susann et al., 2015). Nature-based tourism are considered as one of the most sensitive areas of global climate change impact (Christopher and Song, 2018; Dube and Nhamo, 2018). Climate change affects the quality or composition of tourism resources such as glacier landscape, biodiversity, rivers and lakes, and thus changing the structure and function of terrestrial ecosystems and affecting the sustainable development of tourist destinations (Zhong et al., 2011). Therefore, It is an important scientific proposition to build an analysis model of tourism climate index based on climate factors to study the impact of climate change on the development of tourist destinations and its adaptation strategies.
Assessment of tourism climate index is an important research entry point for studying the impact of climate change on tourism in natural destinations. For many tourist destinations, the climatic conditions are kinds of attractions. The climate change of tourist destinations directly affects the seasonality of tourism, the form of tourism products and the composition of tourism resources. The Mediterranean, the Alps, and the Hawaiian coastal regions are sensitive to the global climate change. In the Mediterranean region, the climate is the decisive factor for European tourists to consider. But with the impact of global climate change in recent years, Mediterranean summer vacations’ comfort level is reduced and the appeal of spring and autumn is rising. The Alps’ snowfall began to reduce in the 1980s. Around 2010, only 44% of ski resorts have enough natural snowfall. Many ski resorts have to move to higher altitude or use artificial snow. This leads to human body incompatibility caused by higher altitude and a significant increase in cost (Uhlmann et al., 2009). In coastal diving destinations, rising temperatures have led to a large number of coral bleaching or even death. It can be seen that the tourism climate index is an important indicator to determine whether tourists would travel to climate-sensitive destinations. Climate change has an important impact on people’s travel motivation, destination choice and travel time. For example, Perry’s research shows that the primary reason for 70%-80% of British tourists to travel abroad is “better weather” (Perry, 2011). Tourism climate index is the comprehensive representation of the impact of climate change on destination total factor, directly affecting the scale and structural changes of tourism flows. Thus the research on tourism climate index is essentially a set of climate variables combined by mathematical formulas to obtain human comfort preferences, so as to obtain development strategies that can meet the comfort level of tourism in the future.
The research content of tourism and climate change mainly includes index assessment and its relationship with tourist flow. Mieczkowski first applied the results of the climate index to tourism related activities by developing the tourism climate index (Mieczkowski, 1985). In the middle and late 20th century, Thom (1959) , Gonzalez et al. (1974) , and Defreitas (1979) laid the foundation for research on the impact of temperature and wind on tourism climate assessment. Mieczkowski (1985) proposed the assessment method of tourism climate index in 1985. Since 2000, Amelung et al. (2007) , and Kubokawa et al. (2014) have used the tourism climate index to predict changes in climate attractiveness. Hewer et al. (2016) and Jedd et al. (2018) tried to construct a correlation model between climate and tourist flows, and analyzed the impact of temperature changes on the scale of tourism flows. In the past few decades, many quantitative studies have attempted to evaluate the impact of climate change on tourism from the single-factor constructed climate comfort level assessment model, and divided the climate suitability of different types of tourist destinations (Liu et al., 2007; Liu et al., 2014), wherein the index used includes temperature-humidity index (THI), wind-chill index (WCI), and index of clothing (ICL). Some scholars also proposed the Beach Climate Index (BCI), Holiday Climate Index (HCI) and Modified Climate Index for Tourism (MCIT), which are based on climate index using common variables such as temperature, relative humidity, wind, sunshine, etc. Most of the impacts of tourism climate suitability are analyzed from a single climatic factor, but various indicators including altitude, ultraviolet radiation intensity, etc. that significantly affect climate index are not considered enough, and research from the perspective of total factor synthesis is insufficient. Moreover, after the above index assessment, there is a lack of targeted adaptation strategies from specific levels, and the guidance for practical development is still insufficient.
In view of this, based on the observation data of ground meteorological stations in Tibet from 1960 to 2015 and the physical geography of Tibet, this paper constructs a tourism climate index model in combination with temperature, humidity, wind, altitude and other factors so as to analyze the historical changes and trends. This paper also divides Tibet into different areas based on different tourism climate index level and proposed corresponding adaptation strategies to provide a scientific reference for the sustainable development of Tibetan tourism.

2 Methodology and data

2.1 Study area

Tibet, known as the third pole, is located in the southwestern part of the Qinghai-Tibet Plateau, with a total area of about 1,202,200 square kilometers, accounting for about 12.5% of China’s total land area. The Tibetan Plateau is high in the northwest and low in the southeast. The average elevation is above 4000 m, and the average temperature is significantly lower than other areas in the same latitude. The Tibetan Plateau mainly consists of seven eco-geographic regions. From southeastern Tibet to northwestern Tibet: HIB1, HIC2, HID1, HIID3, HIIC2, HIIAB1, and VA6 (Figure 1). In this direction, the climatic environment is affected by topography, landforms, and atmospheric circulation. The impact is significant and complex. The southeastern Tibetan valley is affected by the warm and humid air currents from the Indian Ocean. It is mild and rainy. The northwestern Tibetan Plateau is of a typical continental climate. From southeastern to northwestern Tibet, there are many climate types: tropical, subtropical, plateau temperate, plateau sub-frozen zone, plateau cold zone, etc., and as the altitude increases, the air pressure decreases, the air density decreases, and the oxygen content per cubic meter of air gradually decreases. This physical geographical feature determines the seasonality of tourism in Tibet. The best time for visiting Tibet is from June to September. Tibet is the main region of the third pole and is a sensitive region affected by climate change (Pan and Li, 1997). Global climate change characterized by climate warming has been affecting the development of tourism in Tibet. Tourism climate index is most affected by climate change, which will also directly affect Tibet’s economic growth. Therefore, studying the impact of climate change on the tourism climate index of the Tibetan Plateau is of great significance to the sustainable development of tourism and regional economic and social development in climate-sensitive areas.
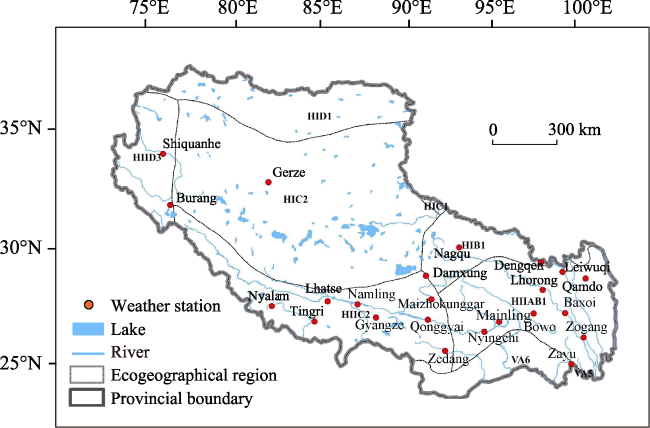
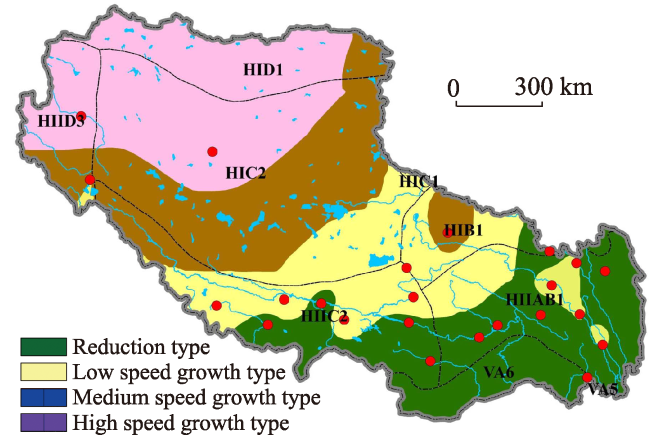
Figure 1 Location of the study area, meteorological stations

HIB1: The Golog and Nagqu Plateau mountain region with the alpine shrub meadow; HIC2: The Changtang Plateau with the alpine grassland; HID1: The Kunlun Mountain region with plateau alpine desert; HIID3: The Ali region with mountainous desert; HIIC2: The southern Tibet with the shrubbery in the high valleys; HIIAB1: The western Sichuan and eastern Tibet region with the high mountains and deep valley coniferous forest; VA6: The southern Himalayas region with the monsoon rainforest and evergreen broad-leaved forests

2.2 Method

The development of tourism climate index assessment method lies in the innovation and revision of tourism climate model, which mainly includes variable composition, coefficient weight and mathematical relationship adjustment. In terms of variable composition, temperature, precipitation, wind speed, sunshine, etc. are often adopted. The selection principle mainly considers the tourist’s somatosensory meaning and the index data’s availability. For example, Matzarakis (2014) proposed 12 types of variables at the beginning of designing TCI, but due to data acquisition restrictions, only 7 of them were finally selected for modeling. For the weight of the coefficient, the weight of the temperature variable is higher, and the precipitation has a “short-board effect” on tourism climate index. Tourists have a strong intuitive perception of precipitation and they are mainly negative perceptions. Therefore, precipitation is an important indicator of tourism climate risk assessment. The estimator of coefficient weight including experts, tourists, and operator, etc. is also one of the direction for model revision. The construction of mathematical relationships between variables mainly relies on experimental observations and empirical modeling and has gradually gained widespread use. For the selection of indicators, it is necessary to consider the commonly used indicators and the characteristics of the research objects. Different research activities or destinations focus on different indicators, for example: snow-coverage indicator is used in ski resorts; marine environmental, sunshine and solar radiation indicators are commonly used in 3S tourism sites. At the same time, we must also pay attention to the collinearity of common indicators, such as the collinearity between temperature and snow depth. Based on the previous research results, this paper takes into consideration the specialty of altitude in Tibet, which directly affects the temperature and oxygen content. Therefore, this paper integrates the altitude adaptability index and constructed a comprehensive assessment model of tourism climate index based on THI, WCI, ICL and AAI.
(1) Temperature-Humidity Index (THI): The heat exchange between the human body and the surrounding environment reflected by the combination of temperature and humidity is the first indicator of human perception to climate. The calculation formula is (Ma et al., 2008):
$THI=\left( 1.8\text{t}+32 \right)-0.55(1-f)(1.8t-26)$
where THI is the temperature-humidity index, t is the Celsius temperature (℃), and f is the relative humidity (%).
(2) Wind-chill index (WCI): It indicates the influence of wind speed and air temperature on bare human body in different environments. The physical meaning refers to the heat dissipation per unit area of the body surface when the temperature is 33℃. The calculation formula is:
$WCI=\left( 33-t \right)\left( 9.0+10.9\sqrt{V}\text{-}V \right)$
where WCI is the wind-chill index, t is the Celsius temperature (℃), and V is the wind speed (m/s).
(3) Index of clothing (ICL): It means that tourists change their clothes to adapt to climate change. The formula is:
$ICL=\frac{33\text{-}t}{0.155\text{H}}-\frac{\text{H}+a\text{Rcos}\alpha }{\left( 0.62+19.0\sqrt{V} \right)\text{H}}$
where t is Celsius temperature (℃), H is 75% of the human metabolic rate (W/m2), a is the absorption of solar radiation by the human body, 0.06; R is the solar radiation received by the land per vertical unit (W/m2); α indicates the solar elevation angle; V is the wind speed (m/s).
(4) Altitude Adaptation Index (AAI): As the altitude increases, the oxygen content of the air gradually decreases, and the body’s sensation at different altitudes also differs. When the altitude reaches 3000 m, the oxygen content of air is 77.1% of that in the plain area, and the human body begins to feel uncomfortable. When the altitude reaches 4000 m, the oxygen content of air is only 69.5% of that in the plain area, and the human body feels very uncomfortable. The calculation formula is:
$AAI=\left( 3000-i \right)/3000$
where i is the altitude of a certain place. Assuming that the highest peak of the Himalayas, Mount Everest, is the maximum height of 8844.43 m, the AAI score interval is about [-2, 1]. When i=3000, the AAI value is 0, indicating that the human body begins to enter the uncomfortable stage. Along with rise of altitude, the score becomes negative, and the degree of discomfort gradually increases; when i=0, the AAI value is 1, which is in a very comfortable stage.
(5) Tourism climate index: Based on the temperature-humidity index, wind-chill index, index of clothing and altitude adaptability index, and based on the existing research results, a comprehensive assessment model of tourism climate index (TCI) in Tibet was constructed. The calculation formula is:
$TCI=\left( 0.6{{X}_{THI}}+0.3{{X}_{\text{WCI}}}+0.1{{X}_{\text{ICL}}} \right)\times \text{AAI}$
where X is the graded value of three indexes of THI, WCI and ICL; 0.6, 0.3 and 0.1 are empirical weight coefficients.
Table 1 Classification criteria and assignment of THI, WCI, ICL and AAI (Ma et al., 2010)
Temperature-humidity index (THI) Wind-chill index (WCI) Index of clothing (ICL) Altitude adaptation index (AAI)
Classification Human body sensation Classification Human body sensation Classification Suitable clothing Oxygen content of air Human body sensation
< 40 Extremely cold and uncomfortable ≤ -1000 Extremely cold wind >2.5 Down coat or fur coat 0 m, 100% Very
comfortable
40-45 Cold and
uncomfortable
-800 to
-1000
Cold wind 1.8-2.5 Casual clothing plus coat 100 m, 99.2% Comfortable
45-55 Slightly cold and uncomfortable -600 to -800 Slightly cold wind 1.5-1.8 Casual winter clothing 1000 m, 92.4% Quite
comfortable
55-60 Cool and
comfortable
-300 to -600 Cool wind 1.3-1.5 Casual spring and autumn clothing 2000 m, 84.7% Generally comfortable
60-65 Cool and very comfortable -200 to -300 Comfortable wind 0.7-1.3 Shirt and casual clothing 3000 m, 77.1% Un-comfortable
65-70 Warm and
comfortable
-50 to 200 Warm wind 0.5-0.7 Light summer clothing 4000 m, 69.5% Very un- comfortable
70-75 Rather warm and comfortable +80 to -50 No sensible wind 0.3-0.5 Short sleeve and open collar shirt 5000 m, 61.8% Extremely un-comfortable
75-80 Sultry and
uncomfortable
+160 to +80 Hot wind 0.1-0.3 Tropical light clothing
> 80 Extremely sultry and uncomfortable ≥ +160 Uncomfortable wind < 0.1 Extremely light clothing

2.3 Data source

The administrative area data used in this paper comes from the national basic geographic information system. The meteorological data comes from the scientific sharing data of the main ground meteorological stations in Tibet released by China Meteorological Data Service Center. It includes the climate index data of nearly 60 years from 1960 to 2015. There are 23 ground meteorological stations in Tibet. The data categories include average temperature (0.1℃), average relative humidity (1%), sunshine hours (0.1 h/d), and average wind speed (0.1 m/s).

3 Result

Based on the monthly observation data from meteorological stations in Tibet, this paper analyzes the changes of climate elements and tourism climate index in Tibet in the past 55 years from 1960 to 2015, and then examines the trends of tourism climate environment in different ecological regions and adaptation strategies.

3.1 Analysis of climate change in Tibet

From 1960 to 2015, under the background of global warming, the annual average temperature in Tibet showed a generally slow growth trend. The average temperature in 1960 was 4.8℃, and in 2015 it reached 6.12℃, an increase of 1.35℃. The annual average relative humidity in each region showed a slow decreasing trend, and the trend of decreasing after 2004 was most significant. From the observation of a single ground station, the average temperature of the sites such as Lhorong, Zogong and Shiquanhe increased rather significantly, indicating that the temperature increase rates of Nagqu and Qamdo regions are larger than those of other regions. The relative humidity of Nyingchi, Zayu, Leiwuqi, Mainling and other southeastern Tibetan regions are relatively large, reaching above 60%. The relative humidity of Shiquan River, Lhatse and Gerze sites is relatively small, only 20%-30%. This is mainly due to the fact that the lower altitude and land cover type of the southeastern part of Tibet belongs to the monsoon forest and the evergreen broad-leaved forest. The air off the Indian Ocean makes the high vegetation coverage. Even in the hot season, the climate is still pleasant. Ngari belong to the plateau alpine desert. In these areas, the surface vegetation coverage is low, the light reflection is large, and the daytime temperature is relatively high and the air is relatively dry. The relative humidity is more sensitive to climate change. The relative humidity of Damxung, Tingri, Lhorong, Maizhokunggar, Namling and Zogong sites has dropped by more than 6% from 1960 to 2015 (Figure 2).
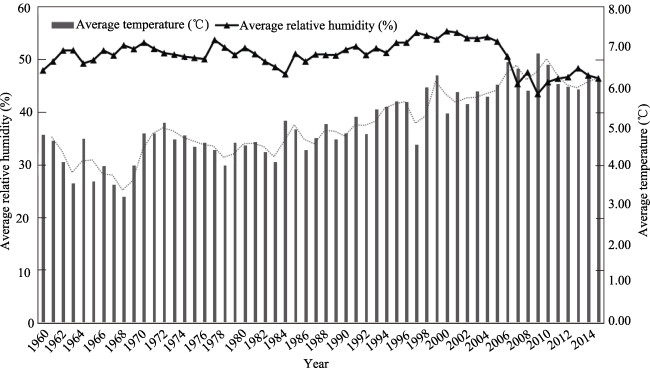
Figure 2 Change of average temperature and relative humidity from 1960 to 2015 in Tibet
Figure 3 shows the changes in January and July of 1960, 1990 and 2015. Overall, compared with 2015, the average temperature, average wind speed and average relative humidity in January 1960 were reduced. The three indicators varied by -1.51℃, -0.68 m/s and -2.75%. Compared with 1990, the average temperature and average wind speed in 2015 showed a growth trend of 0.56℃ and 0.34 m/s, and the average humidity decreased by -3.21%. The average temperature increase in July was 0.08℃. The average wind speed and average relative humidity ranged from -0.02 m/s and -4.0%. The average temperature change from 1990 to 2015 was -1.38℃, and the average wind speed and average relative humidity ranged from -0.27 m/s and -12.48%. Judging from the spatial differences in the changes in different regions, the average temperature of Burang, Nagqu, Bomê, Gerze and Dengqen decreased significantly in January, while the average wind speed of Nagqu, Burang, Gerze and Damxung decreased greatly. The average relative humidity of the Dingrim, Zayu, Qamdo and Shiquanhe decreased. In July, the temperature of Nagqu, Bomê, Dingri and Gyangze varied greatly. The average wind speed of Maizhokunggar, Namling and Mainling increased greatly. The average relative humidity of Qamdo, Gyangze, Lhatse, Maizhokunggar, Nagqu and Namling is reduced by a large margin. It can be seen that the climate change in the southern part of Tibet and the southeastern part of Tibet, especially along the Yarlung-Zangbo (Brahmaputra) Grand Canyon, is characterized by a downward trend in January and a significant growth trend in July.
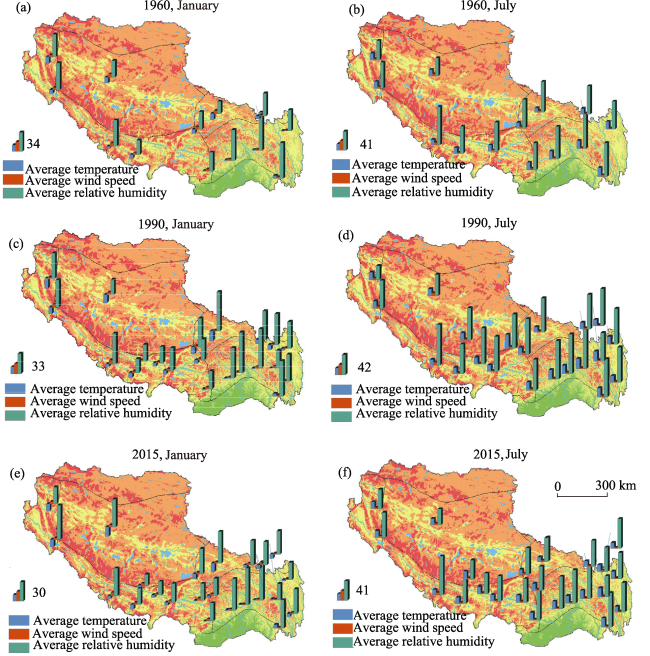
Figure 3 Changes in average temperature, average wind speed and average relative humidity in Tibet in January and July of 1960, 1990 and 2015

3.2 Analysis of the change of tourism climate index classification index

3.2.1 Timing analysis of classification index changesTable 2 shows the changes of the THI, WCI and ICL monthly and in every five years in the past 55 years in Tibet. It is known that (1) in the past 55 years, each year the three indexes have changed a lot. The THI index has increased from 45.99 in 1960 to 48.13. It is still in the colder and less comfortable range. The periodic trend can be divided into two phases at the year 2000. Before 2000, the temperature-humidity index fluctuated around 46. After 2000, the growth rate was relatively large. In 2005, it increased to 47.26, and in 2015 it reached 48.13, an increase of 2.14 than the year 1960. Although according to this paper’s assessment, this period is in the “cold, less comfortable” score interval, the growth is quite obvious. (2) The WCI index is relatively large and falls in the range of slightly cold wind, but this slightly cold feeling is decreasing. In 1960, the WCI index was -633.35, and in 2010 it became -537.01, and the changes of human body’s perception of the cold were more obvious. (3) The change of ICL index is relatively straightforward. It decreased from 1.95 in 1960 to 1.78 in 2015, indicating that the thickness of the dress is decreasing during the research period, and people’s clothing changed from casual wear plus thick coat to casual clothing in winter, which indirectly indicates that the temperature has been rising in the past 55 years in the Tibetan region.The seasonal characteristics of the THI, WCI and ICL in Tibet are obvious. From the three types of monthly indexes, the difference between the four seasons is large, and the difference among the three months in each season is small. During the research period, the average values of THI, WCI and ICL in spring were 36.83, 853.52 and 2.53, respectively, indicating that the human body feels extremely cold and extremely uncomfortable during the season, and needs to wear very thick down coat or fur coat; the average value of the three indexes in summer were 46.58, 704.37 and 1.91, and the human body feels cold and less comfortable and need to wear casual clothing plus a thick coat; the average value of the three indexes in autumn were 56.62, 455.76 and 1.29, and the human body feels cool and comfortable and casual clothing in spring and autumn is good enough. The average values of the three indexes in winter were 46.86, 610.07 and 1.84 respectively. The human body feels cold and uncomfortable and needs to wear casual clothing plus coat.
Table 2 Changes of THI, WCI and ICL in Tibet
Year 1960 1965 1970 1975 1980 1985 1990 1995 2000 2005 2010 2015
THI 45.99 44.79 46.09 45.96 45.68 46.29 46.06 46.79 46.30 47.26 48.77 48.13
-WCI 633.35 751.62 806.65 701.05 652.10 645.99 632.68 595.30 582.87 752.03 537.01 591.61
ICL 1.95 2.03 1.96 1.98 1.96 1.93 1.93 1.87 1.88 1.87 1.79 1.78
Month Dec Jan Feb Mar Apr May Jun Jul Aug Sept Oct Nov
THI 36.51 35.57 38.41 42.24 46.29 51.2 55.95 57.32 56.28 53.26 46.73 40.59
-WCI 795.89 878.68 886.00 811.52 705.67 595.93 486.41 438.17 442.7 492.16 618.46 719.59
ICL 2.51 2.62 2.47 2.20 1.92 1.60 1.33 1.25 1.30 1.45 1.83 2.24
From the trends of three indexes in December, January, June and July from 1960 to 2015 (Figure 4), THI shows a small difference in June and July in summer, which is less than one order of magnitude. However, in winter, the difference between December and January reached two orders of magnitude. The climate change had a greater impact on June and July in summer, accounting for a change of 2.25. The WCI index is gradually increasing, and the difference between the months is large, and the difference in human body perception in winter is especially large. In general, the human body feels that the wind-chill is decreasing. The ICL index showed a gradually decreasing trend in general, and there were three periods of changes in the middle. From 1960 to 1965, the WCI index increased significantly. The indexes in December and January increased from 1.97 and 2.54 to 2.64 and 2.7 respectively. In June and July, they increased from 1.09 and 0.58 to 1.42 and 1.35 respectively. Then, in 1990, there was a slight fluctuation. The indexes for winter and summer were maintained at around 2.62 and 1.33 respectively. After 1990, they showed a significant decrease. The average WCI index for the two seasons was reduced to 2.52 and 1.24, respectively.
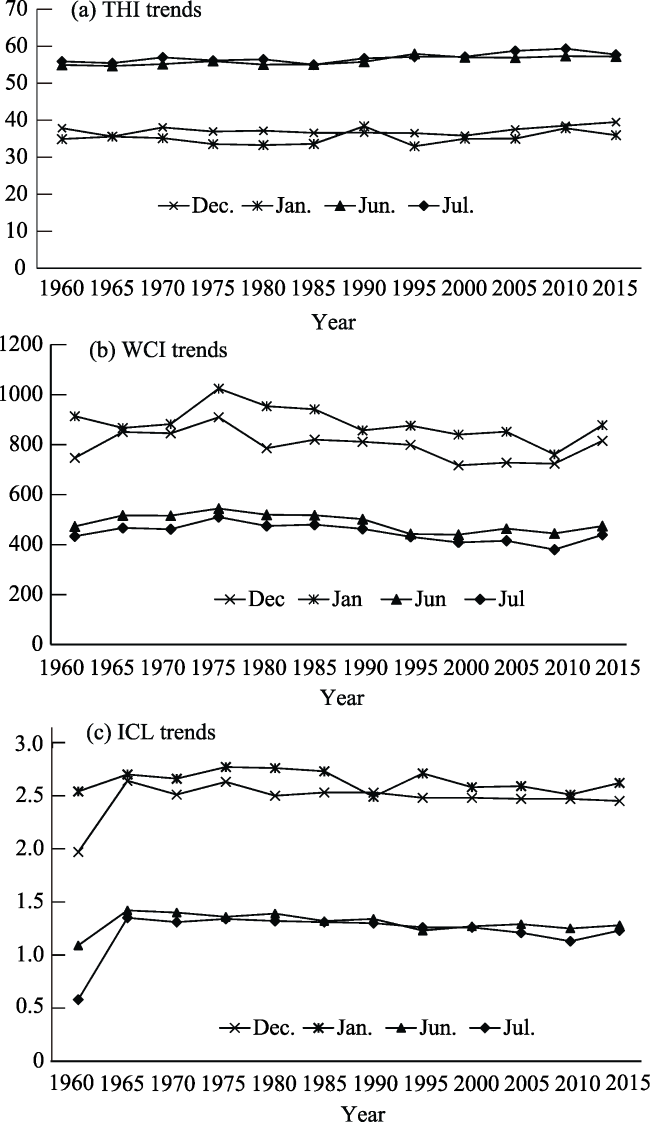
Figure 4 Trends of three indexes in December, January, June and July of 1960-2015
3.2.2 Spatial difference analysis of indexes
Climate change constantly affects tourism climate index. This paper calculates the average and change values of the three indexes of Tibet meteorological stations at two time points in 1960 and 2015, and then uses Kriging method to conduct spatial fitting to obtain the spatial distribution characteristics and trends of THI, WCI and ICL (Figure 5). It can be seen that the three indexes have obvious spatial concentration characteristics and are closely related to the physical ecogeographical environment. Tibet’s northern region is a typical continental climate with distinct seasons and a half-year frozen period. The southern Tibetan valley is affected by the warm and humid air currents of the Indian Ocean, thus mild and rainy. The THI, WCL and ICL indexes of the three ecological regions of the HIC2, HID1 and HIID3 all indicate that the human body feels uncomfortable. The VA6 is a typical southern Tibetan valley. The three indexes of the VA6 are in the comfort range. The regions of HIB1, HIIC2 and HIIAB1 belong to the middle zone. The three types of index in these regions are between those of the former two areas, indicating generally comfort level; the difference of the above physical geographical environment also affects the changes in the three indexes. The HIC2, HID1 and HIID3 are the regions with the greatest changes in THI, WCL and ICL. The climate warming directly causes the temperature rise in these three regions, and the comfort level is improved, but it still falls in the cold and uncomfortable range. The temperature-humidity index in the HIIC2 region changed greatly, and the wind-chill index and the index of clothing changed little, and the comfort level was still high.
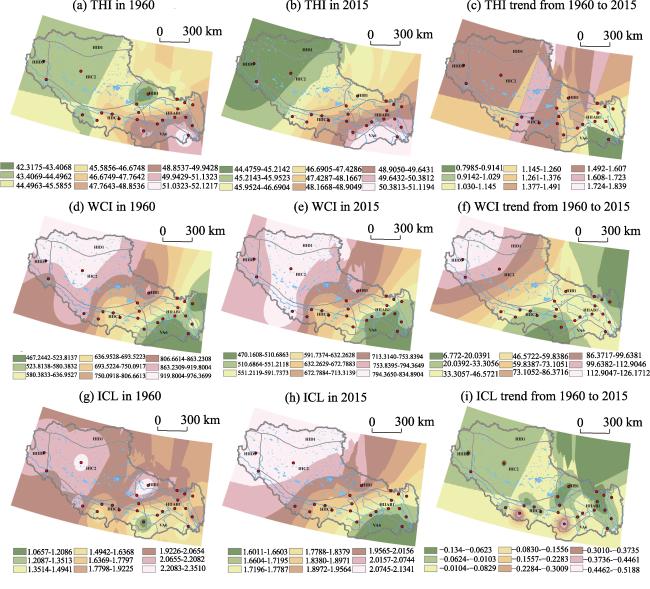
Figure 5 The spatial characteristic and trend of THI, WCI and ICL

3.3 Analysis of the types of tourism climate index changes

According to formula (5), the scores of Tibet tourism climate index in 1960 and 2015 are calculated respectively, and then the difference between the two time nodes is taken as the variable, Kriging and spatial clustering methods are used to divide them into four types (Figure 6). A negative difference indicates that the tourism climate suitability is in reduction, while positive difference indicates that the climate suitability is increasing. The increasing type is further divided into three different sub-types by spatial clustering: low speed growth, medium speed growth and rapid growth. From the spatial distribution of these four types of changes, the overall trend of tourism climate index is increasing from east to west. The medium-speed growth type and the low-speed growth type are partially crossed in the next-level type. From the different types, the tourism climate index of the southeastern Tibet, northwestern Tibet and southern Tibet where Nyingchi, Qamdo and Lhoka cities are located is generally reduced, mainly in the VA6, HIIAB1 and the southern part of HIIC2. Leiwuqi, Lhorong, Baxoi and Zogong counties along the Nujiang River in Qamdo city showed a low growth rate. The low-speed growth area is mainly in the HIB1, the northern part of HIIC2 and the eastern part of HIC2. The medium-speed growth area is concentrated in the central part of HIC2. The rapid growth area is mainly in the northern part of HIC2, HIID3 and HID1. In comparison, it can be seen that the latitude factors related to temperature changes exert significant influence. From central Tibet to the high mountain desert areas in northwestern Tibet, with the increase of latitude, the temperature increase significantly in the desert in the northwestern Tibetan Plateau. The southeastern Tibetan valley is originally relatively hot, and the temperature change has reduced the climate suitability.
Figure 6 The trend types of tourism climate index in Tibet

4 Adaptation strategy of tourism development to climate change in Tibet

For Tibet, high altitude and cold weather are important constraints to the development of tourism. Global warming has improved the climate suitability of alpine regions to a certain extent, and also has an impact on the evolution direction of natural ecosystems. From 1960 to 2015, the climate in Tibet has a clear warming trend, which has led to different degrees of change in tourism climate comfort in most areas. The climate comfort of high-altitude and alpine regions has been improved, while the temperature increase in low-altitude subtropical forests in southeastern Tibet has obviously shortened the tourist season and the tourism climate index has declined. The climate comfort of the northern part of the shrubland in the high valley of southern Tibet, the alpine shrub by meadow area of the Golog Nagqu Plateau and the eastern part of the alpine grassland of the Changtang Plateau showed a low growth rate. The climate index of the central part of the alpine steppe region of the Changtang Plateau increased at a moderate rate. The climate index of the northern part of the alpine grassland area of the Changtang Plateau, the Alishan desert area and the Kunlun Mountain Plateau alpine desert area increased rapidly. In the context of this global climate change, regions with different types of tourism climate index growth rates should adjust the corresponding tourism development mode to adapt to the impact of climate change on tourism resources and environment. Therefore, in the future, we should focus on climate change and tourism resource ecological monitoring, tourism products and industrial system planning, time-sharing and regional regulation, and ecological low-carbon development, and adapt to global warming from development measures.
(1) Monitoring ecological resources of key areas and sensitive areas for grasping the change trends of tourism resources effectively. Make full use of digital monitoring technology to observe the dynamic changes of sensitive scenic spots such as glaciers, snow mountains, deserts and forests, integrate regional resources and environmental data, establish tourism environment information systems and conduct dynamic analysis for real-time monitoring and analysis. The increase in temperature will increase the number of seasonal tourists in the alpine region, which will lead to the destruction and degradation of tourism resources and the environment. In response to these affected tourism resources and environment, technical measures should be taken in time for targeted restoration.
(2) Tourism product development strategies to climate change need to be adapted according to the characteristics of different regions. The increase in temperature directly leads to an increase in the body’s thermal sensation and changes in precipitation. In the southeastern Tibet, northwestern Tibet and southern Tibet forest gorges where the tourism climate index declines, ecotourism projects such as hiking and crossing forest should be added in appropriate seasons. Reducing the construction of large-scale facilities was needed in order to decrease the tourism carbon emissions. Changes in precipitation caused by climate change in the areas of the Nagqu Plateau, the Changtang Plateau, the Ali Mountain and the Kunlun Mountain Plateau affect the overall evolution of grassland, desert, lake and other sensitive ecosystems in these areas and their associated habitat and migratory routes of wild animal populations. In the process of developing tourism in these areas, it is necessary to pay attention to monitoring the change in tourism ecosystems and landscape, and to carry out low-intensity tourism activities such as wildlife sightseeing and natural landscape photography within a reasonable range of tourism capacity. In addition, it is necessary to rationally control the types of tourism projects within the nature protection zone. For example, in the tourist season, the reservation system should be used to control the scale of tourists to prevent concentrated pressure on the eco-environment. On the basis of the above specific measures, the staged tourism carbon emission control targets for the next 10, 20 or even 50 years should be proposed.
(3) The development model of Tibet should transfer from mass tourism to ecotourism. Climate change has affected the evolution of natural ecosystems in most parts of northwestern Tibet, including glacial melting, grassland degradation, and precipitation changes. These directly lead to changes in the boundaries of traditional animal husbandry production and significant changes in the natural landscape. For example, in the past 100 years, the grazing area of the Changtang Plateau has moved nearly 100 kilometers to the north. The competition for grassland migration will inevitably lead to changes in human and animal conflicts and living space of wild animals, which are affecting the development trend of ecotourism. If the mass tourism development model is adopted, development methods such as high-density construction, and scale expansion will inevitably further increase the pressure on the natural environment brought about by the entry of tourists, and contradict the development concept of nature conservation sites. Therefore, under the current background of China’s ecological civilization construction, we should develop large-area protection with small density, carry out environmental education, scientific research and other high-quality, brand-based public ecological products, and effectively coordinate the relationship among tradition production method, tourism activities and natural ecosystems.
(4) Tourism resources utilization should abide by the principle of exerting the lowest impact on environment. Tourism service facilities construction should use preferentially local materials, and actively promote the ecological infrastructure, such human landscapes harmonious with nature, ecological toilets and parking lots. Encouraging tourists to adopt low-carbon vehicles, use green and daily necessities, and carry environmentally-friendly luggage for reducing the negative impacts of tourism carbon emissions.

5 Conclusion and Implication

The paper constructs a multi-criteria comprehensive tourism climate index model, evaluates the Tibet tourism climate comfort level, conducts trend simulation, and focuses on the analysis of the temporal and spatial evolution. The following conclusions and implications were obtained:
(1) The comprehensive model of tourism climate index constructed in this paper has achieved outcomes. Adding the elements of altitude can better represent the tourism climate resources in various regions of Tibet, and can assess the impact of climate change on tourism. Climate change affects tourism climate conditions and is closely related to the natural geographical environment. Due to the large area of Tibet and the obvious ecological and geographical features, the impacts of climate change on natural ecological areas are significantly different, and are constantly affecting the development of tourism in Tibet (Du et al., 2016). Tibet has a vast land area and contains multiple eco-geographic regions. The impact of climate change on the evolution of different ecosystems is affecting the constitutive relationship between tourism elements and resources to varying degrees. From 1960 to 2015, the average annual temperature increase in Tibet was about 1.35°C, and the relative humidity increased by an average of 1.5 percentage points. This climate change mainly impacts the alpine plateau and desert areas in northwestern Tibet, including the Changtang and Ali region. The temperature rise accelerates the melting of glaciers, and the snow line and the frozen layer also rise, which has a direct impact on the tourism landscapes such as plateau glaciers and lakes. At the same time, the impact on the desert ecosystem in Ali is mainly reflected in that the air is dryer, temperature difference is larger, and the body adaptability is affected. In southeastern Tibet, although the climate warming makes the changes of annual average temperature and relative humidity of the region more obvious, the results of these changes are still in an acceptable range for human body.
(2) The tourism climate index in Tibet is generally on the rise, and the annual average suitability is gradually increasing. The suitable number of days is gradually increasing in summer and extending to spring and autumn. The suitability of winter does not change much and remains low. Tourism climate suitability in northwestern and northeastern Tibet increased the most, followed by southeastern Tibet. The space of high and sub-high suitability gradually extends from the east to the west, which is most obvious in summer. The spatial difference of climate suitability is shrinking. From 1960 to 2015, the rise in annual average temperature and the decrease of humidity in Tibet have certain effects on the temperature-humidity index, the wind-chill index and the index of clothing. The most obvious are observed in desert ecological areas of the Changtang Plateau and the Ali region. Increased humidity during the summer tourist season will help to improve tourism comfort level, but it is related to the frequency of local precipitation. According to the calculation results of the change of tourism climate index, its changes in Tibet can be divided into four types: reduced, low-speed growth, medium-speed growth and rapid growth. The classification of these types of areas is generally in accordance with the temperature rise. Except for the reduction of index level in the southeastern Tibetan valley, the index is increasing from central to northwestern Tibet.
(3) The effects of global warming on long-term tourism in Tibet are both negative and positive. Due to the sensitivity and vulnerability of tourism to climate and environment, tourism development must not only contribute to mitigating climate change, but also continuously adapt to climate change. Climate change has a positive impact on the off-season tourism in Tibet (Yu et al., 2014). It can prolong the period of Tibet’s tourism season. For regions susceptible and sensitive to climate change, such as the Ali region and the southeastern Tibet, strongly adaptive and substitutive tourism products should be developed. Rational planning and protection of glacial landscapes and tropical rainforests, strengthening the development and protection of sensitive resources such as lake and wetlands, and actively developing ecotourism are also necessary. The number of tourists shall be controlled within a reasonable environmental carrying capacity, and tourists’ activities should be well managed to reduce so as to lower the negative impact on natural landscape resources. At the same time, it is necessary to strengthen the application of Tibet’s energy-saving and emission reduction technologies, strengthen the construction of green infrastructure and service facilities, thus increasing the ability to mitigate or adapt to climate change.
(4) The spatial distribution of data from ground meteorological stations is uneven. There are a large number of meteorological stations in the Nyingchi area in southeastern Tibet and the Qamdo area in northeastern Tibet, while there are few meteorological stations in the northwestern and central areas of Tibet, which will result in the inaccuracy of the analysis in this paper. Future research will optimize the data source of the meteorological stations.
1
Amelung B, Nicholls S, Viner D , 2007. Implication of global climate change for tourism flows and seasonality. Journal of Travel Research, 45(5):285-296.

DOI

2
Christopher A C, Song F , 2018. A temporal and spatial analysis of climate change, weather events, and tourism businesses. Tourism Management, 67(2):351-361.

DOI

3
Defreitas C R , 1979. Human climates of northern China. Atmospheric Environment, 13(1):71-77.

DOI PMID

4
Du J, Ma P F, Pan D , 2016. Spatial-temporal change of air temperature at 02, 08, 14 and 20 Beijing time over Tibet during 1981-2014. Acta Geographica Sinica, 71(3):422-432. (in Chinese)

DOI

5
Dube K, Nhamo G , 2018. Climate variability, change and potential impacts on tourism: Evidence from the Zambian side of the Victoria Falls. Environmental Science & Policy, 84(3):113-123.

DOI PMID

6
Gonzalez R, Nishi Y, Gagge A , 1974. Experimental evaluation of standard effective temperature: A new biometeorological index of man’s thermal discomfort. International Journal of Biometeorology, 18(1):1-15.

DOI PMID

7
Gŏssling S, Hall C M , 2005. Tourism and Global Environmental Change: Ecological, Social, Economic and Political Interrelationships. London:Routledge.

8
Hewer M, Scott D, Fenech A , 2016. Seasonal weather sensitivity, temperature thresholds, and climate change impacts for park visitation. Tourism Geographies, 18(3):297-321.

DOI

9
Jaume R N , 2014. How to evaluate the effects of climate change on tourism. Tourism Management, 42:334-340.

DOI

10
Jedd T M, Michael J, Carrillo C M et al., 2018. Measuring park visitation vulnerability to climate extremes in U.S. Rockies national parks tourism. Tourism Geographies, 20(2):224-249.

DOI

11
Kubokawa H, Inoue T, Satoh M , 2014. Evaluation of the tourism climate index over Japan in a future climate using a statistical downscaling method. Journal of the Meteorological Society of Japan, 92(1):37-54.

DOI

12
Liu Q C, Wang Z, Xu S Y , 2007. Climate suitability index for city tourism in China. Resources Science, 29(1):133-141. (in Chinese)

13
Liu S J, Zhang J H, Wu S A et al., 2014. Possible impact of global climate changes on climate comfort degree and tourist flows in Hainan Island. Journal of Tropical Meteorology, 30(5):977-982. (in Chinese)

14
Ma L J, Sun G N, Li F F et al., 2008. Correlative analysis of climate comfort and monthly variation of tourists in Haikou city. Resources Science, 30(11):1754-1759. (in Chinese)

15
Ma L J, Sun G N, Xie Y F et al., 2010. A study on variations of the tourism climate comfort degree in five typical cities in eastern China during the last 50 years. Resources Science, 32(10):1963-1970. (in Chinese)

16
Matzarakis A , 2014. Transfer of climate data for tourism applications: The Climate-Tourism/Transfer- Information-Scheme. Sustainable Environment Research, 24:273-280.

17
Mieczkowski Z , 1985. The tourism climatic index: A method of evaluating world climates for tourism. The Canadian Geographer, 29:220-233.

DOI

18
Pan B T, Li J J , 1997. Qinghai-Tibetan Plateau: A driver and amplifier of the global climate change: The effects of the uplift of Qinghai-Tibetan Plateau on climatic changes. Journal of Lanzhou University (Natural Sciences), 32(1):108-115. (in Chinese)

19
Perry J , 2011. World heritage hot spots: A global model identifies the 16 natural heritage properties on the world heritage list most at risk from climate change. International Journal of Heritage Studies, 17(5):426-441.

DOI

20
Scott D, Jones B, Konopek J , 2007. Implications of climate and environmental change for nature-based tourism in the Canadian Rocky Mountains: A case study of Waterton lakes national park. Tourism Management, 28(2):570-579.

DOI

21
Scott D, Mcboyle G, Schwartzentruber M , 2004. Climate change and the distribution of climatic resources for tourism in North America. Climate Research, 27(2):105-117.

DOI

22
Susann B, Christian Z, Jordy H , 2015. Developing climate change maps for tourism: essential information or awareness raising? Journal of Travel Research, 54(4):430-441.

DOI PMID

23
Thom E C , 1959. The discomfort index. Weatherwise, 12(2):57-60.

DOI PMID

24
Uhlmann B, Goyette S, Beniston M , 2009. Sensitivity analysis of snow patterns in Swiss ski resorts to shifts in temperature, precipitation and humidity under conditions of climate change. International Journal of Climatology, 29(8):1048-1055.

DOI

25
Yu Z K, Sun G N, Feng Q et al., 2014. Tourism climate comfort and risk for the Qinghai-Tibet Plateau. Resources Science, 36(11):2327-2336. (in Chinese)

PMID

26
Zhong L S, Tang C C, Cheng S K , 2011. The impact of global climate change on tourism industry in China and adaptive strategies. China Soft Science, ( 2):34-41. (in Chinese)

Outlines

/