Research Articles

Spatial distribution characteristics of national protected areas in China

  • XU Baicui ,
  • PAN Jinghu
Expand
  • College of Geography and Environmental Science of Northwest Normal University, Lanzhou 730070, China
Pan Jinghu, PhD and Professor, E-mail:

Xu Baicui, PhD Candidate, specialized in spatial economic analysis. E-mail: xubcnwnu@163.com

Received date: 2018-04-09

  Accepted date: 2018-09-17

  Online published: 2019-12-06

Supported by

National Natural Science Foundation of China, No(41661025)

Scientific Research Foundation for Universities of Gansu Province, No(2016A-001)

Research Capacity Promotion Program for Young Teachers of Northwest Normal University, No(NWNU-LKQN-16-7)

Copyright

Copyright reserved © 2019. Office of Journal of Geographical Sciences All articles published represent the opinions of the authors, and do not reflect the official policy of the Chinese Medical Association or the Editorial Board, unless this is clearly specified.

Abstract

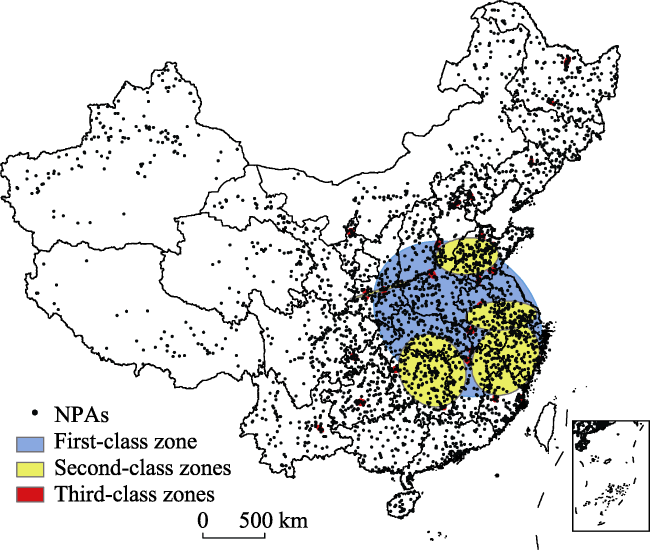
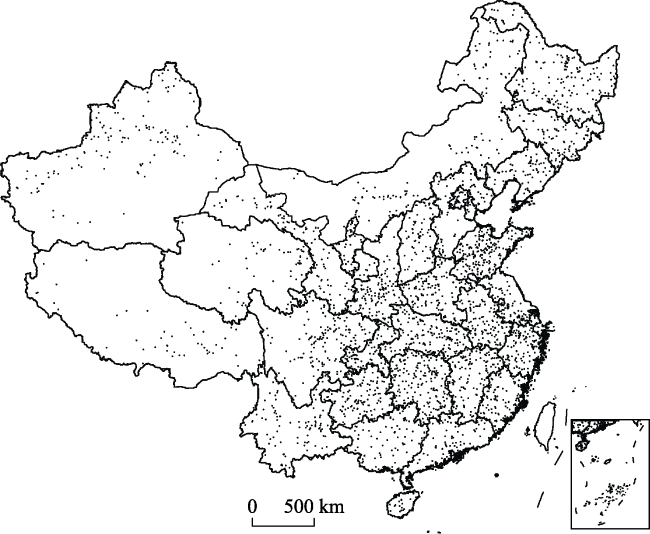
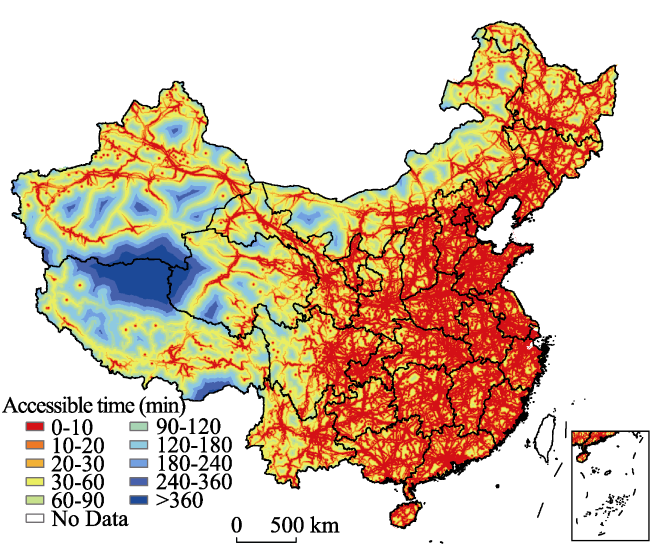
This paper investigated spatial structures of 3418 national protected areas (NPAs) grouped into 13 types using GIS and quantitative analysis, including point patterns, Ripley’s K function, hotspot clustering, quadrat analysis, and Gini coefficient. Spatial accessibility was calculated for all NPAs from matrix raster data using cost weighted distance on the ArcGIS platform. The results are as follows: (1) The NNI of NPAs is 0.515, Gini is 0.073, all of which indicates distribution was shown to be a spatially dependent agglomeration, and more balanced in the provinces. The national key parks and the national water conservancy scenic spots had present the strongest aggregation, with NNI of 0.563 and 0.561 respectively, and K index indicates reducing aggregation when distance exceeds 600 km. (2) The national forest parks account for the largest proportion of 22.87% of all NPAs, and the world biosphere reserves the least of 0.77%. The number of NPAs in Shandong with 240 had been the largest one in all the provinces, while Tianjin had the least number including 9 NPAs. (3) There is only one hot spot in the first-class zone, 5 in the second-class zones, and 51 in the third-class zones, which indicates NPAs are also aggregated at microscopic scales. (4) The hotspot NPA regions were mainly concentrated in the middle and lower reaches of the Yellow and Yangtze rivers, east of 100°E. High density of NPAs were generally in flat, water-rich, broad-leaved forest dominated plains and low mountain areas, with fertile soil, pleasant weather, long cultural history, and high transportation accessibility. (5) Average NPA accessible time is 60.05 min, with 70.76% regions being within 60 min, and the furthest was 777 min. The distribution of accessibility was positively related to the traffic lines. Interdepartmental protectionism has meant the various departments developed different management systems, standards, and technical specifications.

Cite this article

XU Baicui , PAN Jinghu . Spatial distribution characteristics of national protected areas in China[J]. Journal of Geographical Sciences, 2019 , 29(12) : 2047 -2068 . DOI: 10.1007/s11442-019-1704-0

1 Introduction

The national park concept originated in the United States (US) and is a combination of natural conservation, demand for a wilderness experience, and development of social democracy. The first national park established was Yellowstone National Park in 1872 (Boyce et al., 2016). The concept subsequently spread as national image around the world, with relevant studies developing gradually over the next 100 years or more. National parks also provide natural laboratories and locations for developing ecological baselines to compare data from more disturbed areas (Runge et al., 2015). Their establishment not only contributes to ecological protection but also to the larger quality of life issues that affect surrounding environment and can contribute significantly to general environmental health (Staiff et al., 2004; Fancy et al., 2009). China has vigorously established and developed national park characteristics, but the State Council and related authorities did not apply a specific “National Park” naming system (Wang et al., 2011). The national protected area (NPA) refers to a certain area which was designated according to the law for special protection and management areas of the land, inland waters or sea areas where the natural ecosystem, rare or endangered species are concentrated. National park is a large natural area with abundant natural resources (some also include historical relics) where hunting, mining and other resource consuming activities are prohibited. The national park system refers to lands or waters managed by departments concerned, including national parks, monuments, historical sites, scenic roads, leisure places, etc. NPA, national park and national park system are three concepts related to each other. All kinds of NPAs in China are the important areas that reflect the highest level of ecological protection in the country, the major foundation for the construction of national park system in China. National park is a constant platform for promoting natural protection during the development. One of the major measures of ensuring the safety of China’s land ecosystem is to construct a national park system. Sorting different modes of NPAs, which are important basis to Chinese national parks, is beneficial to the rational distribution of national park system. It is noteworthy that, the construction of national park is neither carried out in isolation nor completely replaces the original NPAs, but takes this opportunity to formulate standards for China’s national parks and other NPAs, and to classify and comb the existing NPAs in accordance with the unified standards and frameworks, so as to establish a national park system of China.
NPA is a necessary basis to construct the national park system, include very many individual regions with complicated contents. NPAs are defined, implemented and managed by countries to effectively protect biodiversity (Geldmann et al., 2013). The International Union for Conservation of Nature (IUCN) classification criteria divides NPAs into different types, including natural reserves, wilderness protected regions, national parks, natural historical sites or landforms, habitats or species management regions, land or marine landscapes, reserves of sustainable natural resources, etc. (Wells, 2009). Under this classification system, most Chinese NPAs constitute strictly protected natural reserves. The IUCN classification system also includes scenic spots; forest, wetland, and geological parks; and national nature reserves as NPAs (Gordon et al., 2018). Many protected areas already incorporate biodiversity, conservation, and visitor reception, hence are effectively national nature reserves under IUCN. China has also explored the relevant construction of national parks, establishing the National Scenic Spots in the 1980s, and many types of NPAs subsequently (Wang et al., 2012). The Third Plenary Session of the Eighteen Central Committee of the CPC, strongly promoted the construction of a national park system: “we should unswervingly establish a system for developing and protecting China’s geographical space and implement the system for main functional region, and establish the National Park System and promote its development in strict accordance with the main functional areas.” Subsequently, Xi Jinping, the General Secretary of the CPC has pointed out that the construction of ecological civilization is a thousand-year plan for the sustainable development of the Chinese nation. It is also a political promise to building a beautiful China and realize the great rejuvenation of the Chinese nation (Zhou et al., 2011). Establishment of a national park system was proposed at the Third Plenary Session in 2013, and the central leading group for comprehensively deepening reform founded a national park pilot system in the Three-River Headwaters region of Qinghai province in 2015, a significant step toward construction of a China-wide national park system. Establishment of the national park system pilot program was later proposed by the National Development and Reform Commission. However, a Chinese national park system has still not been established due to the lack of standardized and unified systematic nomenclature and legislative systems, and the current national park system has decentralized distribution and governance (Perpinyà et al., 2017). And, multiple NPA management and construction systems promote overlap and spatial distribution conflicts, increasing resource protection costs and exacerbating the difficulty of unified coordination (Li et al., 2016). NPAs form an important basis for national park system construction in China, and provide a mechanism to solve contradictions between natural protection and economic development. They also provide an ecological security baseline to sustain socio-economic development and ecological land protection, promoting ecological civilization development in China (Peng et al., 2018; Zhang et al., 2017).
The long survey of progress towards the construction of national park system revealed that the whole process was not always smooth, even the pioneers of the United States and Canada have made serious mistakes in the early period. There are inevitable questions about China’s national park system when it is in the primary stage of construction. But exist a lot of NPAs - the embryonic form of national parks can provide experience and lessons to avoid making the same mistakes in the construction of national park system. The national park system accomplished now will benefit our future generations and ecological land protection, so we have the aid of the opportune of the construction of ecological civilization to study the NPA as an opportunity, to comb the current management status of NPAs, to integrate and perfect the protection system, to accelerate the construction of the ecological civilization system, to promote the effective protection and sustainable development of the natural ecological system and historical and cultural relics. In addition, one of the major measures of ensuring the safety of China’s land ecosystem is to construct a national park system. Compared with various NPAs which develop for aesthetic experience, protection, and tourism, the strategic position of large-scale ecological processes and ecosystem protection is much higher as well as the responsibilities of the times, nicely, the overall pectination of the NPAs is an important foundation for the construction of the national park system in China. At the national scale, the analysis of the spatial distribution characteristics of the NPAs can provide a scientific basis for the space direction constructed of the national park system in China. The outcomes will have great significance, not only to arrange protected area spatial structures, but also to reflect problems such as protection costs, resource utilization, and management efficiency. In particular, this study provides a reference for spatial distribution and selection of regions for China’s national park system (Zhou et al., 2011). Previous studies have largely focused on specific areas, and the few national-level studies have focused on overall policy, legal system, or international experience, rather than spatial perspectives. The studies have concentrated on national wetland parks (Duan et al., 2017), forest parks (Luo et al., 2016), scenic spots (Notar, 2010), geological parks (Wang et al., 2014), nature areas (Liu, 2008), water recreation areas (Qiu et al., 2009); and A-grade tourist attractions (Pan et al., 2015), only occasionally comparing distribution characteristics of national parks. The methods mainly included rank methods, spatial autocorrelation, point pattern analysis, hot clustering, and fractal methods, but rarely combined natural and cultural regionalization with NPAs.
This study aimed at the following objectives: (1) to investigate the spatial structure, spatial distribution characteristics and accessibility of NPAs in China; (2) to explore the affecting factors of the geographical distribution of NPAs in China; and (3) to draw inspiration on the construction of national parks system in China. The contributions of this study are summarized as follows: the current study combined multiple viewpoints, methods, factors, and previous outcomes, to analyze the spatial distribution of 3418 NPAs across China, probing the influence of natural and cultural features. The results provide a reference for national park location and type across China, a scientific basis for the space direction constructed of the national park system in China. Since the researches on various NPAs are mainly focused on the micro level of the single type, the macro scale is mainly focused on the experience of foreign management, but, it is rare to analyze the spatial distribution characteristics of the existing NPAs in China. Using the spatial analysis of GIS, this study explored the spatial distribution, the pattern, the aggregation of NPAs, and the relationship between distribution and natural and cultural zoning. The pectination of the spatial pattern of NPAs is a significant foundation for the construction of the national park system. The study can clarify the present situation of NPAs from a geographical perspective and reveal its spatial pattern, it can not only reflect the existing space structure, but also reflect the corresponding protection cost, resource utilization and management efficiency, and provide a scientific basis for the space selection direction constructed by the national park system.

2 Data and analysis methods

2.1 Data sources

NPAs can be approved by appropriate state or provincial departments. Therefore, data was sourced from various websites or documents from China Ministry of Housing and Urban-Rural Development, Tourism Administration, Forestry Administration, Ministry of Land and Resources, Ministry of Water Resources, Ministry of Environmental Protection, and State Oceanic Administration (Table 1). At the end of 2016, there were 3612 NPAs in China, comprising 52 national urban wetland parks, 240 national geological parks, 42 national ocean parks, 227 national scenic spots, 447 national nature reserves, 67 national archaeological site parks, 72 national mine parks, 826 national forest parks, 55 national desert parks, 706 national wetland parks, 781 national water recreation areas, 69 national key parks, and 28 world biosphere reserves. The areas of national nature reserve were approved by the State Bureau of Statistics (http://data.stats.gov.cn/).
Table 1 The departments of examination and approval and official website of NPAs in 2016
Categories of NPAs Departments of examination and approval Official website
National urban wetland parks Ministry of Housing and Urban-Rural Development of the People’s Republic of China http://www.mohurd.gov.cn/zxydt
National geological parks Ministry of Natural Resources of the People’s Republic of China http://www.mlr.gov.cn/zwgk/gggs
National ocean parks State Oceanic Administration, People’s Republic of China http://www.soa.gov.cn/zwgk/gsgg
National scenic spots State Council http://www.gov.cn/zhengce/xxgkzl.htm
National nature reserves State Council http://www.gov.cn/zhengce/xxgkzl.htm
National archaeological site parks State Administration of Cultural Heritage http://www.sach.gov.cn/col/col1041/index.html
National mine parks Ministry of Natural Resources of the People’s Republic of China http://www.mlr.gov.cn/zwgk/gggs
National forest parks State Forestry Administration, People’s Republic of China http://www.forestry.gov.cn/
National desert parks State Forestry Administration, People’s Republic of China http://www.forestry.gov.cn/
National wetland parks State Forestry Administration, People’s Republic of China http://www.forestry.gov.cn/
National water recreation areas Ministry of Water Resources of the People’s Republic of China http://www.mwr.gov.cn/zw/tzgg/tzgs
National key parks Ministry of Housing and Urban-Rural Development of the People’s Republic of China http://www.mohurd.gov.cn/zxydt
World biosphere reserves Chinese National Committee for Man and Biosphere Programme http://www.mab.cas.cn/zgsjswqbhq/cyzl/
After reconciling various repetition of titles, etc., we identified 3418 distinct NPAs. Their coordinates were obtained from Google online map and their location input to ArcGIS10.2. Owing to its scalability, the Google online map’s highest resolution can be 5 meters, which ensures the accuracy of the extraction. The Google online map contains most NPAs currently issued, so we get the specific scope of the NPA by directly entering the name. In consideration of the distribution of the NPAs present planar state, the geometric centers of the natural conservation areas are taken as their coordinates. We used the NPA centroid as attraction coordinates for larger NPAs with a variety of attractions. Traffic, natural, and cultural data were digitized from 1: 4,000,000 paper maps for 2016 (Fu Jian Map Publishing House 2016 , Wang 2004, Wang 2010). Vector data for China’s borders were obtained from the National Geometrics Center of China at 1:4,000,000 scale. Regions such as Hong Kong, Macao, and Taiwan were not included in the study due to their particular geographical and social barriers, and inconsistent statistical procedures. All graphic data were transformed into a unified Albers equal area conic projection by ArcGIS10.2. The resultant dataset was stored in a geographical database.

2.2 Point pattern analysis

2.2.1 Nearest neighbor index
Nearest neighbor index (NNI) is the average distance of neighboring points divided by the average distance of a random distribution model and describes the level of deviation from a random distribution (Steiniger and Weibel, 2007)
$NNI=\frac{\left[ \sum\limits_{i=1}^{N}{\frac{\min ({{d}_{ij}})}{N}} \right]}{0.5\sqrt{(A/N)}}$,
where min (dij) is the distance between point j and its i = 1…N nearest neighbor points, and its fundamental unit is the kilometre, N is the count of tourist attractions in the study area, and A is total area of the study area. Generally, NNI ≤ 0.5 implies aggregate, 0.5 < NNI ≤ 0.8 aggregate-random, 0.8 < NNI < 1.2 random, and 1.2 ≤ NNI < 1.5 random-uniform distributions.
2.2.2 Ripley’s K-function
Ripley’s K-function has been shown to be an effective measure of spatial relationships between point data and is better suited than other popular spatial tests to assess complex spatial patterns (Tang et al., 2015). We ran Ripley’s K-function in CrimeStat to identify if the NPA distribution was random, clustered, or dispersed, and then derived the relationship between spatial distribution and neighborhood size (in different scales). The function can be expressed as follows (Haase, 2010).
$K({{t}_{s}})=\frac{A}{{{H}^{2}}}\sum\limits_{i}{\sum\limits_{i\ne j}{I({{t}_{ij}})}}$,
where K(ts) is the average sample density in the radius of ts, H is the count of sample points, A is the total areas of sample points, I(tij) is a protected place in a circle centered on point i, with radius ts, and exclusive of i itself. Equation 2 can be converted into the square root form,
$L({{t}_{s}})=\sqrt{\frac{K({{t}_{s}})}{\text{ }\!\!\pi\!\!\text{ }}}-{{t}_{s}}$,
where L(ts) < 0 implies a diffuse, L(ts) = 0 random, L(ts) > 0 aggregate.
2.2.3 Hotspot clustering
Hotspots are where several protected areas cluster together spatially, i.e., larger density. We used the closest distance hierarchical clustering method, according to the nearest distance of each tourist attraction i and defining an accumulative unit, limit distance or threshold value, and the minimum of each accumulative unit. We compared accumulated units with each nearest distance. A point is included in a hotspot when the nearest distance is less than the predefined limit. Thus, the original point data was clustered in several elliptical regions, called first-class zones. Similarly, these first-class zones were clustered in several elliptical regions, called second-class zones, and so on (Cheng et al., 2018).
2.2.4 Quadrat analysis
We overlaid a set of quadrats on the study area and counted the count of NPA points in each quadrat. The count was compared with a completely random distribution to determine spatial distribution characteristics, using the variance mean ratio (Kalabokidis et al., 1992; Mao et al., 2004).
VMR = VAR/Mean,
where
$VAR=\frac{{{\sum{{{p}_{i}}x_{i}^{2}-(\sum{{{p}_{i}}}{{x}_{i}})}}^{2}}/n}{n-1}$,
Mean is the arithmetic mean, pi is the quadrat frequency containing i protected sites, xi is the count of NPAs in various places, n is total count of quadrats. If variance mean ratio (VMR) < 1, NPAs are uniformly distributed, then VMR = 1, NPAs are Poisson distributed, and VMR > 1, NPAs are in a concentrated distribution. Mean and VAR reduce numerically as we increase the count of quadrats, but variance (VAR) reduces faster than Mean. Thus, although VMR also reduces it will not change the distribution type. Quadrat size was determined to be twice the average NPA area (Voorhis et al., 2007).
2.2.5 Equilibrium analysis
The NPA spatial distribution equilibrium was measured by the concentration index, Gini coefficient, and imbalance index. The concentration index can be expressed as (Yitzhaki, 1979)
$G=100\times \sqrt{\sum\limits_{i=1}^{n}{{{\left( \frac{{{X}_{i}}}{T} \right)}^{2}}}}$,
where Xi is the count of NPAs in the i-th province, In formula (6), T is the total count of NPAs, n is the count of provinces. Larger G implies higher density NPA distribution. The Gini coefficient can be expressed as (Yitzhaki, 1983):
$Gini=\frac{\sum\limits_{i=1}^{N}{{{p}_{i}}\ 1n\ {{p}_{i}}}}{1n\ N}$,
where Gini is uniformity of distribution; pi is the percentage of NPAs in each partition; N is total points of partition. Larger Gini implies higher density NPA distribution. The imbalance index can be expressed as:
$S=\frac{\sum\limits_{i=1}^{n}{{{Y}_{i}}-50(n+1)}}{100n-50(n+1)}$,
where Yi is the i-th cumulative percentage according to the weight of each province in the whole country by down sizing. If NPAs are evenly distributed across the quadrats, S = 0, whereas if all NPAs were concentrated in one quadrat, S = 1.
2.2.6 Arrival time based on cost weighted distance
Accessibility methods could be divided into network analysis methods based on road vector data, and cost weighted distance based on raster data. The GIS grid analysis cost distance model was adopted to calculate accessibility, because the method can be implemented for every point in the space (raster), which improved visibility, avoided error from spatial interpolation, considered influencing factors water and mountain barriers. NPA accessibility refers to the average trip distance from the NPA to the surrounding area. The cumulative raster cost was calculated for all targets from the cumulative costs of all possible paths within a raster to all target raster in the study area, then compared the size and assigned the smallest value to the raster. The cumulative raster cost can be expressed as (Luo et al., 2016; Yang et al., 2015):
$A=\left\{ \begin{align} & \frac{1}{2}\sum\limits_{i=1}^{n}{({{C}_{i}}+{{C}_{i+1}})} \frac{\sqrt{2}}{2}\sum\limits_{i=1}^{n}{({{C}_{i}}+{{C}_{i+1}})} \end{align} \right.$,
where n is the total count of pixel in the formula (9); Ci is the cost for the i-th pixel; Ci+1 is the cost along the direction of motion toward the i+1-th pixel. We use the upper part of formula (9) when the raster is horizontal or vertical, the bottom of formula (9) when the grids are diagonally adjacent.
This study selected a raster grid 1×1 km and applied raster processing to produce a road grid diagram. Reference time costs per km were set considering the influence of different surface types on different travel speeds (Table 2) (HDUTD, 2004). Raster was set at 5 km/h with no road passed, and raster including water systems was set as resistance grids with null value. Raster data were spatially superimposed, to provide time cost raster data for the whole country. The Google Earth NPA l-km layer was converted to a point vector layer in ArcGIS, which allowed cost distance weighted data and accessibility of all NPAs to be calculated from the time cost grid data using the ArcGIS Cost Distance operation in 2016.
Table 2 China’s land traffic network velocity and time spent in 2016
Road type High-speed railway Expressway Railway National highway Provincial highway County
highway
Others
Speed (km/h) 280 120 100 80 60 40 5
Time cost (min/km) 0.21 0.5 0.6 0.75 1 1.5 12

3 Results

3.1 Provincial distributions

The 3418 NPAs distributed across 31 provinces of China (excluding Taiwan, Hong Kong and Macau) and exhibit significant inhomogeneity (Figure 1). Shandong province contains the most NPAs (238), and Tianjin contains the least (9), with average in each province of 110. Average NPA density was 3.55/10,000 km2, with the highest density in Beijing municipality (27.38/10,000 km2), then Shanghai municipality (19.04/10,000 km2), and the lowest density in Tibet (0.36/10,000 km2).
It seems that there are a lot of NPAs in central and eastern China as can be seen from the charts, contrary to the above conclusions, the range of western China should be larger in the proportion of area. In view of the fact that it is difficult to get the areas of 13 kinds of NPAs, so we did a comparation of the percentage in the administrative division by taking national nature reserves as an example to reveal the spatial pattern of NPAs more intuitively. Due to the influence by related data acquisition, we selected the areas of national nature reserve of 31 provinces in 2015.
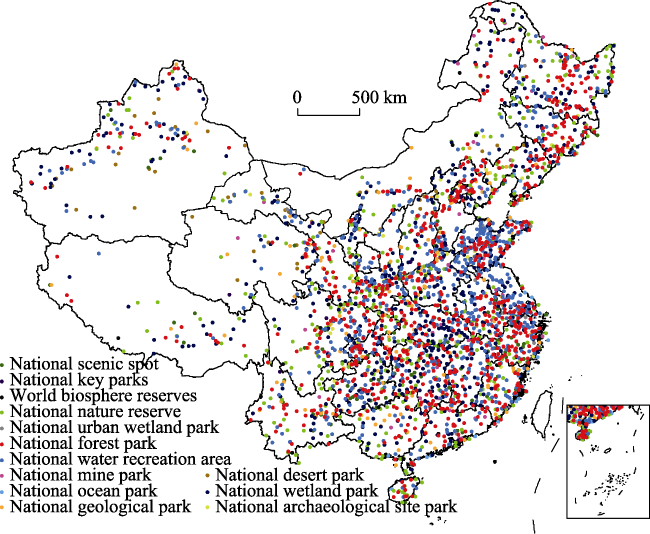
Figure 1 National protected area distribution across China in 2016
As shown in Figure 1, the number of national nature reserves in western China is quite small, here, it is clear from Figure 2 that the area of western China is even surpassing the summation of the central and eastern, especially in Gansu (68,770 km2), Qinghai (207,340 km2), Xinjiang (121,890 km2) and Tibet (371,530 km2). Only Inner Mongolia (42,690 km2) and Heilongjiang (30,310 km2) are slightly prominent in central China, and Liaoning (9780 km2) in eastern China has a bit representation, however, they simply cannot match with western China, with eastern has high population density and few conditions of a large area. This phenomenon also illustrates the integration in space is of vital importance.
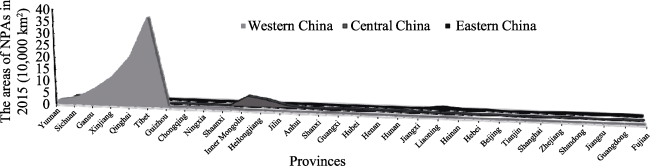
Figure 2 The areas of national protected area across China in 2015
There is a huge count of NPAs, of many types. This study considers 13 NPAs types (Figure 3), where national forest parks account for the largest proportion (22.87% of all NPAs); world biosphere reserves the least (0.77%); and national mine, key, archaeological, desert, and ocean parks each account for < 2%.
The calculated G = 19.98, whereas uniform distribution would have G = 17.96. Hence, the NPAs are not significantly aggregated across the provinces. This is consistent with the calculated Gini = 0.073 and n = 0.282, which indicate NPAs were relatively evenly distributed among the 31 provinces.
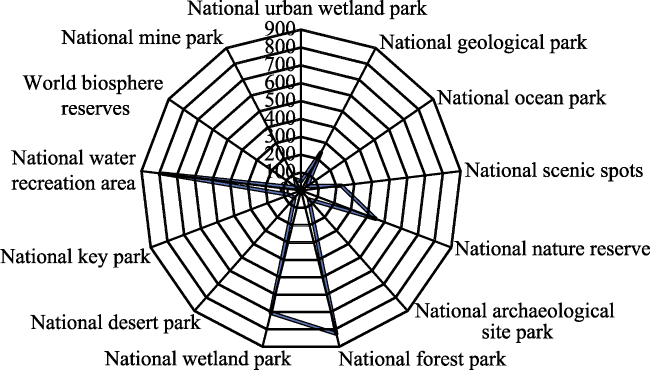
Figure 3 National protected area structural features in 2016

3.2 Spatial accumulation characteristics

3.2.1 Nearest neighbor index analysis
Table 3 shows NPA NNIs across China. National mine parks and world biosphere reserves, as well as several less widely distributed types, are random-uniform distributed, whereas national key parks and national water recreation areas show strong aggregation, NNI = 0.563 and 0.561, respectively.
Table 3 National protected area (NPA) nearest neighbor indexes in 2016
Categories of NPAs Average nearest distance (km) Expected nearest distance (km) NNI Z test value P test value Distribution type
National urban wetland park 168 213 0.791 -2.802 0.005 Random-uniform
National geological park 87 123 0.705 -8.667 0.000 Random-uniform
National scenic spot 93 135 0.684 -8.520 0.000 Random-uniform
National ocean park 84 122 0.689 -3.666 0.000 Random-uniform
National archaeological site park 126 167 0.750 -3.885 0.000 Random-uniform
National mine park 174 185 0.938 -0.992 0.321 Random
National forest park 42 72 0.584 -22.807 0.000 Random-uniform
National desert park 133 190 0.697 -4.223 0.000 Random-uniform
National wetland park 5 78 0.653 -17.281 0.000 Random-uniform
National water recreation area 41 73 0.561 -22.605 0.000 Random-uniform
National key park 86 152 0.563 -6.790 0.000 Random-uniform
National nature reserve 73 101 0.726 -10.313 0.000 Random-uniform
World biosphere reserve 373 326 1.144 1.455 0.146 Random
National protected area 18 36 0.515 -54.209 0.000 Random-uniform

NNI: Nearest neighbor index;

Z test value: Probability;

P test value: Multiple of standard deviation.

3.2.2 Ripley’s K-function analysis
Figure 4 shows the calculated K index using CrimeStat software, using the square root form (Eq. (3)). L(t) increases with increasing distance. Thus, since L(t) > 0 indicates NPAs are spatially aggregated, aggregation also increases with increasing distance. The inflection point at approximately 600 km indicates reducing aggregation when the distance exceeds 600 km. We also corrected the K function using rectangular and circular correction methods. Figure 3 shows that the rectangular correction L(t) is monotonically increasing with distance, whereas the circular correction was similar to uncorrected L(t). These outcomes suggest the K function was significantly affected by boundary effects, but corrected results remain credible.
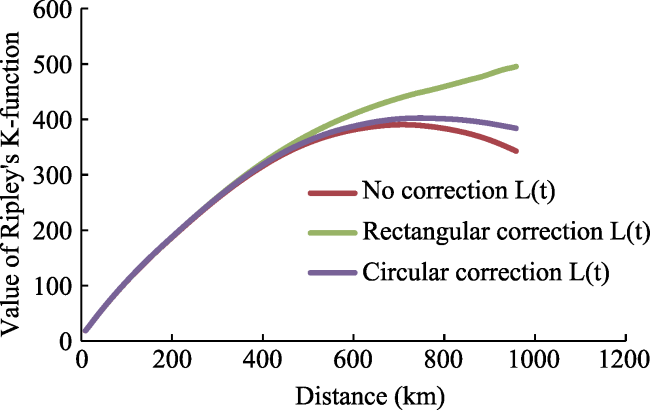
Figure 4 National protected area Ripley’s K function in 2016
3.2.3 Hotspot analysis
Figure 5 shows NPA spatial distribution differs across the different regions of China, and high concentration areas can be called hotspots. We employed the closest distance hierarchical clustering method in the CrimeStat software to calculate the NPA hotspot distribution in China. There was one first-class zone covering all of Jiangsu, Zhejiang, Anhui, and Henan; most of Hubei; and parts of Shandong, Jiangxi, and Hunan provinces. Five second-class zones were identified: Shanxi, Shaanxi, and Henan provinces in the Yellow River Valley; junction of Hebei, Shandong, and Henan provinces; junction of Jiangxi, Zhejiang, and Fujian provinces; junction of Hunan, Hubei, and Jiangxi Provinces; and the Yangtze River Delta. Fifty-one third-class zones were distributed east of 100°E longitude, mainly in the middle and lower reaches of the Yellow and Yangtze rivers. Spatial NPA distribution within the first-class zone was random, consistent with the macroscopic distribution. Second-class zones were distributed along the Yellow River and Yangtze river basins, and third-class zones showed areal concentrations, mainly distributed to the east of the Heihe-Tengchong line, also consistent with macroscopic NPA distribution.
Figure 5 National protected area (NPA) hotspots in 2016
3.2.4 Quadrat analysis
The average area per NPA is 2970.27 km2, so quadrat area was set as 5940.55 km2 (Ginzburg et al., 2004), i.e., 77.07×77.07 km. Quadrats that overlapped China national boundaries were omitted (Figure 6), to eliminate boundary effects, leaving 1412 quadrats including 2966 NPAs (452 NPAs omitted). Quadrat analysis showed VAR is 1.567, Mean is 1.395, hence VMR is 1.123, from Eq. (4). Since VMR > 1, NPAs tend to be distributed in aggregation.
Figure 6 National protected area (NPA) quadrat distribution in 2016
3.2.5 Accessibility
After calculating the accessibility raster (Figure 7, 1 km×1 km), the percentage of the accessible time in each time period was obtained by reclassifying the raster count of the different time segments, and the average accessible time was obtained by the average of all raster values in the ArcGIS. Figure 7 and Table 3 show the NPA accessibility for 2016 using cost weighted distance (Eq. (6)), divided into 10 segments: 10, 20, 30, 60, 90, 120, 180, 240, and 360 min. Average NPA accessible time was 60.05 min, 70.76% of NPAs had accessible time≤60 min, and 49.68%≤30 min, i.e., almost half of the NPAs were within half an hour. Only 2.28% NPAs had accessible time≥360 min, and the largest accessible time was 777 min. However, there were significant accessibility discrepancies due to the traffic network, and areas with better accessibility were generally in central and eastern China. Generally, less accessible NPAs were located in alpine desert or border regions, such as Tibet, Xinjiang, Qinghai, etc. The calculated accessibility represents an ideal case, but not consider road conditions or traffic congestion. Actual achievable access time will be somewhat higher than these results.
Table 3 Distribute frequency and cumulate frequency of accessibility of NPAs in 2016
Time (min)
0-10 10-20 20-30 30-60 60-90 90-120 120-180 180-240 240-360 >360
Raster count 1631981 1804265 1259438 1992522 976053 553533 565012 260201 192902 215600
Proportion (%) 17.267 19.090 13.325 21.082 10.327 5.857 5.978 2.753 2.041 2.281
Cumulative proportion (%) 17.267 36.357 49.682 70.763 81.090 86.947 92.925 95.678 97.719 100.000

3.3 Natural and cultural factor analysis

NPAs were generally had agglomerate distribution, i.e., associated with different aims of NPAs’ protection purposes, landscape character, and resource value. Therefore, we are going to make the NPAs, natural and cultural geographical features of the distribution overlay, the significant influence of distribution can be intuitively understood at a macro level and greater geographical unit.
3.3.1 Landform distribution
Landform refers to various features, often involving significant influence from human activities and economic construction. China is on the Asian continental margin formed from a collision of continental plates, with terrain altitude gradually reducing in three steps from west to east, hence the geo-environment differs across the regions. Figure 8 shows landform had a significant effect on NPA distribution. The bulk of NPAs are in the low plains in eastern and northern China (11.96%), low and middle height mountains in Zhejiang-Fujian (9.27%), plains and low hills in the middle reaches of the Yangtze River (8.07%), and middle height mountains in Hubei, Yunnan, and Guizhou (7.47%). In contrast, very few NPAs were in the Altun-Qilian (0.41%), Altai (0.26%), Kunlun mountain regions with high and extremely high relief (0.22%); Qiangtang Plateau lake basin (0.18%); and mountains in the Yangtze and Yellow river source regions (0.06%). The Karakorum Mountains, which have high and extremely high relief, have no NPAs. Thus, NPAs tend to be in the plains and low mountains, but the western plateau and mountainous regions also showed relatively sparse NPAs, in contrast to the common US mountain parks (Larkin et al., 2014). Generally, NPAs were negatively correlated with terrain height and obvious landform differences.
Figure 7 National protected area accessibility in 2016
3.3.2 Climate distribution
Climate is the long-time average annual value of atmospheric and physical characteristics, which affects all living things. Figure 9 shows NPAs were generally distributed in warmer climate areas, which are also the main human activity areas: warm temperate (25.75%), mid subtropical (22.59%), middle temperate (21.09%), northern subtropical (17.75%), south subtropical (6.08%), and plateau temperate (3.60%) zones; with significantly smaller count in colder climates: marginal tropical (1.31%), plateau sub-frigid (1.26%), and plateau subtropical mountain (0.03%) zones. However, no NPAs occur in plateau tropical north-fringe mountainous zones.
3.3.3 Hydrology distribution
There are 11 hydrological belts in China, and Figure 10 shows that the NPAs are mainly distributed in 5 of these: warm temperate regions in northeast (24.41%), subtropical and tropical regions in southeast (19.16%), subtropical temperate regions in the north Qinling and Dabie mountains (14.77%), subtropical and tropical regions in the southwest (14.32%), and abundant and balanced regions in the northeast (7.75%). There was relatively minor NPA distribution in dry regions in the northwest basins with temperate and warm temperate (3.72%), dry regions in the northwest mountain regions with middle temperate, sub-frigid, and frigid climate (3.42%), and dry regions in the Qiangtang Plateau with sub-frigid and frigid climate (0.21%). National desert park NPAs were also in dry regions, and NPA hotspots were mainly concentrated near abundant water resources or high rainfall areas.
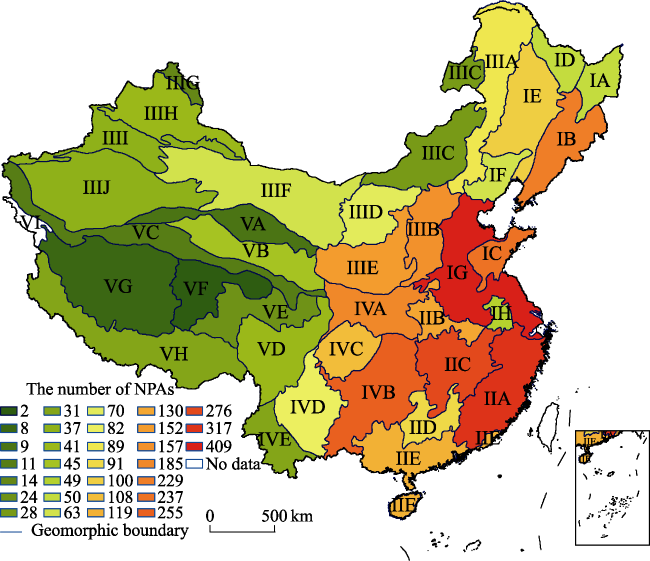
Figure 8 Spatial distribution of NPAs based on landform zone in 2016

Note: IA. Sanjiang low plains; IB. Middle and low mountains in Changbai Mountains; IC. Low mountains and hills in eastern Shandong; ID. Low mountains in Xiao Hinggan Mountains; IE. Songliao low plains; IF. Low and middle mountains in Yanshan-Liaoning; IG. Low plains in eastern and northern China; IH. Plains and hills in Ningzhen; IIA. Middle and low mountains in Zhejiang-Fujian; IIB. Huaiyang low mountains; IIC. Plains and low hills in Yangtze River middle reaches; IID. Middle and low mountains in Guangxi-Hunan-Jiangxi; IIE. Low mountains and plains in Guangdong-Guangxi; IIIA. Middle mountains in Da Hinggan Mountains; IIIB. Basin and middle mountains in Shanxi; IIIC. Middle plains in Inner Mongolia; IIID. Middle plains in Ordos-Hetao; IIIE. Loess Plateau; IIIF. Middle plains in Xinjiang-Gansu; IIIG. Altai Mountains; IIIH. Junggar low basins; IIII. High mountains and basins in Tianshan; IIIJ. Tarim Basin; IVA. High and middle mountains in Qinling-Daba Mountains; IVB. Middle mountains in Hubei-Yunnan-Guizhou; IVC. Low basins in Sichuan; IVD. High and middle mountains and basins in southwest Sichuan and central Yunnan; IVE. High and middle mountains in southwest Yunnan; VA. Altun-Qilian mountains; VB. High and middle basins in Qaidam-Huangshui valley; VC. Kunlun Mountains with high and extremely high relief; VD. Hengduan Mountains with high and extremely high relief; VE. Upstream of river with middle and high relief; VF. High mountains and dome-shaped plains in the Yangtze and Yellow river source regions; VG. Qiangtang Plateau lake basin; VH. Himalayas with high and extremely high relief; VI. Karakorum Mountains with high and extremely high relief.

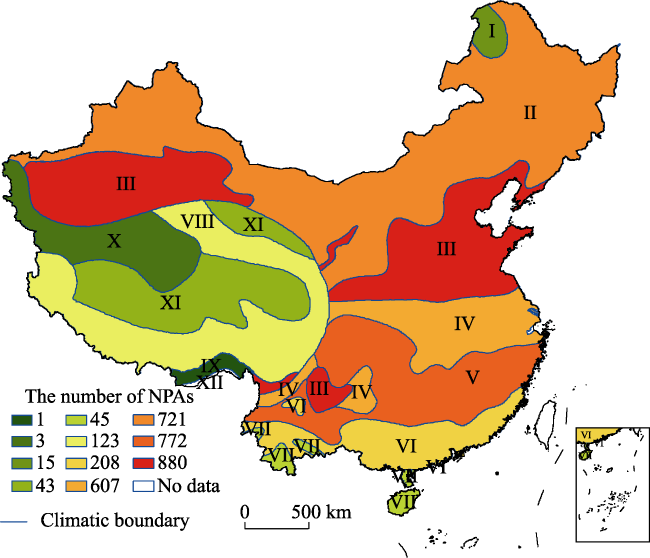
Figure 9 Spatial distribution of NPAs based on climate zone in 2016

Note: I. Cold temperate; II. Middle temperate; III. Warm temperate; IV. Northern subtropical; V. Middle subtropical; VI. South subtropical; VII. Marginal tropical; VIII. Plateau temperate; IX. Plateau subtropical mountain; X. Plateau frigid; XI. Plateau sub-frigid; XII. Plateau tropical north-fringe mountains.

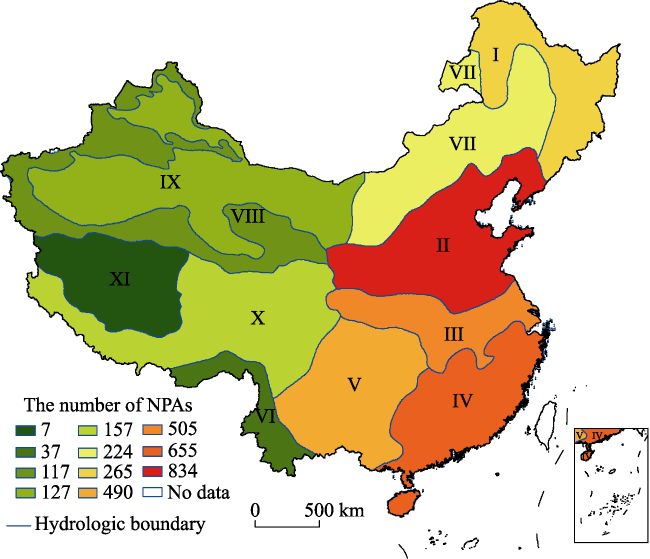
Figure 10 Spatial distribution of NPAs based on hydrology zone in 2016

Note: I. Abundant and balanced regions in northeast with frigid and middle temperate climate; II. Abundant and balanced regions in northeast with warm temperate climate; III. Balanced regions in Qinling-Dabie mountains with north subtropical temperate climate; IV. Abundant regions in southeast China with subtropical and tropical climate; V. Abundant regions in southwest China with subtropical and tropical climate; VI. Abundant regions in western Yunnan and southeastern Tibet with subtropical and tropical climate; VII. Balanced regions in Inner Mongolia with middle temperate climate; VIII. Dry regions in northwest mountain with middle temperate, sub-frigid, and frigid climate; IX. Dry regions in northwest China basins with temperate and warm temperate climate; X. Balanced regions in eastern and southwestern Tibetan Plateau with temperate climate; XI. Dry regions in Qiangtang Plateau with sub-frigid and frigid climate.

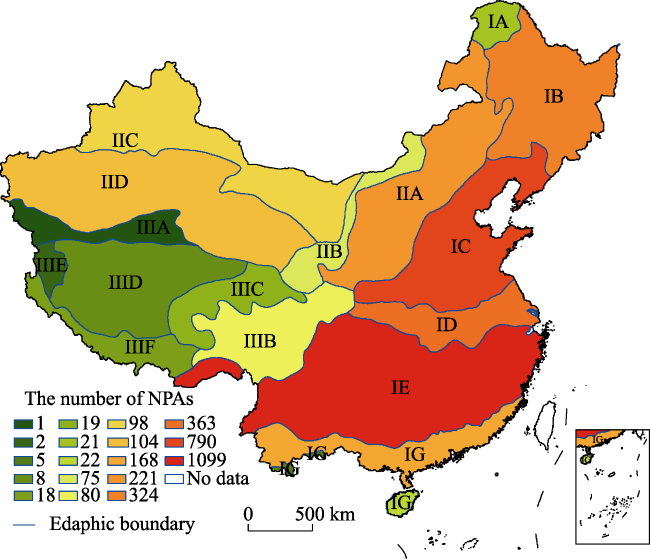
Figure 11 Spatial distribution of NPAs based on soil zone in 2016

Note: IA. Cold brown and lime soil; IB. Dark brown forest and lime soil; IC. Brown and cinnamon soil; ID. Yellow brown and yellow cinnamon soil; IE. Red and yellow soil; IF. Lateritic red soil; IG. Latosol soil; IIA. Chernozem, chestnut, and calcic kastanozem soil; IIB. Calcium and brown calcium zone; IIC. Grey desert soil; IID. Brown desert soil; IIIA. Alpine desert soil; IIIB. Submountain meadow soil; IIIC. Mountain meadow soil; IIID. Alpine steppe soil; IIIE. Subalpine desert soil; IIIF. Subalpine steppe soil.

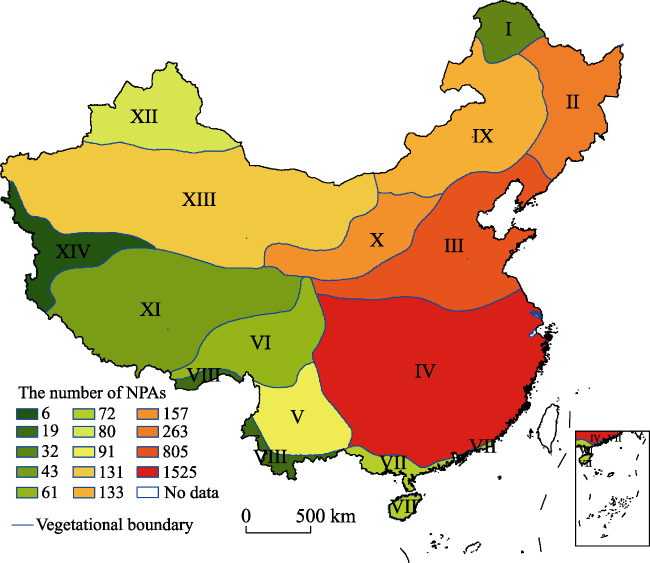
Figure 12 Spatial distribution of NPAs based on vegetation zone in 2016

Note: I. Needle in cold temperate; II. Needle and broad-leaved mixed forest in temperate region; III. Broad-leaved forest in warm temperate region; IV. Moist broad-leaved evergreen forest in eastern subtropical region; V. Semi humid evergreen broad-leaved forest in western subtropical region; VI. Frigid, warm needle, and broad-leaved evergreen forest in plateau or hilly region; VII. Moist seasonal rain forest and rain forest in tropical eastern region; VIII, Moist seasonal dry forest and rain forest in tropical western region; IX. Grassland in temperate region; X. Grassland in warm temperate region; XI. Meadow and grassland region in alpine plateau region; XII. Desert in temperate region; XIII. Desert in warm temperate region; XIV. Desert in plateau cold temperate region.

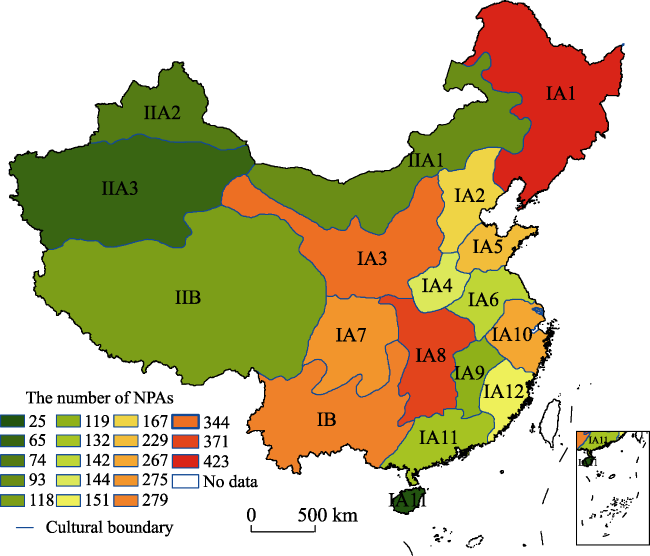
Figure 13 Spatial distribution of NPAs based on culture zone in 2016

Note: IA1. Guandong cultural region; IA2. Yan-Zhao cultural region; IA3. Loess Plateau cultural region; IA4. Central plains cultural region; IA5. Qilu culture region; IA6. Huaihe basin cultural region; IA7. Sichuan cultural region; IA8. Jing-Xiang cultural region; IA9. Poyang cultural region; IA10. Wuyue cultural region; IA11. Lingnan cultural region; IA12. Cultural sub regions across the Taiwan Straits; IIA1. Inner Mongolia cultural region; IIA2. Northern Xinjiang cultural region; IIA3. Southern Xinjiang cultural region; IB. Agricultural cultural region of minority nationalities in southwest China; IIB. Nomadic cultural region of Tibetan Plateau.

3.3.4 Soil distribution
The soil is loose on the surface and affects terrestrial and some marine organisms directly or indirectly. NPAs were distributed across 17 soil belts in China, with the largest count (32.14%) in red and yellow; followed by brown and cinnamon (23.12%); yellow-brown and yellow cinnamon (10.61%); dark brown forest and lime (9.49%); and chernozem and chestnut, and calcic kastanozem (6.46%) soils (Figure 11). Few NPAs occurred in regions with latosol (0.65%), cryo-brown (0.62%), mountain meadow (0.56%), subalpine steppe (0.53%), alpine steppe soils (0.24%), and subalpine desert soil belt (0.06%). Thus, NPA distribution was highly correlated with soil fertility, with most NPAs located in high fertility, high humus content soils, with cultivation potential, e.g. red and yellow soils are aluminum rich, and brown soils are free from leaching, etc.
3.3.5 Vegetation distribution
Vegetation is a general term for plant communities covering the surface, which reflect the environment. Figure 12 shows that most NPAs (68.16%) occurred in moist broad-leaved evergreen forests, in the eastern subtropical zone, and broad-leaved forest regions in the warm temperate zone. The remaining NPAs were dispersed across many vegetation types: needle and broad-leaved mixed forest in temperate (7.7%); grassland in warm temperate (4.59%); desert in warm temperate (3.85%); and frigid, warm needle, and broad-leaved evergreen forest in plateau or hilly (1.75%) zones. This is a key output of the current study: current NPAs are mainly located within pleasant environments in broad-leaved forest regions, with many also in higher ornamental value landscape, whereas few NPAs occur in regions with minor vegetation cover or coniferous forest. That is to say, the rich fruits of culture can be bred in warm or moist broad-leaved forest rather than others.
3.3.6 Culture distribution
Cultural patterns were also expected to significantly influence NPA distribution. Figure 13 shows NPAs decrease gradually in the form of arithmetic progression although spatially they were relatively even. The largest concentration of NPAs was in Guandong (12.38%) and least in Lingnan (0.07%) cultural regions. National key archaeological site parks constitute cultural resources themselves. National key parks reflect the garden culture prevalence in the Yan-Zhao and Wuyue cultural regions, whereas national archaeological site parks reflect the site culture prevalence in the Loess Plateau and Jing-Xiang cultural regions.

4 Discussion

A protected areas system, which accounted for more than 20% of the land area and took the nature reserve as the mainstay, has been established under the present conditions. China has yet to form a national park system, except one network of NPAs supported by multifarious quantities and types. Faced with the unsound network, it is not difficult to discover some maladies on the travel of exploring spatial patterns and searching influencing factors (Shoo et al., 2013):
(1) The NPAs are unevenly distributed with diversified types. Based on conclusion, although more than half of the NPAs were located in the central and eastern regions of the country, the western regions have more natural resources, we can not see balance but the difference, more so given the situation of the provinces.
(2) The administrative system was not sound and standardized. Although the dense areas have realized the development of resources as far as possible, ensuing disadvantage created NPA’s work stamina insufficient and management confused, such as long title, overlapping area and unclear boundary. In addition, most NPAs have not created separate management departments, they were mainly coordinated and managed by multiple departments that tend to be approved by local authorities and different departments. And the network of NPAs without any systematic design can not be called a complete and clear protected system but a collection of protected areas.
(3) The administrative division has separated the natural environment and hindered the natural resources optimization disposition. A coherent natural ecosystem went through artificial segmentation, has formed massive fragmenting and islanding ecological spaces, leading to the reduction of the function of the ecosystem and the aggravation of the difficulty of management. The single national park system, at this point, will be divided into different administrative levels and different management institutions, the bitter results bring about a predicament with unclear functions and responsibilities.
(4) The confusion of funds has been induced “corrupt NPAs”. The country’s major investments in NPAs were biased in favor of eastern and central, and the inconsistency of sources of funds, a result related to the attitude towards the establishment of NPA has changed from support to skimp in some places. Accordingly, the approval time of some NPAs was early but uncompleted, they have been in a semi-open and semi-construction state. Yet, some NPAs are located in remote regions, the inadequate management and maintenance of functional departments at the scene has caused the NPAs being in a dilemma of “natural development”. And, unreasonable ticket fees in partial NPAs making significance of the establishment have soured, the NPAs are also translating into urban parks, country parks, amusement parks or tourist resorts, even rocking to local government’s “economic engine”.
(5) The division of property rights and control rights may lead to intertwined functions of enterprises and government. The government has set up the management bureau mingled with a tourism management company, they are responsible for the planning, development, protection and supervision, and daily operation and service in common, this complex system brought out the poor management, slack work, and weak monitoring.
(6) The fact is lack of awareness of protecting ecology. Under the political background of economic development, the officials in most of the underdeveloped NPAs pay more attention to the economic development, but they derive severe environmental pollution. The limited investment is bound to tilt, in pursuit of economy certainly results in difficult protection, and the consequent damage will bring the environment worse and the tourism benefits lower, ultimately resulting in lasting and multiple vicious circle.
Inspiration on construction of national park system
How to arrange the spatial layout at the national level in the establishment of the national park system in the future? How to embody the balance between types? What is the proportion of NPAs in China’s land area? And how do we transfer the NPA’s system to the national park system? The work should take policy opportunity to integrate and improve the protection system, and speed up the construction of ecological civilization system, not just to establish several national parks. According to current situation, this paper presents some suggestions to solve the problems (Albers et al., 2007; Trakolis, 2001; Mbile et al., 2005; Yang, 2014).
(1) The government, through the State Council or National Development and Reform Commission, should suspend or cancel current national park pilots in provinces or departments, integrate and standardize auditing and naming of existing protected sites. This suggestion will not only enhance the parks’ national and international image, but also provide consistent management mechanisms (Karanth et al., 2011).
(2) On the basis of combining the existing NPAs, the national park system should break the pattern of biased sturdy agglomerate. The activity should adapt to the characteristics of the distribution of protected areas in different regions based on model of “Upgrade - Integration - New”, to form a relatively complete space network, reorganize the overlapped and crossed and adjacent NPAs, and thus can operate a complete physical geography and cultural geographical zoning space network. In conclusion, we argue that the national parks should protect the authenticity and integrity of natural and cultural heritage, and we point out that the national park system, in essence, provides a reasonable framework in which ecological protection is substantive and thus can have concept of resource protection in space configuration at priority (Zhu, 2014). Then, the construction of the national park could incline to the sparse, the inaccessible, and the original areas.
(3) Correctly the 9 pairs of relationships should be handled. 1) One and many. China’s national park system should cover the whole “natural protection system” rather than a single kind of protected area. 2) Protection and development. Our first priority must be protecting ecosystem and providing opportunities for public education and leisure for public welfare. 3) Predecessors and successors. Not only to carry forward the legacy of the ancestors, a qualified successor, but the more noticeable is that the rights and interests of generations could not be damaged. 4) Central and local governments. It is central duty and government’s responsibility to construct and manage, what sets local institutions different from center is the responsibility should be done on the protected areas except the national park. 5) One NPA and another. It is necessary to solve the contradictions among the various NPAs, such as fuzzy boundaries, the serious internal consumption, several names owed to one place and so on. 6) Interior and exterior. How to settle the various problems which were derived from the natural, economic and cultural boundaries is the key step to build the Chinese national park system. 7) New and old. The existing NPAs should be preserved and continued in the future national park system. And we must adhere to the development and improvement of new NPAs. 8) Government and mass. China’s national parks should be a form of “government-led, multi-party participation”, their protection and inheritance cannot be separated from any citizen and any institution. 9) Quality and speed. The establishment of national park system in the contemporary benefits, and the credit centuries.

5 Conclusions

The national parks contribute largely to national image and identity, provide an important focus for constructing and rejuvenating an ecological civilization. The NPAs are not only important areas for ecological protection, reflecting national intentions from governmental level, but also provide the basis for national park construction in China. This study analyzed NPA spatial distributions with respect to the natural and cultural geography of China. The main conclusions can be drawn as follows. (1) The NNI of NPAs is 0.515 with spatial aggregation. National key parks and national water conservancy scenic spots were the most concentrated with NNI of 0.563 and 0.561 respectively, and more than half of the NPAs were located east of 100°E primarily in the middle and lower reaches of the Yellow and Yangtze rivers. (2) The K index indicates that NPAs will be aggregated when the distance is within 600 km. (3) High NPA densities occur in flat, water-rich regions, with predominantly broad-leaved forests and plain or low mountain terrain. NPAs concentrated in areas with fertile soil, mild weather and long cultural histories. (4) Distribution was relatively uniform across different cultural regions, the largest concentration of NPAs was in the Guandong (12.38%) and least in the Lingnan (0.07%) cultural regions. (5) NPAs accessible time was largely < 1h (70.76%), with average accessible time is 1h, correlated with spatial structure and traffic networks. (6) NPA distribution across China exhibits spatial overlap, intersection, and proximity issues, causing contention between different departments and local governments. And the construction of a national park system should be based on combining existing NPAs, breaking the current pattern of strong cohesion and density distribution, and seeking balanced development nationwide.
1
Albers H J, Robinson E J Z , 2007. Spatial-temporal aspects of cost-benefit analysis for park management: An example from Khao Yai National Park, Thailand. Journal of Forest Economics, 13(2/3):129-150. doi: 10.1016/j.jfe.2007.02.002.

DOI

2
Boyce M S, Mao J S, Merrill E H et al., 2016. Scale and heterogeneity in habitat selection by elk in Yellowstone National Park. Écoscience, 10(4):421-431. doi: 10.1080/11956860.2003.11682790.

DOI PMID

3
Cheng K L, Hsu S C, Li W M et al. 2018. Quantifying potential anthropogenic resources of buildings through hot spot analysis. Resources Conservation & Recycling, 133:10-20. doi: 10.1016/j.resconrec.2018.02.003.

DOI PMID

4
Duan N, Liu X D, Dai J et al., 2017. Evaluating the environmental impacts of an urban wetland park based on emergy accounting and life cycle assessment: A case study in Beijing. Ecological Modelling, 222(2):351-359. doi: 10.1016/j.ecolmodel.2010.08.028.

DOI

5
Fancy S G, Gross J E, Carter S L , 2009. Monitoring the condition of natural resources in US national parks. Environmental Monitoring & Assessment, 151(1-4):161-174. doi: 10.1007/s10661-008-0257-y.

DOI PMID

6
Fujian Map Publishing House , 2016. China Traffic Map. Fuzhou: Fujian Map Publishing House. (in Chinese)

7
Geldmann J, Barnes M, Coad L et al., 2013. Effectiveness of terrestrial protected areas in reducing habitat loss and population declines. Biological Conservation, 161(3):230-238. doi: 10.1016/j.biocon.2013.02.018.

DOI

8
Ginzburg L R, Jensen C X , 2004. Rules of thumb for judging ecological theories. Trends in Ecology & Evolution, 19(3):121-126. doi: 10.1016/j.tree.2003.11.004.

DOI PMID

9
Gordon J E, Crofts R, Díaz-Martínez E et al., 2018. Enhancing the role of geoconservation in protected area management and nature conservation. Geoheritage, 10(2):191-203. doi: 10.1007/s12371-017-0240-5.

DOI

10
Haase P , 2010. Spatial pattern analysis in ecology based on Ripley’s K-function: Introduction and methods of edge correction. Journal of Vegetation Science, 6(4):575-582. doi: 10.2307/3236356.

DOI

11
Highway Department of Unit Traffic Department of China Committee of Standardization Association of Highway Engineering Construction(HDUTD), 2004. Beijing: People’s Communications Press. (in Chinese)

12
Kalabokidis K D, Omi P N et al., 1992. Quadrat analysis of wildland fuel spatial variability. International Journal of Wildland Fire, 2(4):145-152. doi: 10.1071/WF9920145.

DOI

13
Karanth K K, Defries R , 2011. Nature-based tourism in Indian protected areas: New challenges for park management. Conservation Letters, 4(2):137-149. doi: 10.1111/j.1755-263X.2010.00154.x.

DOI

14
Larkin A M, Beier C M , 2014. Wilderness perceptions versus management reality in the Adirondack Park, USA. Landscape & Urban Planning, 130(1):1-13. doi: 10.1016/j.landurbplan.2014.06.003.

DOI PMID

15
Li J S, Wang W, Axmacher J C et al., 2016. Streamlining China’s protected areas. Science, 351(6278):1160. doi: 10.1126/science.351.6278.1160-a.

DOI PMID

16
Liu X H, Li J H , 2008. Scientific solutions for the functional zoning of nature reserves in China. Ecological Modelling, 215(1):237-246. doi: 10.1016/j.ecolmodel.2008.02.015.

DOI

17
Luo F, Moyle B D, Bao J G et al., 2016. The role of institutions in the production of space for tourism: National forest parks in China. Forest Policy & Economics, 70:47-55. doi: 10.1016/j.forpol.2016.05.021.

DOI PMID

18
Mao Z Y, Li L , 2004. Measurement of Spatial Patterns and Their Applications. Beijing: Science Press. (in Chinese)

19
Mbile P, Vabi M, Meboka M et al., 2005. Linking management and livelihood in environmental conservation: Case of the Korup National Park Cameroon. Journal of Environmental Management, 76(1):1. doi: 10.1016/j.jenvman.2005.01.009.

DOI PMID

20
Notar B E. Scenic s pots : 2010. Chinese tourism, the state, and cultural authority - Pál Nyíri. Journal of the Royal Anthropological Institute, 108(4):916-917. doi: 10.1525/ae.2006.33.4.4051.

21
Pan J H, Li J F, Cong Y B , 2015. Quantitative geography analysis on spatial structure of A-grade tourist attractions in China. Journal of Resources and Ecology, 6(1):12-20. doi: 10.5814/j.issn.1674-764x.2015.01.002.

DOI

22
Peng J, Pan Y J, Liu Y X et al., 2018. Linking ecological degradation risk to identify ecological security patterns in a rapidly urbanizing landscape. Habitat International, 71:110-124. doi: 10.1016/j.habitatint.2017.11.010.

DOI

23
Perpinyà A B, Pallaresbarbera M , 2017. Spatial distribution of ignitions in Mediterranean periurban and rural areas: The case of Catalonia. International Journal of Wildland Fire, 15(2):187-196. doi: 10.1071/WF04008.

DOI

24
Qiu P, Zhang R J , 2009. On the influential factors and spatial distribution of national water parks’ in China: Analysis based on the spatial-dependent model and the fix-effects model. Statistics & Information Forum, 24(5):47-53. doi: 10.3969/j.issn.1007-3116.2009.05.010. (in Chinese)

DOI PMID

25
Runge C A, Watson J E, Butchart S H et al., 2015. Protected areas and global conservation of migratory birds. Science, 350(6265):1255. doi: 10.1126/science.aac9180.

DOI PMID

26
Shoo R A, Songorwa A N , 2013. Contribution of eco-tourism to nature conservation and improvement of livelihoods around Amani Nature Reserve, Tanzania. Journal of Ecotourism, 12(2):75-89. doi: 10.1080/14724049.2013.818679.

DOI

27
Staiff R, Bushell R , 2004. Tourism and protected areas: Benefits beyond boundaries. Annals of Tourism Research, 31(3):723-726. doi: 10.1016/j.annals.2004.03.001.

DOI

28
Steiniger S, Weibel R , 2007. Relations among map objects in cartographic generalization. Cartography & Geographic Information Science, 34(3):175-197. doi: 10.1559/152304007781697866.

DOI PMID

29
Tang W W, Feng W P, Jia M J , 2015. Massively parallel spatial point pattern analysis: Ripley’s K function accelerated using graphics processing units. International Journal of Geographical Information Science, 29(3):412-439. doi: 10.1080/13658816.2014.976569.

DOI

30
Trakolis D , 2001. Local people’ perceptions of planning and management issues in Prespes Lakes National Park, Greece. Journal of Environmental Management, 61(3):227. doi: 10.1006/jema.2000.0410.

DOI PMID

31
Voorhis C R W V, Morgan B L , 2007. Understanding power and rules of thumb for determining sample sizes. Tutorials in Quantitative Methods for Psychology, 3(2):43-50. doi: 10.20982/tqmp.03.2.p043.

DOI

32
Wang F, Zhang X L, Yang Z P et al., 2014. Analysis on spatial distribution characteristics and geographical factors of Chinese National Geoparks. Central European Journal of Geosciences, 6(3):279-292. doi: 10.2478/s13533-012-0184-x.

DOI

33
Wang G Y, Innes J L, Wu S W et al., 2012. National park development in China: Conservation or commercialization? Ambio, 41(3):247. doi: 10.1007/s13280-011-0194-9.

DOI

34
Wang H C , 2010. Chinese Cultural Geography. Wuhan: Central China Normal University Press: 171. (in Chinese)

35
Wang J A , 2004. Atlas of China. Beijing: Sino Maps Press. (in Chinese)

36
Wang L Y, Chen A Z, Gao Z F , 2011. An exploration into a diversified world of national park systems: China’s prospects within a global context. Journal of Geographical Sciences, 21(5):882-896. doi: 10.1007/s11442-011-0887-9.

DOI

37
Wells S , 2009. Protected areas of the world: A review of national systems, compiled by the world conservation monitoring centre and IUCN, in co-operation with British petroleum. Oryx, 26(4):200-238. doi: 10.1017/S0030605300023796.

38
Yang R , 2014. Nine pairs of relations in the construction of China National Park. Chinese Gardens, 30(8):5-8. (in Chinese)

39
Yang Y T, Yang S , 2015. Applying a spatial decision support system to the integrated regional planning of China. Environment & Planning B Planning & Design, 42(6):2985-2991. doi: 10.1177/0265813515603858.

DOI PMID

40
Yitzhaki S , 1979. Relative deprivation and the Gini coefficient. Quarterly Journal of Economics, 93(2):321-324. doi: 10.2307/1883197.

DOI PMID

41
Yitzhaki S , 1983. On an extension of the Gini Index. International Economic Review, 24(3):617-628.

DOI PMID

42
Zhang L Q, Peng J, Liu Y X et al., 2017. Coupling ecosystem services supply and human ecological demand to identify landscape ecological security pattern: A case study in Beijing-Tianjin-Hebei region, China. Urban Ecosystems, 20(3):1-14. doi: 10.1007/s11252-016-0629-y.

DOI

43
Zhou D Q, Edward G R , 2011. National parks in China: Experiments with protecting nature and human livelihoods in Yunnan province, People’s Republic of China (PRC). Biological Conservation, 144(5):1314-1321. doi: 10.1016/j.biocon.2011.01.002.

DOI

44
Zhu C Q , 2014. Perspective on development of national park system in China. Biodiversity Science, 22(4):418-420. doi: 10.3724/SP.J.1003.2014.14133. (in Chinese)

DOI PMID

Outlines

/