Research Articles

Dynamics of shoreline and land reclamation from 1985 to 2015 in the Bohai Sea, China

  • DING Xiaosong 1, 3 ,
  • SHAN Xiujuan , 2, 3 ,
  • CHEN Yunlong 3 ,
  • JIN Xianshi 2, 3 ,
  • MUHAMMED Forruq Rahman 3, 4
Expand
  • 1. College of Marine Sciences, Shanghai Ocean University, Shanghai 201306, China
  • 2. Laboratory for Marine Fisheries Science and Food Production Processes; Pilot National Laboratory for Marine Science and Technology (Qingdao), Qingdao 266237, Shandong, China
  • 3. Key Laboratory of Sustainable Development of Marine Fisheries, Ministry of Agriculture and Rural Affairs; Shandong Provincial Key Laboratory of Fishery Resources and Eco-environment; Yellow Sea Fisheries Research Institute, Chinese Academy of Fishery Sciences, Qingdao 266071, Shandong, China
  • 4. College of Fisheries, Ocean University of China, Qingdao 266003, Shandong, China
Shan Xiujuan (1980–), PhD, E-mail:

Ding Xiaosong (1993–), MS Candidate, specialized in shoreline change and land reclamation. E-mail: d_xiaosong@163.com

Received date: 2018-05-29

  Accepted date: 2018-12-10

  Online published: 2019-12-06

Supported by

The National Basic Research Program (973 Program) of China, No(2015CB453303)

The Aoshan Scientific and Technical Innovation Program, No(2015ASKJ02-05)

The Special Fund of the Taishan Scholar Project and the “Aoshan Talent” Project()

Laboratory for Marine Fisheries Science and Food Production Processes()

Pilot National Laboratory for Marine Science and Technology (Qingdao), No(2017ASTCP-ES07)

Copyright

Copyright reserved © 2019. Office of Journal of Geographical Sciences All articles published represent the opinions of the authors, and do not reflect the official policy of the Chinese Medical Association or the Editorial Board, unless this is clearly specified.

Abstract

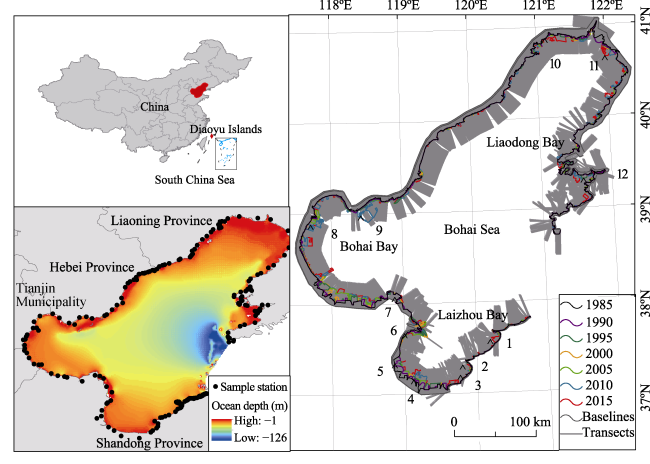
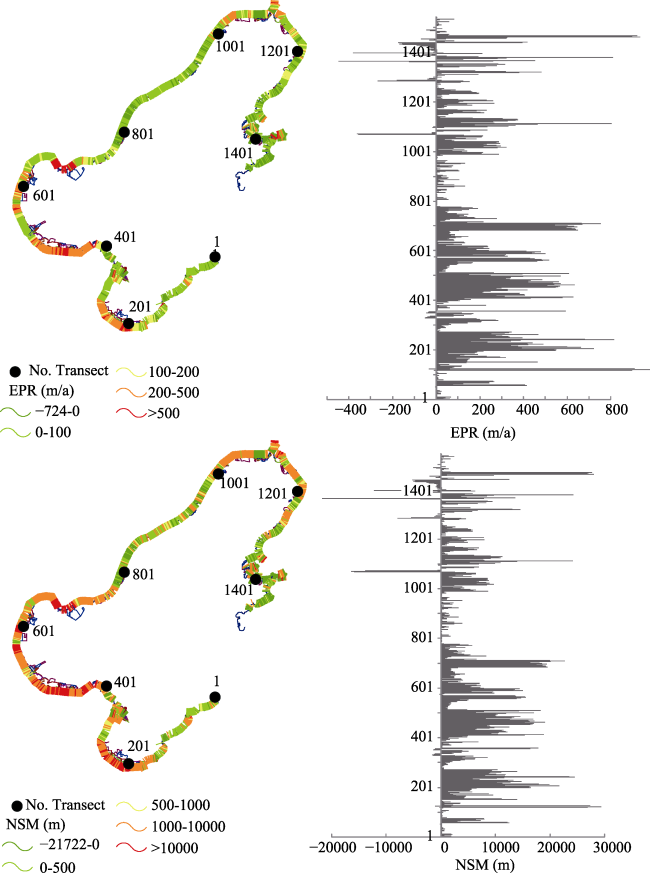
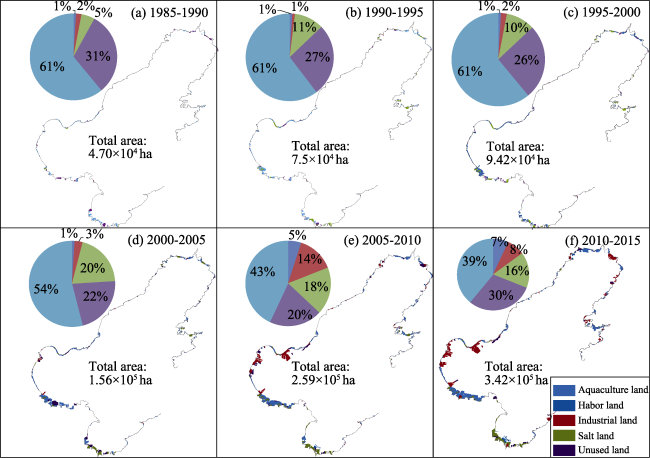
Extraction and analysis of the shoreline and land reclamation patterns are important for studies on topics such as the dynamics of coastal wetland ecological environments, transportation and exchange of material energy in coastal regions, and recruitment of fishery resources. Spatial-temporal variations in the shoreline and land reclamation in the Bohai Sea were analyzed based on 49 Landsat images of 7 periods from 1985 to 2015. The following conclusions were drawn. (1) The extracted shoreline data based on visual interpretation had high precision, and the shoreline extraction errors could be controlled within the theoretical range. (2) Over the past 30 years, the shoreline of the Bohai Sea has exhibited an average rate of change of 188.47 m/a and an average accretion distance of 3.55×10 3 m toward the sea. The fastest rate of shoreline change occurred in Laizhou Bay (134.78 m/a), followed by Bohai Bay (128.20 m/a) and Liaodong Bay (61.69 m/a). (3) The average rate of reclamation was 3.25×10 4 ha/a in the Bohai Sea, where the total area of aquaculture land, unused land, and salt land exceeded 60% of the total reclamation area. (4) The geometric shape of the bay became increasingly complicated from year to year, and the geometric center of gravity of the bay moved rapidly toward the sea. In addition, the area of the bay showed a significant decreasing trend. Therefore, to protect the function and structure of the ecosystem in coastal regions, we must control the scale and rate of land reclamation in the future.

Cite this article

DING Xiaosong , SHAN Xiujuan , CHEN Yunlong , JIN Xianshi , MUHAMMED Forruq Rahman . Dynamics of shoreline and land reclamation from 1985 to 2015 in the Bohai Sea, China[J]. Journal of Geographical Sciences, 2019 , 29(12) : 2031 -2046 . DOI: 10.1007/s11442-019-1703-1

1 Introduction

The rate of land reclamation in the coastal areas of China has increased over the past 30 years, and there has been rapid shoreline seaward accretion in these areas (Hou et al., 2014; Hou et al., 2016; Wang et al., 2014; Yue et al., 2016). Under the influence of reclamation activities, the proportions of natural shorelines and artificial shorelines, the type of land use/cover, and the shape of the bay and its center of gravity have all undergone significant changes in coastal regions. The use of shoreline and land reclamation to reconstruct the coastal zone can result in a relatively high economic dividend over a short period of time and promote rapid development of the socio-economy, but these activities have extreme adverse effects on the marine ecological environment (Allen, 1990; Zhu et al., 2016). Variations in shoreline and land reclamation will lead to weakened ecological service functions of the original coastal zone, result in fragmentation of fish spawning and breeding grounds, and influence recruitment of fishery resources (Ding et al., 2016; Wang et al., 2014; Yue et al., 2016).
Mesoscale spatial resolution remote sensing images are widely used in large-scale ecological investigations and studies of the coastal zone because of their large spatial coverage, short acquisition time, and low cost. Currently, sensors that use a wide range of mesoscale spatial resolution images mainly include Landsat, SPOT, and IKONOS. Landsat images have broad applications in extraction and analysis of shoreline and land reclamation patterns (Huang et al., 1994; Pardo-Pascual et al., 2012; Ning et al., 2018). At present, shorelines are mainly investigated at large spatial scales through visual interpretation (Pardo-Pascual et al., 2012; Feng et al., 2014; Wang et al., 2014; Hou et al., 2016). The interpretation of shoreline information by a researcher with reference to the spectral and texture features of the image results in high accuracy of the shoreline extraction and can meet the shoreline extraction accuracy requirements for different shoreline types (Gao, 2010; Gao, 2014; Hou et al., 2014; Wang et al., 2014). The difference between spectral and texture features will facilitate the extraction of different types of land reclamation patterns (Feng et al., 2014; Wang et al., 2014).
Although many studies have been conducted regarding shoreline/reclamation, the relationship between the shoreline and land reclamation has not been systematically studied in reclamation-intensive areas. The Bohai Sea is a semi-enclosed inland sea in China, and the economic activities in the coastal areas are relatively extensive. The intensity of land use and development in the coastal region is high, and reclamation activities around the sea are relatively dense. Consequently, the shape and structure of the bay have undergone considerable changes. The current limitations of shoreline studies of the Bohai Sea mainly include the following. (1) Shoreline study areas have been concentrated in areas with more intense land reclamation activities or areas of high ecological value (such as the Yellow River Delta, Bingang New City Area, Caofeidian Industrial Area.). There has been a lack of investigations on the overall characteristics and regularity of the different types of shorelines in the Bohai Sea at the macroscopic scale. (2) The variations in shoreline and land reclamation cannot be discussed as a whole. In the Bohai Sea area, reclamation projects are the main driving force behind shoreline changes (Peng et al., 2013; Yan et al., 2013; Hou et al., 2016; Meng et al., 2017). (3) Due to the dual influence of the shoreline and reclamation, the geometric shapes of the bay are expected to change greatly, and previous studies have failed to study the relationship between shoreline/land reclamation and the shape of the bay.
Based on 49 Landsat images from 1985 to 2015, shoreline and land reclamation information of the Bohai Sea was extracted. The principles of cartography and remote sensing were used to evaluate the accuracy of the spatial position of the shoreline. The end point rate/net shoreline movement (EPR/NSM) indicators were used to study the spatial-temporal changes in the shoreline. The types and areas of reclamation activities will be discussed. The geometric attributes of the shape were studied by using the shape index of the bay (SIB) and the geometric center of gravity over the past 30 years.

2 Materials and methods

2.1 Study area

The Bohai Sea is a semi-enclosed inland sea (37°07°-41°00°N, 117°35°-121°10°E) in China that includes “three bays and one delta”, namely, Laizhou Bay, Bohai Bay, Liaodong Bay, and the Yellow River Delta (Figure 1). The underlying surface is complex and diverse. The Bohai Sea is an important spawning ground, breeding ground, and feeding ground of the fishery resources in China (Fei et al., 1990; Zhang et al., 2007; Gao et al., 2015).
Figure 1 The spatial location of the study area and the locations of the spatial sampling points and the transects

*Land use in the coastal area: 1. Longkou Bay, 2. Diaolongzui Area, 3. Qinlingpu Aquaculture Area, 4. Weifang Harbor, 5. Zimai River, 6. Dazuigou Area, 7. Yellow River Harbor, 8. Bingang New City Area, 9. Caofeidian Industrial Area, 10.Jinzhou Harbor, 11. Yingkou Harbor, and 12. Pulandian Bay.

The Bohai Sea is surrounded by Liaoning Province, Hebei Province, Tianjin Municipality, and Shandong Province. Socio-economic activities are frequent, and utilization and development are common in the coastal areas. The area has been affected by increasing population and urban land use pressure. Thus, land reclamation activities have been rapidly carried out in the coastal areas, resulting in the rapid loss of the original ecological functions and structures (Zhang et al., 2007; Gao et al., 2009; Hou et al., 2016).

2.2 Satellite data

Landsat images used in the paper were from the official website of the US Geological Survey (http://glovis.usgs.gov/). Images with less than 10% cloud cover were selected. The time period was 1985 to 2015, with an interval of 5 years, and a total of 49 images were used for the analyses.
The preprocessing of the Landsat images mainly included radiation correction, geometric correction and coordinate transformation. The error of the geometric precision correction was controlled to within 1 pixel. When the shoreline was extracted based on Landsat images with a spatial resolution of 30 m, the tide-induced interpretation error was generally less than 1 pixel; therefore, no tidal range correction was needed (Guariglia et al., 2006; Hou et al., 2014; Hou et al., 2016). Before extraction of the shoreline, the scale of the image was fixed at 1:20,000, and the standard false-color composite image was used as the base map for expert visual interpretation. The shoreline errors were evaluated by using control points that were selected in Google Earth (GE). The EPR/NSM indexes were used to calculate the spatial-temporal changes of the shoreline, and the changes in the bay geometry were studied by using the SIB. All processes were conducted with ENVI 5.2 software, ArcGIS 10.1 software, and R language software.

2.3 Evaluation of shoreline accuracy

According to the principles of cartography and remote sensing information extraction (Gao, 2010; Hou et al., 2014), the relationship between the shoreline uncertainty and spatial resolution is as follows:
$P=\frac{2\sqrt{2}}{3}\times R$
where P denotes the shoreline uncertainty, i.e., theoretical error, and R denotes the spatial resolution of the image. According to the above formula, the theoretical error of the shoreline information extracted by the Landsat TM/ETM+/OLI image is 28.28 m.

2.4 Indicators of shoreline changes

The end point rate (EPR) is the rate of change in a shoreline over two periods (Thieler et al., 2009;Joesidawati et al., 2016). The EPR can be used to directly calculate the rate of change between two shoreline positions; however, some local information will be ignored (such as local erosion rate and local change cycle) in the analysis of changes in multiple shorelines. The formula is as follows (Crowell et al., 1991; Dolan et al., 1991):
${{E}_{\left( i,j \right)}}=\frac{{{d}_{j}}-{{d}_{i}}}{\Delta {{Y}_{\left( j,i \right)}}}$
where i denotes the coordinate position of the shoreline intersected by the transects in the earlier year and j denotes the coordinate position of the shoreline intersected by transects in the more recent year. E(i, j) denotes the rate of the shoreline change from the earlier year to the more recent year, i.e., the EPR. di and dj denote the distances from the baseline to the shoreline of the earlier year and the shoreline of the more recent year, respectively. ΔY(j,i) denotes the time interval between the earlier year and the more recent year.
The net shoreline movement (NSM) is the distance of spatial movement of a shoreline between two periods. The NSM is mainly used to calculate the net shoreline movement distance between two shorelines extracted by transects (Thieler et al., 2009; Schwimmer, 2008). The formula is as follows:
$NSM={{D}_{oldest}}-{{D}_{youngest}}$
where NSM denotes the distance between the two shorelines, Doldest denotes the distance from the baseline to the shoreline of the earlier year, and Dyoungest denotes the distance from the baseline to the shoreline of the more recent year.

2.5 Shape index of the bay (SIB)

The study of the bay geometry focuses on the change in shape, which is primarily calculated by using the SIB (Liu, 2000; Hou et al., 2014). The formula is as follows:
$SIB=\frac{P}{2\sqrt{\pi A}}$
where SIB denotes the shape index of the bay, P denotes the perimeter of the bay, and A denotes the area of the bay. The smaller the SIB, the closer the shape is to a circle and the simpler the geometry of the bay; conversely, the larger the SIB, the more complex the shape.
The study of the geometric center of gravity of the bay focuses on the change in distance in different periods (Li et al., 2005; Hou et al., 2014). The geometric center of gravity of the bay and its movement distance are calculated as follows:
$x=\frac{\mathop{\sum }_{i=1}^{n}{{x}_{i}}}{n},\ y=\frac{\mathop{\sum }_{i=1}^{n}{{y}_{i}}}{n}$
$L=\sqrt{{{\left( {{x}_{j}}-{{x}_{i}} \right)}^{2}}+{{\left( {{y}_{j}}-{{y}_{i}} \right)}^{2}}}$
where (x, y) denotes the coordinates of the geometric center of the bay and L denotes the distance between the two geometric centers of gravity.

2.6 Extraction of land reclamation patterns

This study used a visual interpretation of the shoreline in 1985 as a reference and the area in the sea direction as the predetermined reclamation area to retrieve the reclamation information for each phase. On this basis, the unused land, salt land, industrial land, harbor land and aquaculture land in the Bohai Sea for six periods (1985-1990, 1990-1995, 1995-2000, 2000-2010, and 2010-2015) were extracted and statistical data on the spatial-temporal changes in the reclamation area were collected.

3 Results

3.1 The evaluation of shoreline precision

A total of 220 control coordinate sites that covered all shoreline types were collected from GE to verify the accuracy of the visual interpretation of the shoreline (Figure 1). The results (Table 1) showed that the accuracy of the shoreline extraction in the study was controlled within the theoretical maximum error (28.8 m). Overall, the average error was 18.65 m, the standard deviation (SD) was 17.46 m, and the root mean square error (RMSE) was 18.45 m. The precision of the shoreline extraction had a tendency to increase year to year. The average shoreline accuracy was the highest in 2015 (17.51 m) and the lowest in 1985 (19.46 m).
Table 1 Shoreline accuracy evaluation results of the Bohai Sea
Years 1985 1990 1995 2000 2005 2010 2015
Sample points 105 113 125 129 144 157 157
Average error(m) 19.46 19.72 19.08 18.77 18.49 17.51 17.51
SD (m) 17.67 17.95 17.90 17.38 17.30 17.01 17.01
RMSE (m) 19.46 19.72 19.08 18.77 18.49 17.51 17.51
Max. theoretical error (m) 28.28 28.28 28.28 28.28 28.28 28.28 28.28

3.2 Spatial-temporal variations in the shoreline

The shoreline of the Bohai Sea has accreted over the last 30 years (Table 2 and Figure 2). The average rate of change was 188.47 m/a, and the average NSM was 3.55×10³ m. The coefficient of variation (CV) of the shoreline was 0.65. The sections of shoreline with fast growth rates were concentrated in southern Laizhou Bay (Weifang Harbor Area), eastern Bohai Bay (Yellow River Harbor, northern Bingang New City Area, and Caofeidian Industrial Area) and Liaodong Bay (Jinzhou Harbor, Yingkou Harbor and Pulandian Bay). The greatest overall change in the shoreline occurred in Bohai Bay, followed by Laizhou Bay, and the smallest change occurred in Liaodong Bay.
The shoreline of Laizhou Bay showed a trend of accreting toward the sea and exhibited the fastest average change (134.78 m/a) in the Bohai Sea area; the average NSM was 4.04×10³ m, and the maximum rate was 781.37 m/a. The maximum NSM was 2.93×10⁴ m, the maximum erosion rate of the shoreline was -10.79 m/a, the maximum erosion distance of the shoreline was -1.60×10³ m, and the CV of the shoreline was 0.83.
Table 2 Shoreline changes in different areas of the Bohai Sea from 1985 to 2015
Regions Bohai Sea Laizhou Bay Bohai Bay Liaodong Bay
Range of transects 1-1587 1-375 376-770 771-1587
Number of transects 1587 375 394 807
Average annual change (m/a) 188.47 134.78 128.20 61.69
Average movement (1×10³ m) 3.55 4.04 6.55 1.85
Max.accretion rate (m/a) 976.67 781.37 753.37 482.33
Max.movement(1×10⁴ m) 2.93 2.93 2.26 2.80
Min. decrease (m/a) -462.46 -10.79 -53.49 -462.46
Min. movement(1×10³ m) -16.42 -1.60 -0.32 -16.42
CV 0.65 0.83 1.09 0.42
Figure 2 EPR and NSM of the Bohai Sea from 1985 to 2015
The shoreline of Bohai Bay had a tendency to accrete toward the sea with an average rate of 128.2 m/a, an average NSM of 6.56×10³ m, and a maximum rate of 753.37 m/a in the area. The maximum NSM was 2.26×10⁴ m, the maximum erosion rate of the shoreline was -53.49 m/a, the maximum erosion distance of the shoreline was -0.32×10³ m, and the CV of the shoreline was 1.09.
The shoreline of Liaodong Bay showed a trend of accretion toward the sea, and the average shoreline change rate and NSM were the lowest (61.69 m/a and 1.85×10³ m, respectively) in the entire Bohai Sea area. The maximum rate of shoreline change was 482.33 m/a, and the maximum NSM was 2.80×10⁴ m. The maximum shoreline erosion rate was -462.46 m/a, and the maximum erosion distance of shoreline was -16.42×10³ m. The CV of the shoreline was 0.42, and the CV of Liaodong Bay was the lowest of all the areas in the Bohai Sea.
To study the regularity of the rate of shoreline change in different periods, four time intervals (5 years, 10 years, 15 years, and 30 years) were set to compare the characteristics of the shoreline changes in different periods (Figure 3). Overall, the rate of shoreline change showed a tendency of accelerating accretion year to year.
Over the past 30 years, the rate of shoreline change in Bohai Bay was the fastest in the Bohai Sea. While some estuarine areas showed erosion trends, other shorelines showed more stable rates of accretion toward the sea. The rates of change in different periods showed that the internal variations of the shoreline showed a significant eroding trend; that is, the shoreline has shown a pattern of rapid growth toward the sea.
The rate of shoreline change in Laizhou Bay showed that the shoreline changes were spatially concentrated. In the southern part of Laizhou Bay, the shoreline changes in the Zimai River-Diaolongzui Section were more common because of the frequent reclamation activties such as those in Weifang Harbor, Xingang Harbor, Haimiao Harbor, and the Qinglinpu Aquaculture Area. The areas that exhibited significant differences in the rates of shoreline change were mainly located near the Yellow River Delta. These areas exhibited high spatial variability in the rate of shoreline change, which was related to the regulation of water and sediment and the hydrodynamic environment in the estuary delta.
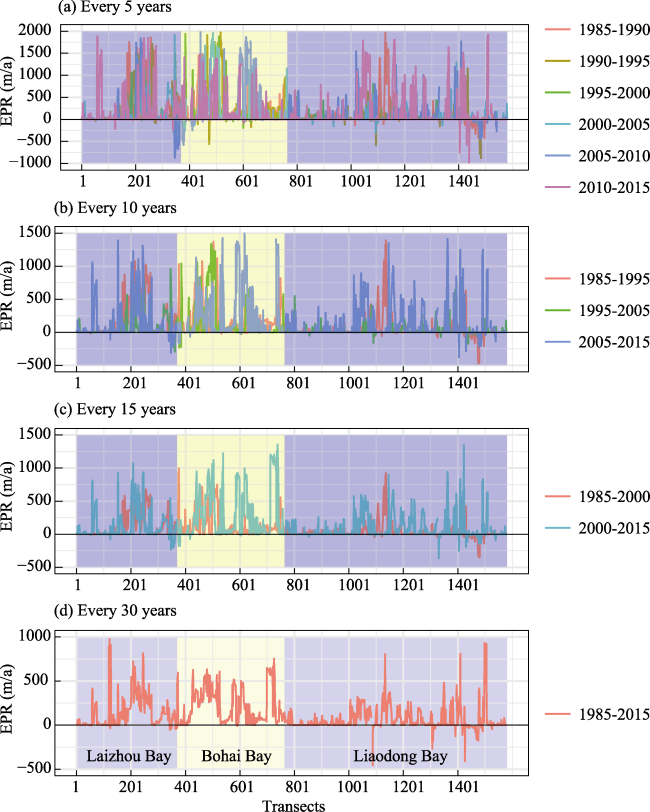
Figure 3 Rates of spatial-temporal changes in different cycles in the Bohai Sea from 1985 to 2015
The rate of shoreline change in Liaodong Bay showed a tendency of accretion toward the sea. The areas with greater high were concentrated in the areas of Panjin Harbor-Yingkou Harbor and Pulandian Bay; the areas with relatively stable changes were mainly concentrated in the southwest of Panjin Harbor. The rate of change showed a trend of increasing year to year, and the differences in the spatial changes also showed a declining tendency.

3.3 Spatial-temporal variations of land reclamation

From 1985 to 1990, the total area of land reclamation in the Bohai Sea was 4.70×10⁴ ha. Aquaculture land accounted for 61% of the total area, while unused land accounted for 31% of the total area. The reclamation activities were mainly distributed in the south of Laizhou Bay and southeastern Bohai Bay. In addition, sporadic land reclamation was found in the northern part of Liaodong Bay. From 1985 to 1990, the total reclamation area in the Bohai Sea was 7.51×10⁴ ha. Aquaculture land accounted for 61% of the total area, while unused land accounted for 27%. Compared with the previous phase of decline, salt land accounted for 11% of the total area, and the salt land area underwent rapid accretion. The accretion areas were mainly distributed in the south of Laizhou Bay and the southeast and west of Bohai Bay, and they were sporadically distributed in the northern parts of Liaodong Bay and Pulandian Bay. From 1995 to 2000, the total reclamation area in the Bohai Sea was 9.42×10⁴ ha. Aquaculture land accounted for 61% of the total area, unused land accounted for 26%, and salt land accounted for 10%. The reclamation activities were mainly distributed in Bohai Bay and southern Laizhou Bay. In addition, the reclamation activities were concentrated in the northern part of Liaodong Bay and Pulandian Bay. From 2000 to 2005, the total area of reclamation in the Bohai Sea was 15.61×10⁴ ha. Aquaculture land accounted for 54% of the total area, unused land accounted for 22%, and salt land accounted for 20%. The reclamation activities were mainly located in the southern and southwestern parts of Bohai Bay and Laizhou Bay. In addition, there was a small concentration of reclamation activities in the northern Liaodong Bay and Pulandian Bay. From 2005 to 2010, the total area of reclamation in the Bohai Sea was 25.93×10⁴ ha. Aquaculture land accounted for approximately 43% of the total area, unused land accounted for 20%, salt land accounted for 18%, and industrial land area accreted rapidly, accounting for 14% of the total area. There was a high density of reclamation activities in Bohai Bay and the southern and southwestern parts of Laizhou Bay. There was a contiguous distribution of reclamation activities in the northern parts of Liaodong Bay and Pulandian Bay. From 2010 to 2015, the total area of reclamation in the Bohai Sea was 34.21×10⁴ ha. Aquaculture land accounted for 39% of the total area, unused land accounted for 30%, salt land accounted for 10%, and industrial land and harbor areas accreted rapidly, accounting for 15% of the total area.
Over the past 30 years, reclamation has rapidly increased (Table 3 and Figure 4). Reclamation projects entered a new period in 2000 when all types of reclamation projects were widely distributed. Before 2000, reclamation projects for aquaculture land, unused land, and salt land accounted for more than 90% of the total area and were spatially concentrated in the south of Laizhou Bay and southeastern Bohai Bay. After 2000, there were rapid accretions of salt land, industrial land, and harbor land, and aquaculture land, and unused land accounted for more than 60% of the reclamation area. The reclamation activities were most intense in Bohai Bay, followed by Laizhou Bay and finally Liaodong Bay.
Table 3 Areas and proportions of different land reclamation types in the Bohai Sea from 1985 to 2015
Time Period Type Area Proportion Total area
(1×10³ ha) (%) (1×10⁴ ha)
1985-1990 Harbor land 0.44 0.93 4.70
Industrial land 0.88 1.88
Salt land 1.47 31.27
Reclamation land 28.74 61.13
Aquaculture land 2.26 4.80
1990-1995 Harbor land 0.67 0.90 7.51
Industrial land 0.51 0.68
Salt land 8.35 11.12
Reclamation land 4.56 60.72
Aquaculture land 19.96 26.58
1995-2000 Harbor land 2.01 2.13 9.42
Industrial land 0.71 0.75
Salt land 9.86 10.47
Reclamation land 57.34 60.89
Aquaculture land 24.25 25.75
2000-2005 Harbor land 4.38 2.80 15.61
Industrial land 2.27 1.45
Salt land 33.71 21.58
Reclamation land 84.41 54.04
Aquaculture land 31.44 20.13
2005-2010 Harbor land 12.96 5.00 25.93
Industrial land 52.8 20.36
Salt land 35.4 13.65
Reclamation land 112.67 43.45
Aquaculture land 45.48 17.54
2010-2015 Harbor land 22.26 6.51 34.21
Industrial land 102.42 29.94
Salt land 27.37 8.00
Reclamation land 134.94 39.45
Aquaculture land 55.07 16.10
Figure 4 Spatial-temporal distributions and proportions of different types of reclamation projects in the Bohai Sea from 1985 to 2015

3.4 The SIB of the bay

The shoreline of the Bohai Sea was affected by reclamation activities and rapidly accreted toward the sea. Moreover, the geometry of the bay became more complicated, the area of the bay rapidly declined, and the length of the shoreline increased (Table 4 and Figure 5). Over the past 30 years, the area of the Bohai Sea dropped sharply from 6.42×10⁶ ha in 1985 to 6.03×10⁶ ha in 2015. The length of the Bohai Sea shoreline increased from 2.30×10⁶ km in 1985 to 3.16×10⁶ km in 2015, and the SIB increased rapidly from 2.56 in 1985 to 3.63 in 2015. The area of Laizhou Bay rapidly decreased from 1.07×10⁶ ha in 1985 to 1.00×10⁶ ha in 2015. The length of the Laizhou Bay shoreline rapidly increased from 4.53×10⁵ km in 1985 to 5.92×10⁵ km in 2015, and the SIB increased rapidly from 1.23 in 1985 to 1.69 in 2015. The area of Bohai Bay rapidly decreased from 1.93×10⁶ ha in 1985 to 1.74×10⁶ ha in 2015. The length of the Bohai Bay shoreline rapidly increased from 5.67×10⁵ km in 1985 to 9.61×10⁵ km in 2015, and the SIB increased rapidly from 1.15 in 1985 to 2.05 in 2015. The area of Liaodong Bay rapidly decreased from 3.42×10⁶ ha in 1985 to 3.31×10⁶ ha in 2015. The length of the Liaodong Bay shoreline rapidly increased from 1.28×10⁶ km in 1985 to 1.61×10⁶ km in 2015, and the SIB increased rapidly from 1.95 in 1985 to 2.50 in 2015.
Table 4 Areas and shoreline lengths of the three bays in the Bohai Sea from 1985 to 2015
Regions Bohai Sea Laizhou Bay Bohai Bay Liaodong Bay
Years Length
(1×10⁶ km)
Area
(1×10⁶ ha)
Length
(1×10⁵ km)
Area
(1×10⁶ ha)
Length
(1×10⁵ km)
Area
(1×10⁶ ha)
Length
(1×10⁶ km)
Area
(1×10⁶ ha)
1985 2.30 6.42 4.53 1.07 5.67 1.93 1.28 3.42
1990 2.41 6.35 4.59 1.04 6.11 1.90 1.34 3.41
1995 2.44 6.29 4.35 1.02 6.71 1.88 1.33 3.39
2000 2.47 6.27 4.21 1.02 7.16 1.87 1.34 3.38
2005 2.64 6.20 5.40 1.00 7.24 1.83 1.38 3.37
2010 3.04 6.11 5.64 1.00 9.65 1.77 1.51 3.35
2015 3.16 6.03 5.92 1.00 9.61 1.74 1.61 3.31
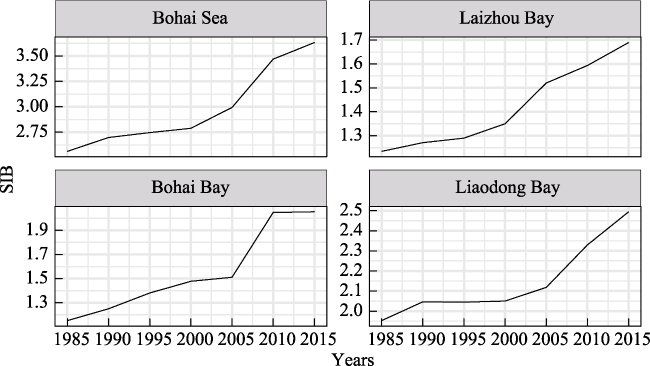
Figure 5 Variations in the shape index of the bay (SIB) in the Bohai Sea from 1985 to 2015
Over the past 30 years, the length of the shoreline of the Bohai Sea has shown an increasing trend, while the area has shown a pattern of shrinkage. Additionally, the geometry of the bay has become increasingly complex. The changes in the shoreline and bay area of the Bohai Bay are the most obvious and are closely related to the development of the Beijing-Tianjin-Hebei Economic Zone in coastal projects such as Tianjin Bingang New City, Hebei Caofeidian and other reclamation projects. As the largest bay in the Bohai Sea, the shoreline and bay area of Liaodong Bay have undergone substantial changes, and the complexity of the bay has changed the most. In contrast, Laizhou Bay has experienced the smallest changes in the shoreline and bay area.

3.5 The geometric center of gravity of the bay

The bay was affected by variations in shoreline and land reclamation and showed a general tendency of shifting from the southwest to the northeast (Figure 6). After 2005, the geometric center of gravity showed a shift to the northeast. The greatest changes in the geometric center of gravity occurred in 2000-2005 and 2005-2010 (883.96 m and 920.61 m, respectively). The geometric center of gravity of Laizhou Bay moved from the southwest to the northeast, with the largest movement distance occurring from 1985 to 1990 (1,802.94 m). The geometric center of gravity of Bohai Bay generally showed a trend of northeast-east migration, with a significant east-southeastward movement after 2005, which was closely related to the reclamation activities in the Bingang New City Area and Tianjin Caofeidian Industrial Area and other regions. The geometric center of gravity of Bohai Bay exhibited the greatest changes from 2000 to 2005 and from 2005 to 2010 (1,140.42 m and 1,731.54 m, respectively). Over the past 30 years, the geometric center of gravity of Liaodong Bay has shown a trend of moving from the northeast to the southwest. The geometric center of graity moved substantially from1985 to 1990 and from 2010 to 2015 (869.64 m and 897.71 m, respectively).
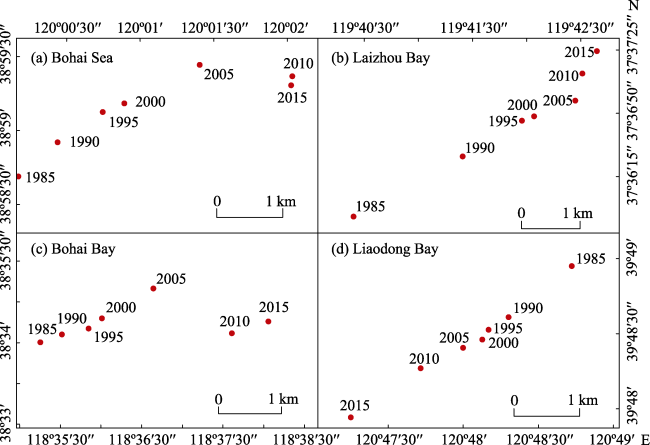
Figure 6 Geometric center of the gravity in the Bohai Sea from 1985 to 2015

4 Discussion

4.1 Relationship between variations in shoreline and land reclamation

Shoreline changes are affected by both natural and human activities. In areas where human activities are less prominent, shoreline changes are mainly affected by natural factors, such as rising sea level, runoff, suspended sediment in rivers, the hydrodynamic environment of estuaries, and other factors that control shoreline erosion and accretion directly (Ding et al., 2016; Ning et al., 2018). In areas with high levels of human activity, coastal shoreline changes are directly affected by coastal engineering facilities, including mangrove planting, dam protection, and reclamation projects (Azami et al., 2013; Benzeev et al., 2017; Meng et al., 2017). Land reclamation has a positive effect on the shoreline erosion rate. Allen (1990) indicated that in addition to the effects of changes in runoff, sediment content, dynamics, and other factors, estuary shoreline changes are affected by reclamation projects during human activities in the estuary region. Zhu et al. (2016) studied the relationship between the shoreline and land reclamation in the Yangtze River Delta region and indicated that land reclamation is the main cause of rapid decline in wetland resources. Affected by urban expansion and population pressure, a series of coastal zone environmental projects represented by reclamation activities have been launched in the coastal area of the Bohai Sea (Peng et al., 2013; Yan et al., 2013). The reclamation projects not only rapidly altered the structure and function of the original shoreline but also profoundly affected the hydrodynamic environment of coastal wetlands (Meng et al., 2017; Li et al., 2017).
The shoreline length was increased and the land area expanded into the Bohai Sea by approximately 611.81 km and 188.30 km2, respectively, from 1993 to 2013 (Li et al., 2015). The coastline growth rate of the Bohai Sea was high during 2010 and 2012 and slowed after 2013 (Wu et al., 2018). The shoreline exhibited an average rate of change of 188.47 m/a and an average accretion distance of 3.55×10³ m toward the sea, and the average rate of reclamation was 3.25×10⁴ ha/a from 1985 to 2015. This study also found that the significant changes in coastal areas were mainly concentrated in reclamation-intensive areas. Aquaculture land, salt land, and unused land are widely distributed in the coastal area of the Bohai Sea, whereas harbor land and industrial land are concentrated in high-income areas (Figures 1 and 2). In addition, except in the Yellow River Delta, the geometric shapes of other estuarine and delta regions are more affected by reclamation projects. The findings of this study demonstrate that the rate and direction of shoreline changes are a reflection of changes in the reclamation activities on a spatial-temporal scale in the Bohai Sea.

4.2 Reasons for variations in the geometric shape of the bay

The change in the geometric center of gravity of the bay is positively related to the growth rate of the shoreline and the complexity of the shoreline geometry; that is, faster shoreline changes correspond to a greater rate of change in the geometric center of gravity of the bay in space (Lai et al., 2015; Li et al., 2010; Snoussi et al., 2008). Among the coastal areas where socioeconomic activities are more concentrated, the change in the bay shape is mainly affected by reclamation activities (Thanikachalam et al., 2003). After studying the changing features of the structure, development and utilization of the Chinese shoreline, Hou et al. (2016) reported that human activity mainly involving land reclamation has far exceeded natural factors and has become the dominant factor, especially in recent decades.
Over the last 30 years, the bay area, shoreline length, geometric shape, and center of gravity have changed rapidly (Table 3, Figures 5 and 6). The rapid decrease in the bay area, the rapid increase in shoreline length, the increase in the complexity of the geometry, and the rapid shift in the center of gravity of the bay toward the sea have become the primary characteristics of the Bohai Sea.
From the perspective of a longer time scale, the transition point for the changes in the variations of the shoreline, land reclamation, and SIB occurred in 2000. The variations in shoreline and land reclamation of the Bohai Sea increased rapidly after 2000. Thus, the complexity of the geometric shape of the Bohai Sea also increased rapidly after 2000 (Figures 3-5). The intensity and density of human activities in the Bohai Sea have rapidly increased since 2000, and the reclamation activities have entered a new stage.

5 Conclusions

In this paper, the spatial-temporal variations in the shoreline and shoreline reclamation in the Bohai Sea were analyzed based on 49 Landsat images of seven periods from 1985 to 2015, and several conclusions can be drawn.
(1) The shoreline of the Bohai Sea has shown a significant accretion trend over the last 30 years due to the influence of human activities in the coastal area. The rates of change in different periods showed that the internal variations of the shoreline exhibited a significant eroding trend; that is, the characteristics of shoreline accretion toward the sea have become increasingly stable.
(2) Based on the changes in reclamation activities, the reclamation project in the Bohai Sea has exhibited a significant growth trend since 2000, when aquaculture land, unused land and salt land exceeded 60% of the total reclamation area. At the same time, the areas of harbor land and industrial land rapidly increased.
(3) Under the dual influence of shoreline change and reclamation activities, the shape of the Bohai Sea became more complicated and the geometric center of gravity of the bay moved rapidly to the central part of the Bohai Sea.
1
Allen J R L, Allen J R L , 1990. Late Flandrian shoreline oscillations in the Severn estuary: Change and reclamation at Arlingham, Gloucestershire. Philosophical Transactions of the Royal Society A Mathematical Physical & Engineering Sciences, 330(1613):315-334.

DOI PMID

2
Azami K, Fukuyama A, Asaeda T et al., 2013. Conditions of establishment for the Salix, community at lower-than-normal water levels along a dam reservoir shoreline. Landscape and Ecological Engineering, 9(2):227-238.

DOI

3
Benzeev R, Hutchinson N, Friess D A et al., 2017. Quantifying fisheries ecosystem services of mangroves and tropical artificial urban shorelines. Hydrobiologia, 803(1):225-237.

DOI

4
Crowell M, Leatherman S P, Buckley M K , 1991. Historical shoreline change: Error analysis and mapping accuracy. Journal of Coastal Research, 7(3):839-852.

5
Ding L, Yang H, Dai X et al., 2016. Niche analysis of dominant species of fishery resources in Zhejiang Oufei reclamation area. Journal of Shanghai Ocean University, 25(1):116-123. (in Chinese)

6
Ding Y, Wei H , 2016. Modeling the impact of land reclamation on storm surges in Bohai Sea, China. Natural Hazards, 85(1):559-573.

DOI

7
Dolan R, Fenster M S, Holme S J , 1991. Temporal analysis of shoreline recession and accretion. Journal of coastal research, 7(3):723-744.

8
Fei Z, Mao X, Zhu M et al., 1990. The study of productivity in the Bohai Sea-II: Primary productivity and estimation of potential fish catch. Acta Oceanologica Sinica, 9(2):303-313.

9
Feng L, Zhu X, Sun X , 2014. Assessing coastal reclamation suitability based on a fuzzy-AHP comprehensive evaluation framework: A case study of Lianyungang, China. Marine Pollution Bulletin, 89(1/2):102-111.

DOI PMID

10
Gao S , 2010. Analysis of Interpretation quality of remote sensing image for railway engineering geology. Journal of Railway Engineering Society, 27(8):25-28, 37. (in Chinese)

11
Gao W B, Liu X Z, Duan Y Y et al., 2009. Impact of the sea reclamation on fishery resources in Liaoning offshore and corresponding counter measures. Journal of Dalian Fisheries University, 24(Suppl.1):163-166. (in Chinese)

12
Gao X, Zhuang W, Chen C T et al., 2015. Sediment quality of the SW coastal Laizhou Bay, Bohai Sea, China: A comprehensive assessment based on the analysis of heavy metals. Plos One, 10(3):1-27.

DOI PMID

13
Gao Z Q, Liu X Y, Ning J C et al., 2014. Analysis on changes in coastline and reclamation area and its causes based on 30-year satellite data in China. Transactions of the Chinese Society of Agricultural Engineering, 30(12):140-147. (in Chinese)

14
Guariglia A, Buonamassa A, Losurdo A et al., 2006. A multisource approach for shoreline mapping and identification of shoreline changes. Annals of Geophysics, 49(1):295-304.

15
Hou X Y, Hou W, Wu T , 2016. Shape changes of major gulfs along the mainland of China since the early 1940s. Acta Geographica Sinica, 71(1):118-129. (in Chinese)

DOI

16
Hou X Y, Wu T, Hou W et al., 2016. Characteristics of coastline changes in mainland China since the early 1940s. Science China Earth Sciences, 59(9):1791-1802.

DOI

17
Hou X Y, Wu T, Wang Y D et al., 2014. Extraction and accuracy evaluation of multi-temporal shorelines of mainland China since 1940s. Marine Sciences, 38(11):66-73. (in Chinese)

18
Huang H, Guo J , 1994. Application of Landsat images to the studies of the shoreline changes of changes of the Huanghe River delta. Marine Geology & Quaternary Geology, 14(2):29-37. (in Chinese)

DOI PMID

19
Lai S, Loke L H L, Hilton M J et al., 2015. The effects of urbanization on coastal habitats and the potential for ecological engineering: A Singapore case study. Ocean & Coastal Management, 103:78-85.

DOI PMID

20
Li X, Damen M C J , 2010. Coastline change detection with satellite remote sensing for environmental management of the Pearl River Estuary, China. Journal of Marine Systems, 82:S54-S61.

DOI

21
Li X, Kang Y, Wan S et al., 2017. Effect of ridge planting on reclamation of coastal saline soil using drip-irrigation with saline water. Catena, 150:24-31.

DOI

22
Li Y, Wang Q, Guo P et al., 2015. Shoreline succession during recent 20 years in the Bohai Sea and the strategies for the development and utilization. Transactions of Oceanology and Limnology, ( 3):32-38. (in Chinese)

23
Liu X L , 2000. Shape index and its ecological significance in salinized meadow landscape. Pratacultural Science, 17(1):50-56.

24
Meng W, Hu B, He M et al., 2017. Temporal-spatial variations and driving factors analysis of coastal reclamation in China. Estuarine Coastal & Shelf Science, 191:39-49.

DOI PMID

25
Ning J, Liu J, Kuang W et al., 2018. Spatiotemporal patterns and characteristics of land-use change in China during 2010-2015. Journal of Geographical Sciences, 28(5):547-562.

DOI

26
Pardo-Pascual J E, Almonacid-Caballer J, Ruiz L A et al., 2012. Automatic extraction of shorelines from Landsat TM and ETM+ multi-temporal images with subpixel precision. Remote Sensing of Environment, 123:1-11.

DOI

27
Peng S, Zhou R, Qin X et al., 2013. Application of macrobenthos functional groups to estimate the ecosystem health in a semi-enclosed bay. Marine Pollution Bulletin, 74(1):302-310.

DOI

28
Snoussi M, Ouchani T, Niazi S , 2008. Vulnerability assessment of the impact of sea-level rise and flooding on the Moroccan coast: The case of the Mediterranean eastern zone. Estuarine, Coastal and Shelf Science, 77(2):206-213.

DOI

29
Thanikachalam M, Ramachandran S , 2003. Shoreline and coral reef ecosystem changes in Gulf of Mannar, southeast coast of India. Journal of the Indian Society of Remote Sensing, 31(3):157-173.

DOI

30
Thieler E R, Himmelstoss E A, Zichichi J L et al., 2009. The Digital Shoreline Analysis System (DSAS) Version 4.0: An ArcGIS Extension for Calculating Shoreline Change. US Geological Survey.

31
Wang Y, Hou X, Jia M et al., 2014. Remote detection of shoreline changes in eastern bank of Laizhou Bay, North China. Journal of the Indian Society of Remote Sensing, 42(3):621-631.

DOI

32
Wu P, Zhang J, Ma Y et al., 2018. Coastline dynamics monitoring and analysis around the Bohai Sea using remote sensing images during 2010 and 2015. Advances in Marine Science, 36(1):128-138. (in Chinese)

33
Yan H K, Wang N, Yu T L et al., 2013. Comparing effects of land reclamation techniques on water pollution and fishery loss for a large-scale offshore airport island in Jinzhou Bay, Bohai Sea, China. Marine Pollution Bulletin, 71(1/2):29-40.

DOI PMID

34
Yue Q, Zhao M, Yu H et al., 2016. Total quantity control and intensive management system for reclamation in China. Ocean & Coastal Management, 120:64-69.

DOI PMID

35
Zhang B, Tang Q, Jin X , 2007. Decadal-scale variations of trophic levels at high trophic levels in the Yellow Sea and the Bohai Sea ecosystem. Journal of Marine Systems, 67(3/4):304-311.

DOI

36
Zhu M S, Sun T, Shao D D , 2016. Impact of land reclamation on the evolution of shoreline change and nearshore vegetation distribution in Yangtze River Estuary. Wetlands, 36(1):11-17.

Outlines

/