Research Articles

China’s corridors-in-the-sky design and space-time congestion identification and the influence of air routes’ traffic flow

  • DONG Yaqing 1 ,
  • LU Zi 1 ,
  • LIU Yuan 1 ,
  • ZHANG Qiuluan 1 ,
  • WU Dianshuang 2
Expand
  • 1. School of Resource and Environment Sciences, Hebei Normal University, Shijiazhuang 050024, China
  • 2. Decision Systems & e-Service Intelligence Lab, Centre for Artificial Intelligence, Faculty of Engi-neering and Information Technology, University of Technology Sydney, Australia

Dong Yaqing (1990─), PhD Candidate, specialized in regional development and information economic geography.E-mail: dongyaq@126.com

Received date: 2018-07-19

  Accepted date: 2018-09-20

  Online published: 2019-12-06

Supported by

National Natural Science Foundation of China, No(41671121)

Copyright

Copyright reserved © 2019. Office of Journal of Geographical Sciences All articles published represent the opinions of the authors, and do not reflect the official policy of the Chinese Medical Association or the Editorial Board, unless this is clearly specified.

Abstract

With rapid development of air transportation, the airspace structure of the future will need to be flexible and dynamic to accommodate the increase in traffic demand. The corridors-in-the-sky has become a new technology to support the full exploitation and utilization of airspace resources. This paper proposes a method of designing corridor, identifying congestion state, and analyzing the influence of air routes’ traffic flow. From this, we have reached a number of conclusions. (1) The congestion periods present the multi-peak “wavy” scattered distributions and the peaks back-end agglomeration characteristics in the whole day. (2) The congestion segments present the structural characteristics of unbalanced coverage and concentrated distribution to the crossing points. The corridors with high congestion level present as an italic “N-shaped” frame, which presents incomplete penetration of short segments. (3) For the temporal and spatial interaction, there are two types of congestion segments, and there are some common congestion periods in different congestion segments of multiple corridors. The high-density air route plays a relatively decisive role in corridor congestion, and the influence of two directions is unbalanced. This research can provide a basis for the dynamic evaluation of China’s airspace resources and corridors construction in the future.

Cite this article

DONG Yaqing , LU Zi , LIU Yuan , ZHANG Qiuluan , WU Dianshuang . China’s corridors-in-the-sky design and space-time congestion identification and the influence of air routes’ traffic flow[J]. Journal of Geographical Sciences, 2019 , 29(12) : 1999 -2014 . DOI: 10.1007/s11442-019-1701-3

1 Introduction

Air traffic demand in China continues to outpace the ability of the air transportation system to provide adequate services. It caused the contradiction between the airspace capacity and flights volume in all kinds of air traffic units, such as terminal areas and air routes, which has caused serious flight delays (Lu and Du, 2015; Xu and Li, 2015). To deal with the contradiction, it is necessary to explore new airspace utilization modes and construct new airspace exploitation systems. One of the new classes of airspace introduced within dynamic airspace configuration (DAC) is corridors-in-the-sky (Xue, 2009). The notion of corridors-in-the-sky, alternatively described as highway-in-the-sky, the dynamic multi-track airways (DMA), the flow corridor or ribbon, the super sector etc. (Hoffman and Prete, 2008). It aims to include the flights with similar trajectories into the corridors-in-the-sky by distance constraint to reserve ample airspace for high-density air routes (Sridhar et al., 2006). In this paper, we studied the concept and key techniques of corridors-in-the-sky (hereinafter referred to as corridor), and applied it in airspace resources management in China.
In the corridor research, corridor design and congestion identification have become the basic issues. The corridor design includes the location determination and the air route attendees determination. For the location determination, Alipio et al. (2003) , Hoffman et al. (2008) , and Yousefi and Zadeh (2013) have designed the mode to determine the corridor location relying on the trunk air route with high traffic load values (large number of flights), through candidate airspace recognition and effectiveness simulation of the corridor, based on priority ranking and hierarchy setting, velocity vector field and velocity vector clustering, flight delay and cancellation assessment respectively. For the air route attendees determination, based on the characteristic of a large number of flights with similar flight trajectories, Xue (2009) proposed a new idea to include more air route attendees with less extra flight distance, according to 3 constraints of the great circle flight trajectory distance, the flight entry and exit perpendicular distance and 5% extra flight distance. It can be seen that the corridor design can be completed by determining the corridor location according to the high-density air route and including the relevant air route attendees through the distance constraints.
Congestion identification is mostly carried out for the airport terminal areas and the air routes. Scholars have defined air traffic congestion in terms of traffic demand and traffic capacity (Xu and Li, 2015), delays and cancellations of departing flights (Lee et al., 2007; Xu et al., 2009), and the airspace inflow and outflow rates, and have attempted to define the congestion criteria to determine the congestion status within an air traffic unit. For example, to identify the congestion, Hoffman et al. (2003) based on the K-means clustering method of flight delay and cancellation feature vectors, and Bilimoria and Lee (2005) based on the aircraft relative distance index clustering method. Summarizing previous research on congestion identification, most researches mainly focused on the calculation of flight conflict and time slot utilization in a single air traffic unit, lacking the overall congestion identification in a large area. Most researches mainly focused on mathematical simulation of ground waiting, hovering, speed adjustment and interval control, lacking congestion identification based on actual data. Most researches mainly focused on the construction of technical methods and description of congestion reasons and characteristics of local areas, lacking congestion identification based on space-time combination and spatiotemporal evolution.
With the advance of Next Generation Air Transportation System (NextGen) and the One Sky program (Du et al., 2016), congestion identification for local small area alone cannot meet the needs of corridor development (Zhang et al., 2009). To date, as for the more accurate measurement of the corridor congestion in a large area, no effective identification method has been used yet. However, the method proposed by Xue (2009) to identify the activation and deactivation of the corridor has been proved to be effective for displaying the dynamic air traffic flow on both temporal and spatial dimensions, which can be used for flight distribution, and then through the congestion threshold setting, the identification of corridor’s congestion period and congestion segment can be achieved.
This study will construct a research method which includes corridor design, congestion state identification and the analysis of the influence of air routes’ traffic flow. This method will be used to identify congestion periods and congestion segments of China’s corridors, to reveal the congestion regularities on temporal dimension, spatial dimension and spatiotemporal interaction dimension, and to evaluate the congestion influence of air routes’ traffic flow. This study will provide a basis for China to implement flight delay mitigation strategies and to solve the problem of full exploitation and utilization of airspace resources.
The rest of the paper is organized as follows. Section 2 presents the research method. A case study of China’s corridor design and congestion identification is given in Section 3. Section 4 presents the results and analysis. A set of conclusions and discussion are presented in Section 5.

2 Research methods

2.1 Corridor design

As mentioned above, the location of corridor is determined based on the high-density air route in a certain direction in the area, and the corridor is named after the high-density air route. The corridor is then extended to both ends from the initially selected high-density air route position along the great circle flight trajectory until the last airport that has a route joining the corridor. In this way, the corridor design is completed. Here the high-density air route is defined as the trunk route with a large number of flights, high-density, and the route distance is greater than or equal to 600 km (Pan et al., 2009). Air route attendees are defined as routes to join the corridor, which can be determined according to the constraint that the extra flight distance percentage is less than or equal to 5%. The extra flight distance percentage is calculated as the ratio of the extra flight distance after joining the corridor to the flight distance before joining in the corridor. Based on the study of Xue and Kopardekar (2008) , the percentage is more accurately calculated by adding variables as follows:
$d_{extra} = \frac{(d_{1}+d_{2}+d)-D}{D}. 100\%$
where dextra is the percentage of extra flight distance, d1 is the distance of great circle flight trajectory before the flight enters the corridor perpendicularly, d2 is the distance of great circle flight trajectory after it exits the corridor perpendicularly, d is the distance of great circle flight trajectory in the corridor; D is the distance of great circle flight trajectory before the corridor is designed; the calculation methods of d1, d2, d and D are the same; taking D as an example, it can be calculated as follows (Peng et al., 2005):
D=R•arc cos D
$\cos \ D=\cos (90{}^\circ -{{\varphi }_{1}})\cdot cos(90{}^\circ -{{\varphi }_{2}})+sin(90{}^\circ -{{\varphi }_{1}})\cdot sin(90{}^\circ -{{\varphi }_{2}})\cdot cos({{\lambda }_{1}}-{{\lambda }_{2}})$
where R is the radius of the earth, (φ1, λ1) and (φ2, λ2) are the coordinates of the two endpoints of the great circle flight trajectory, i.e., the coordinates of the perpendicular points (or the airports) where the flight enters and exits the corridor. The perpendicular point coordinates are determined according to the perpendicular entry and exit rule of the flights.

2.2 Corridor congestion identification

The identification of corridor congestion period and congestion segment can be accomplished through the following steps: space-time data calculation, space-time map compiling, grid frequency filtering and threshold setting. First, the space-time data of flight entry and exit corridor is calculated by use of the flight schedule data. We can calculate the time data of flight entering and exiting corridor according to the corresponding flight schedule data and the planned average flight speed, d1, d2, and d. Defining the coordinates of the extended end of the higher-capacity airport in the high-density air route as the origin of the corridor, we calculate the distance of great circle flight trajectory between the origin and the perpendicular points of the flight entering and exiting the corridor to obtain the space data.
Second, the space-time map is compiled by use of Fishnet method of ArcGIS10.2. Taking the CA1425 flight of Beijing-Chengdu corridor as an example, it enters the corridor at the coordinate of 737 nautical mile (nmi) (Beijing) at 17:00 and exits the corridor at the coordinate of 1584 nmi (Chengdu) at 20:00. Its space-time data can be described as a flight trajectory whose slope is the speed line. The space-time data of the flight trajectory is then divided according to twice the safety distance requirement to form a grid with a time of 2 minutes (min) and a distance of 10 nmi. After that, the flight trajectory is superimposed on the grid, the grid is marked, the same item is deleted, and the flight trajectory frequency is counted. The grid pixel value is set according to grid frequency (the high value is represented by hot color and the low value is represented by cold color). Finally, the grid frequency is taken as the judgment index of corridor congestion identification. When the frequency is greater than 1, congestion occurs. The greater the frequency is, the higher the level of congestion is (Xue, 2009).
Third, the peak value of flights is represented by the hot grid (grid with the highest frequency) and the second highest frequency grid on the space-time map. When the number of hot grids is insufficient, and the distribution is dispersed, the congestion period and the congestion segment degenerate into points. At this time, the congestion identification changes too frequently and cannot be used as the defining mark of the airspace structure (Zhang et al., 2009). Therefore, the hot grid and the second highest frequency grid are both taken as the identification basis. The determination of the lower bound and upper bound of the threshold should refer to the flight schedule (Wang and Wang, 2013) and the airport space service distance (Wang, 2015; Jin et al., 2016), and consider the representative and universal significance of the determined hot grids and the second highest frequency grids. When the time threshold and space threshold that were well within the limits, the congestion period duration and the congestion segment range can be identified.

2.3 Influence of air routes’ traffic flow

For the influence of air routes’ traffic flow on the congestion of a corridor, we mainly analyze the difference between the high-density air route and the remaining air routes in the corridor. The scale value is used to represent the ratio of a certain route’s traffic flow to the total routes’ traffic flow passing through a certain section in a certain period. Air routes’ traffic flow is shown as the number of flight trajectories in the space-time map, which is calculated as follows:
$SD=\frac{{{q}_{m}}[({{t}_{1}},{{t}_{2}}),({{d}_{1}},{{d}_{2}})]}{\sum\limits_{i=1}^{n}{{{q}_{i}}[({{t}_{1}},{{t}_{2}}),({{d}_{1}},{{d}_{2}})]}}$
where SD is the scale value, qm is the number of the arrival and departure flights of m route passing segment (d1, d2) during period (t1, t2), n is the number of all routes in this period and segment. The increase of SD value indicates that the effect of a certain route on corridor congestion is enhanced.
The aggregation value is used to represent the ratio of the number of the arrival and departure flights of a certain route to the number of the arrival and departure flights of all routes in a hot grid (peak traffic flow). The peak value is shown as hot grid frequency in the space-time map, representing the crossing number of flight trajectories. The aggregation value is the basic measure of route network complexity, which is used to characterize the concentrated characteristics of corridor congestion (Xu and Li, 2015). It is calculated as follows:
$AD=\frac{{{q}_{m}}[(2t,2t+2),(10d,10d+10)]}{\max q[(2t,2t+2),(10d,10d+10)]},(t=0,1,2,...; d=0,1,2,...)$
where AD is the aggregation value, maxq is the total crossing number of flight trajectories of all routes’ arrival and departure flights in the hot grid (2t, 2t+2), (10d, 10d+10) in the corridor (i.e., hot grid frequency), qm is the crossing number of flight trajectories of route m in the hot grid. The increase of AD value indicates that the effect of a certain route on corridor congestion is enhanced.

3 Case study: China’s corridors-in-the-sky design and space-time congestion identification

3.1 Corridor design

Referring to Xue’s (2009) study on the corridor in the United States, considering the representativeness and universality requirements, the data of “Statistical Data on Civil Aviation of China 2015” and “Statistical bulletin for development of civil aviation industry (2016)” are used as the ranking basis of high-density air routes and high-capacity airports (Wu and Man, 2018). In addition, the scheduled flight data of all passenger flights on May 8, 2017 is obtained from Variflight (http://www.variflight.com) and FlightAwar (http://zh.flightaware.com) (Chen et al., 2018). The shared flights are deleted, the non-stop routes are merged with stop-off routes, and the routes of stop-off airports are separated. For example, route J-K-L will be separated into two segments (J-K and K-L), and treated as two routes (Ye et al., 2013). The two airports, SHA and PVG, are only treated separately when calculating the percentage of extra flight distance, and are merged in the statistics of air routes’ traffic flow and subsequent analysis. Data processing and analysis of PEK and NAY two airports is the same as above. The coordinates of all airports in China and the perpendicular points of the flight entering and exiting are obtained from Baidu Map. According to the constraint that the percentage of extra flight distance is less than or equal to 5%, Beijing-Guangzhou is merged into Beijing-Shenzhen, Guangzhou-Hangzhou is merged into Shanghai-Guangzhou, Beijing-Xi’an is merged into Beijing-Chengdu, Beijing-Kunming is merged into Beijing-Chongqing, and Shenzhen-Chengdu is merged into Guangzhou-Chengdu. 14 corridors are finally designed, including 170 air route attendees. The percentage of extra flight distance and the spatial position of air route attendees are shown in Figures 1 and 2.
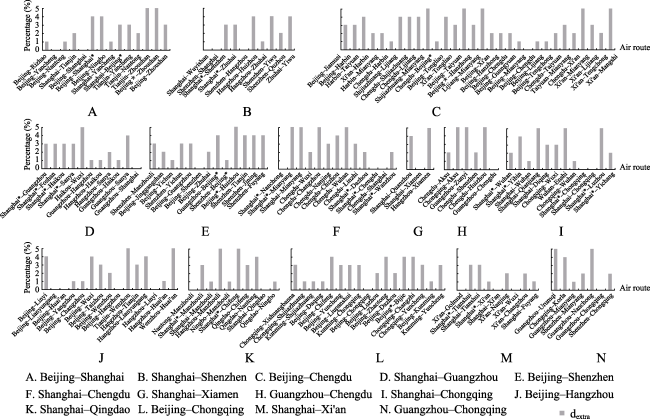
Figure 1 China’s corridors and the percentage of extra flight distance of route-attendees

Note: Shanghai Hongqiao Airport is recorded as Shanghai, Shanghai Pudong Airport is recorded as Shanghai*, Beijing Capital Airport is Beijing, Beijing Nanyuan Airport is Beijing*

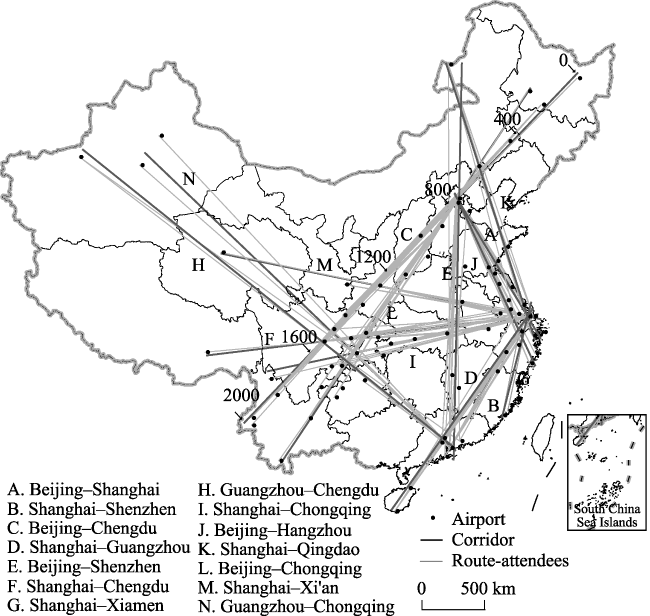
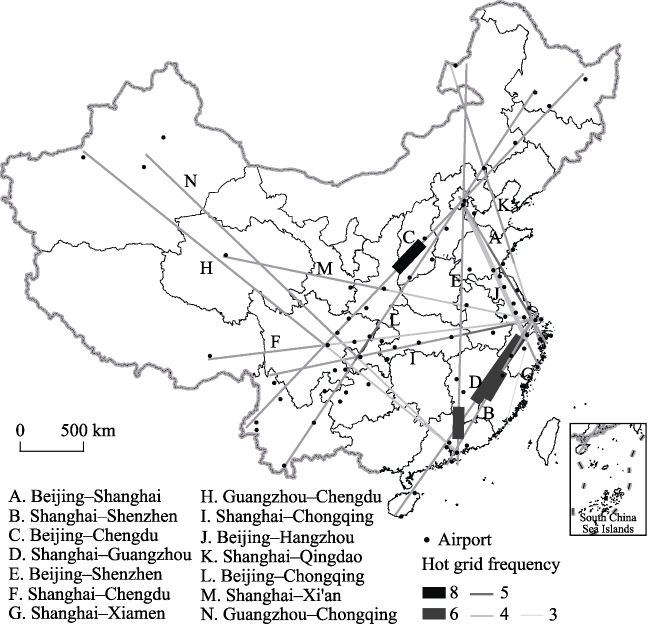
Figure 2 Spatial position of China’s corridors and route-attendees

3.2 Space-time data calculation and space-time map compiling

Based on the data of flight schedule and flight speed of 170 air route attendees from Variflight and FlightAware, the time data of 2066 flights entering and exiting the corridors was calculated. The origin coordinates of 14 corridors were obtained from Baidu map: Beijing-Shanghai (40.24°N, 116.52°E), Shanghai-Shenzhen (31.50°N, 121.64°E), Beijing-Chengdu (46.83°N, 125.36°E), Shanghai-Guangzhou (31.50°N, 121.68°E), Beijing-Shenzhen (49.61°N, 118.76°E), Shanghai-Chengdu (31.17°N, 112.02°E), Shanghai-Xiamen (31.35°N, 121.42°E), Guangzhou-Chengdu (22.63°N, 114.16°E), Shanghai-Chongqing (31.22°N, 122.01°E), Beijing-Hangzhou (40.25°N, 116.54°E), Shanghai-Qingdao (29.67°N, 121.59°E), Beijing-Chongqing (46.83°N, 125.36°E), Shanghai-Xi’an (31.00°N, 121.95°E), Guangzhou-Chongqing (22.60°N, 114.06°E). Based on the above,the space data of 2066 flights entering and existing the corridors was calculated. Space-time maps of corridors were then compiled using space-time data, and the frequency and number of hot grids and grids were counted (Figure 3).
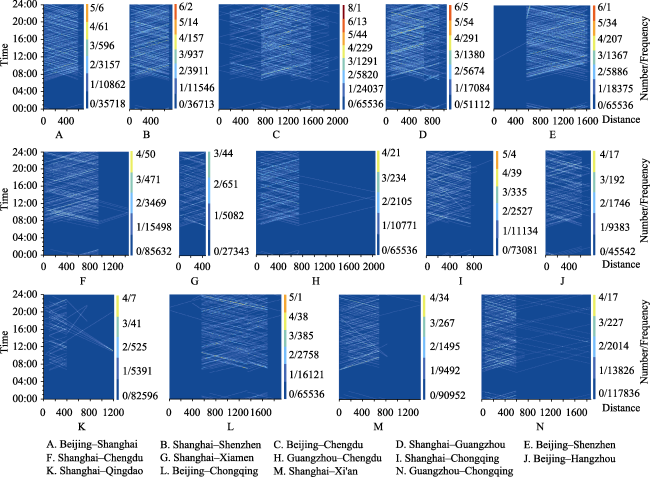
Figure 3 Space-time map of China’s corridors and frequency/number of the hot grids and grids

3.3 Congestion identification threshold setting

As can be seen from Figure 3, in the 14 corridors, except a few corridors with low frequency (3, 4) having a large number of hot grids, other corridors with low frequency and corridors with high frequency (5, 6, 8) all have a small number of hot grids. Such few hot grids cannot be identified as airspace structure. Therefore, hot grids and the second highest frequency grids are selected as the basis for the identification of congestion period and congestion segment. On this basis, drawing on previous researches and comparing the distributions of determined hot grids and the second highest frequency grids in the 14 corridors, the bounds of thresholds are determined. The lower bound of time threshold is 15 min, and the upper bound is 60 min (Enea and Porretta, 2012; Wang and Wang, 2013). The lower bound of space threshold is 30 nmi, and the upper bound is 120 nmi (Jin et al., 2016). Finally, the coverage distribution and characteristics of congestion periods and congestion segments in China’s corridors are obtained (Figure 4 and Table 1).
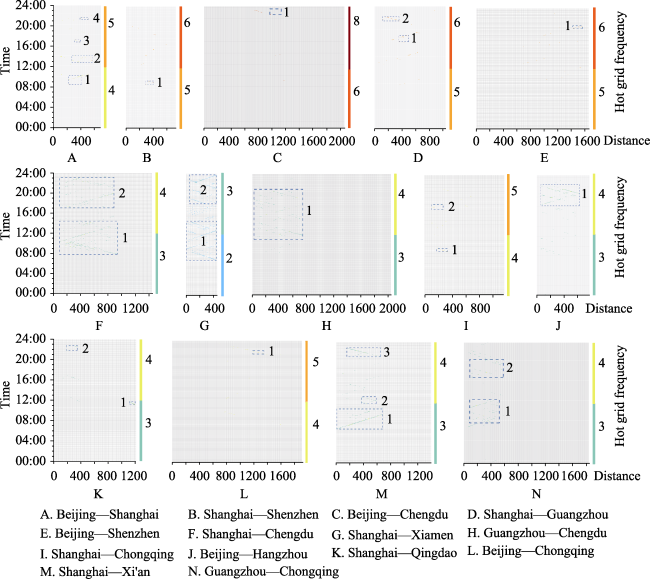
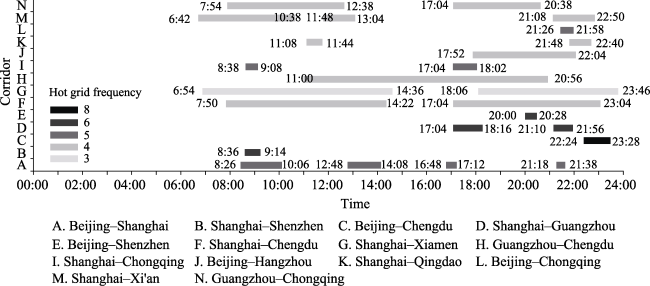
Figure 4 Coverage distribution of congestion periods and congestion segments in China’s corridors
Table 1 Coverage characteristics of congestion periods and congestion segments in China’s corridors
Corridor Identification Period Segment (nmi) Corridor Identification Period Segment (nmi)
A 4 21:18-21:38 390 (67 away from Rizhao)-510 (65 away from Yancheng) H 1 11:00-20:56 10 (Shenzhen)-
725 (Chengdu)
3 16:48-17:12 310 (232 away from Tianjin)-
390 (67 away from Rizhao)
I 2 17:04-18:02 110 (75 away from Hongqiao)-
280 (245 away from Hongqiao)
2 12:48-14:08 270 (192 away from Tianjin)-
570 (35 away from Nantong)
1 8:38-9:08 190 (155 away from Hongqiao)-
350 (315 away from Hongqiao)
1 8:26-10:06 220 (142 away from Tianjin)-
410 (91 away from Rizhao)
J 1 17:52-22:04 60 (50 away from Beijing)-
640 (11 away from Hangzhou)
B 1 8:36-9:14 290 (84 away from Quzhou)-
410 (115 away from Wuyishan)
K 2 21:48-22:40 190 (43 away from Nantong)-
350 (203 away from Nantong)
C 1 22:24-23:28 980 (10 away from Taiyuan)-1140 (159 away from Taiyuan) 1 11:08-11:44 1130 (370 away from Chifeng)-
1210 (Manzhouli)
D 2 21:10-21:56 120 (21 away from Hangzhou)-
360 (63 away from Wuyishan)
L 1 21:26-21:58 1200 (245 away from Changzhi)-
1360 (11 away from Chongqing)
1 17:04-18:16 360 (63 away from Wuyishan)-
500 (203 away from Wuyishan)
M 3 21:08-22:50 160 (37 away from Changzhou)-
660 (324 away from Fuyang)
E 1 20:00-20:28 1450 (75 away from Jinggangshan)-1590 (Guangzhou) 2 11:48-13:04 380 (44 away from Fuyang)-600 (264 away from Fuyang)
F 2 17:04-23:04 80 (45 away from Hongqiao)-890 (73 away from Nanchong) 1 6:42-10:38 10 (Pudong)-
690 (354 away from Fuyang)
1 7:50-14:22 80 (45 away from Hongqiao)-
940 (7 away from Chengdu)
N 2 17:04-20:38 90 (27 away from Guangzhou)-
580 (Chongqing)
G 2 18:06-23:46 50 (40 away from Hongqiao)-440 (Xiamen) 1 7:54-12:38 90 (27 away from Guangzhou)-
520 (457 away from Guangzhou)
1 6:54-14:36 10 (Hongqiao)-
440 (Xiamen)

4 Results and analysis

From Figure 4 and Table 1, it can be seen that the spatiotemporal congestion states of corridors described by hot grid frequency are significantly different. The corridors ranked by congestion levels from high to low are divided into five levels: (1) Beijing-Chengdu; (2) Shanghai-Shenzhen, Shanghai-Guangzhou, Beijing-Shenzhen; (3) Beijing-Shanghai, Shanghai-Chongqing, Beijing-Chongqing; (4) Shanghai-Chengdu, Guangzhou-Chengdu, Beijing-Hangzhou, Shanghai-Qingdao, Shanghai-Xi’an, Guangzhou-Chongqing; (5) Shanghai-Xiamen. The higher the frequency of hot grids, the less the number of hot grids. The spatiotemporal congestion is characterized by the concentrated distribution of high intensity and small range. Several valuable points can be concluded from the following analyses.

4.1 Analysis of congestion periods and congestion segments

4.1.1 Congestion periods identification
We form the distribution chart of the congestion periods to further visualize the temporal heterogeneity by summarizing the distribution of congestion periods in Figure 4 and Table 1, and combining the congestion level reflected by hot grid frequency (Figure 5). As shown in the Figure, the temporal structure presents characteristics of the multi-peak “wavy” scattered distribution, and the peaks back-end agglomerated in the whole day. The congestion periods described by the number of overlapping periods (7-6, 5-4, 3-2, 1-0) shows four congestion levels.
Figure 5 Congestion periods distribution of China’s corridors
The four levels exist in the following four groups of periods, from high to low: (1) 8:38-9:08, 20:00-20:28, 21:18-21:48; (2) 7:54-8:26, 9:14-10:38, 11:08-12:38, 12:48- 14:08, 17:12-17:52, 18:16-20:00, 20:38-20:56, 21:10-21:26, 22:04-22:40; (3) 6:54-7:50, 10:38-11:00, 16:48-17:04, 23:04-23:28; (4) 0:00-6:42, 14:36-16:48, 23:28-24:00. Combined with the hot grid frequency (8, 6, 5, 4, 3), we describe the most serious congestion periods in the four congestion levels, which exist at: 8:38-9:08, 21:18-21:48; 22:04-22:40; 23:04-23:28; 14:36-16:48. It can be seen that there are many peaks of traffic flow, the most serious congestion periods exist in the morning and at night, and the main peak occurs later in the whole day. The most serious congestion periods are very close at night, with a shorter duration of period and a smaller time interval of periods. With the increase, the number of congestion periods in a day first increase and then decrease, which also reflected the characteristic of the centralized distribution of the most serious congestion periods at night. The differences in level, distribution, number, and interval of such congestion periods reflect the temporal heterogeneity (Song and Yang, 2016).
4.1.2 Congestion segments identification
Based on the distribution of congestion segments in Figure 4 and Table 1, according to hot grid frequency, the distribution of congestion segments is formed, as shown in Figure 6. The spatial structure presents characteristics of unbalanced coverage and centralized distribution near to the crossing points (airport terminal areas) of the corridors. The unbalanced coverage is specially presented as the incomplete penetration of small segments coverage. The distribution of such short segments is significantly reflected in the corridors with high congestion levels, which generally presents as an italic “N-shaped” frame consisting of three parts (Beijing Airport to Chengdu-Chongqing Airport Group, Beijing Airport to Guangzhou-Shenzhen Airport Group, Shanghai Airport to Guangzhou-Shenzhen Airport Group). The characteristic of centralized distribution near to the corridors’ crossing points is obviously reflected in the crossing points of Shanghai, Chengdu/Chongqing, Guangzhou/Shenzhen. Among them, the number of crossings in Shanghai reaches up to 8 and the characteristic of centralized distribution near to the crossing point is most significant. This spatial congestion near to the airport terminal area shows that the terminal area with a large number of crossings is more likely to become congestion bottlenecks in China’s corridor network.
Figure 6 Congestion segments distribution of China’s corridors
4.1.3 Spatiotemporal interaction identification of congestion periods and congestion segments
By summarizing the distribution of congestion segments in Figure 4 and Table 1, combining the number of overlapping congestion periods, the distribution chart of congestion segments based on overlapping periods is formed (Figure 7). As demonstrated in the Figure, the internal differentiation of congestion under spatiotemporal interaction is more complicated.
(1) Based on the description of multiple congestion segments, different congestion segments in multiple corridors have common congestion periods. The seven congestion segments with the largest overlapping number are in the periods of 8:38-9:08 in the morning and 21:26-21:38 at night, and the duration of periods is relatively short (12-22 min). In general, the duration of congestion period decreases with the increase of the number of overlapping segments, that is, from single segment to seven overlapping segments, the duration of the period is shortened from 132 min to 12 min. The longest duration (14:36-16:48) occurred in a single congestion segment, and the shortest duration (21:26-21:38) occurred in the seven overlapping congestion segments. The spatial distribution of common congestion periods is unbalanced, and the corridors with Shanghai as the crossing point have the largest number of common congestion periods. The emergence of common congestion periods in corridors poses a severe challenge to the optimization of flight schedule resources and the scale expansion of airport infrastructure in such airport terminal areas.
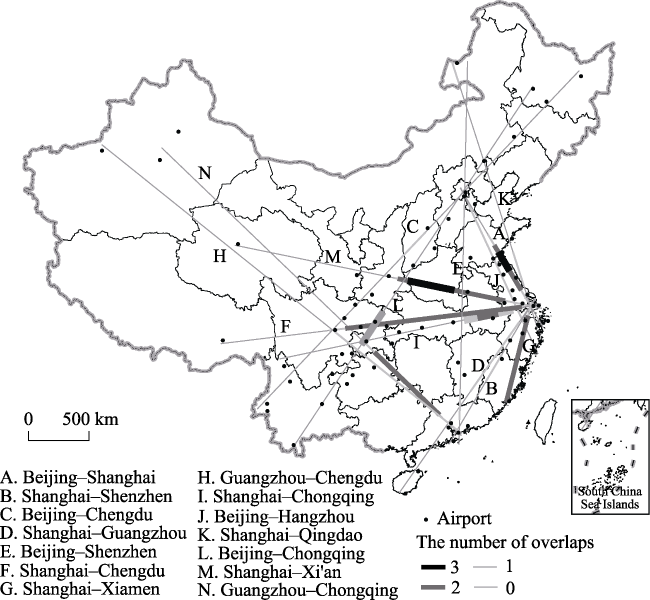
Figure 7 Congestion segments distribution of China’s corridors based on overlapping periods
(2) According to the description of overlapping periods, there are two types of corridors’ congestion segments, single-period and multi-period overlap. The duration of congestion period is positively correlated with the range of congestion segment. There are 6 relatively short (80-240 nmi) ones in the 8 congestion segments of single-period, and the duration is 28-64 min. There are 2 relatively long (580-715 nmi) congestion segments, and the duration is 4 h 12 min-9 h 56 min. There are 2 relatively short (20-90 nmi) ones in 6 congestion segments of multi-period overlap (the number of overlap is three or two), and the duration is 20-100 min. There are 4 relatively long (220-810 nmi) congestion segments, and the duration is 3 h 34 min-7 h 42 min. Among them, the characteristic of short duration and short segment in the single-period is concentrated reflected in the italic “N-shaped” frame. It can be seen that the aforementioned distribution characteristic of small congestion segments is more significant under spatiotemporal interaction.

4.2 The influence of air routes’ traffic flow

Four corridors with high congestion levels (Shanghai-Shenzhen, Beijing-Chengdu, Shanghai-Guangzhou, Beijing-Shenzhen) are selected to analyze the influence of different routes’ traffic flow on congestion periods and congestion segments of the corridors. With the same compiling method of Figures 3 and 4, we obtain the overlay chart of the congestion coverage and trajectories of all arrival and departure flights of the corridors (Figure 8).
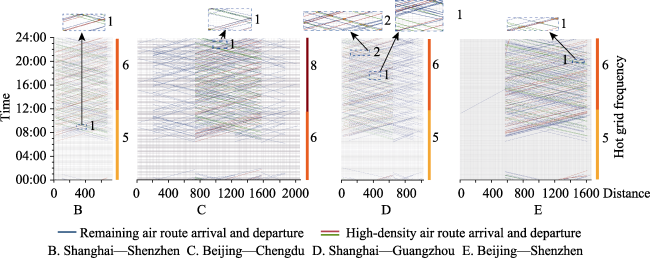
Figure 8 Congestion coverage and trajectories of all arrival and departure flights of the corridors
The scale value and the aggregation value are illustrated in Figure 9. The main findings are as follows:
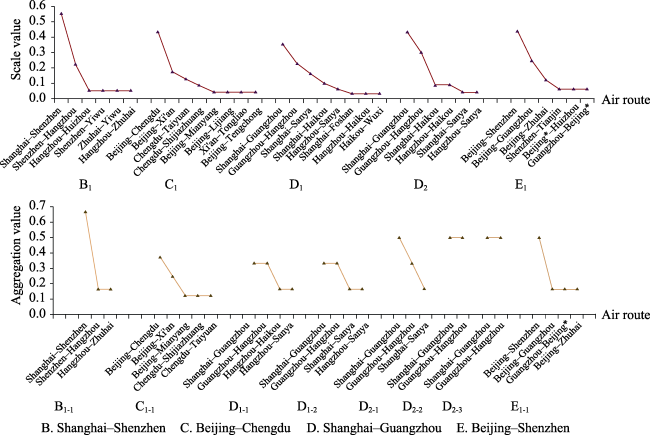
Figure 9 Air routes’ scale value and aggregation value of the corridors
(1) From the calculated scale values of the five identified congestion periods and segments, it can be seen that the high-density air routes play a relatively decisive role in the congestion. The scale values of the high-density air routes in the four corridors are significantly higher than those of the remaining air routes, in which the scale value of Shanghai-Shenzhen route in Shanghai-Shenzhen corridor is greater than 50%. From the calculated aggregation values of the eight hot grids in the five congestion periods and segments, it can be seen that the high-density air routes also play a relatively decisive role in the congestion. The aggregation values of high-density air routes of the five congestion periods and segments in the four corridors are also significantly higher than those of the remaining air routes. The aggregation values ​​of Shanghai-Shenzhen, Shanghai-Guangzhou and Beijing-Shenzhen routes in the three corridors are greater than or equal to 50%. In short, regardless of the number of flight trajectories in congestion periods and segments, or the number of flight trajectories’ crossings in hot grids, the ratio of the high-density air routes to the total routes is significantly higher than that of the remaining air routes. The effect of the high-density air route in congestion level, congestion range and location is affected by both the scale value and the aggregation value.
(2) The influence of arrival and departure directions of the high-density air routes on the congestion is unbalanced measured by scale value. The number of arrival flights is different from the number of departure flights in five congestion periods and segments of four corridors, in which the difference of Shanghai-Shenzhen, Beijing-Chengdu and Shanghai-Guangzhou is most obvious, and the unbalanced ratio of arrival and departure flights in congestion periods and segments reaches 2/3. This may be caused by the dynamic evolution of flights volume in the corridor due to the difference in flight speed or flight schedule.
As can be seen from above, measuring the static maximum capacity of air route and the dynamic congestion identification of air traffic flow, the model to determine the corridor position is based on the trunk air route with heavy traffic (a large number of flights) in a direction is reasonable.

5 Conclusions and discussion

5.1 Conclusions

(1) The congestion periods of China’s corridors present the structural characteristics of multi-peak “wavy” scattered distribution and the peaks back-end agglomerated in the whole day. The peaks of traffic flow are distributed in the morning and at night, and the most serious congestion periods ranked by congestion levels from high to low are divided into four levels, which forms the characteristics of short duration, small interval and evening agglomeration of the congestion periods. These characteristics will become an important reference for optimizing airport flight schedule resources.
(2) The congestion segments generally present the structural characteristics of unbalanced coverage and centralized distribution near to the crossing points (airport terminal areas) of corridors. Corridors with high congestion level generally present an italic “N-shaped” frame consisting of three parts, and the frame presents incomplete penetration of the short segments. The number of crossings in Shanghai airport terminal area is the largest. The characteristics of corridors’ congestion segments are basically consistent with the density distribution of China’s trunk air routes. The characteristic of the crossing points indicates that congestion bottlenecks exist on the network of China’s air routes and corridors.
(3) Under spatiotemporal interaction, different congestion segments of multiple corridors have the same congestion periods. The largest number of overlapping periods exists in the morning and at night, and the duration of congestion period is inversely proportional to the number of overlapping segments. The congestion segments under spatiotemporal interaction present two types of single-period and multi-period overlap, and the range of the congestion segments is proportional to the duration of congestion period in a day.
(4) Characterized by the scale value and the aggregation value, the high-density air route generally plays a relatively decisive role in the congestion identification of the whole corridor. The influence of arrival and departure directions of the high-density air route in congestion identification is unbalanced.
(5) The research method constructed by the corridor design, the air congestion identification and the influence of air routes’ traffic flow can clearly identify the congestion periods and congestion segments of China’s corridors, and can help to solve the balanced matching problem between the spatiotemporal distribution of flights and the airspace capacity. Dynamic management of air traffic flow based on the identification of congestion will be a key technology to mitigate flight delay and air traffic congestion.

5.2 Discussion

At present, the matching problem of airspace resources utilization caused by the increase of air traffic flow per unit time is still one of the main reasons for flight delays in China. For the study of full exploitation and utilization of airspace resources, dynamic reconfiguration and flexible use of airspace is proposed as the object (Lu and Du, 2015), and temporal and spatial integration is proposed as the method (Du et al., 2016). In this paper, we accurately describe the dynamic spatiotemporal position and the dynamic number of flights in airspace, and identify congestion state of airspace in different periods and segments. This reflects the flexibility of corridor dynamic construction and the multi-dimensional requirements of time and space. This study demonstrates an active exploration of dynamic and flexible airspace configuration under geography paradigm. This research draws attention to the evolving regularities of transport networks.
In the future, the development direction of the research on the full exploitation and utilization of airspace resources in geography should be to further explore the interaction of different air traffic units between the airport terminal areas and the corridors. Previous researches focused more on the congestion of airport terminal areas (Zhang et al., 2009), and the flight schedule researches using the distribution and density of flights as indexes have revealed characteristics of temporal heterogeneity and obvious peak areas (Wang and Wang, 2013). There are also researches that indicate the most serious congestion area in the national air transport network according to delay events count, and propose the congestion commonalities and differences between the airport terminal area and the route (Bolaños and Murphy, 2013). However, in view of the inconsistent state between the airport terminal area and the corridor, to accurately characterize the relationship among peaks of traffic flow and clearly reveal the intrinsic mechanism, it will rely on more case studies, especially on the distribution regularity of the flights near to the crossing points on the corridor frame with high congestion level, and consider the transfer process of the congestion period and segment from the corridor to the airport terminal area.
1
Alipio J, Castro P, Hong K et al., 2003. Dynamic airspace super sectors (DASS) as high-density highways in the sky for a new US air traffic management system. IEEE Systems and Information Engineering Design Symposium, 57-66.

2
Bilimoria K, Lee H , 2005. Analysis of aircraft clusters to measure sector-independent airspace congestion. AIAA 5th ATIO and 16th Lighter-Than-Air Sys Tech. and Balloon Systems Conferences, 7455-7456.

3
Bolaños M E, Murphy D , 2013. How much delay does New York inject into the national airspace system? A Graph Theory Analysis. Aviation Technology, Integration,and Operations Conference, 4221-4231.

4
Chen W, Liu W D, Ke W Q et al., 2018. Understanding spatial structures and organizational patterns of city networks in China: A highway passenger flow perspective. Journal of Geographical Sciences, 28(4):477-494.

DOI

5
Du X R, Lu Z, Gao F et al. 2016. Design method, application and time alternative mechanism of flexible use of airspace. Advances in Earth Science, 31(6):643-649. (in Chinese)

DOI

6
Enea G, Porretta M , 2012. A comparison of 4D-trajectory operations envisioned for NextGen and SESAR, some preliminary findings. 28th International Congress of the Aeronautical Sciences, 23-28.

7
Hoffman B, Krozel J, Penny S et al. 2003. A cluster analysis to classify days in the national airspace system. AIAA Guidance, Navigation, and Control Conference and Exhibit, 5711-5722.

8
Hoffman R, Prete J , 2008. Principles of airspace tube design for dynamic airspace configuration. The 26th Congress of International Council of the Aeronautical Sciences, 8939-8956.

9
Jin F J, Wang C J, Cao Y H et al. 2016. Progress of research on transportation geography in China. Journal of Geographical Sciences, 26(8):1067-1080.

DOI PMID

10
Lee K, Feron E, Pritchett A , 2007. Air traffic complexity: An input-output approach. IEEE American Control Conference, 474-479.

11
Lu Z, Du X R , 2015. The theoretical sources, innovation of methodologies and practice of the exploitation and utilization of airspace in western countries. Advances in Earth Science, 30(11):1260-1267. (in Chinese)

DOI

12
Pan K Y, Cao Y H, Wei H Y , 2009. The evolution of aviation passenger traffic network structure for recent 12 years in China. Economic Geography, 29(9):1507-1511. (in Chinese)

13
Peng Y, Hu M H, Zhang Y , 2005. Conjecture method of dynamic flying track. Journal of Traffic and Transportation Engineering, 5(1):61-65. (in Chinese)

14
Song G, Yang J W , 2016. Measuring the spatiotemporal variation and evolution of transport network of China’s megaregions. Journal of Geographical Sciences, 26(10):1497-1516.

DOI

15
Sridhar B, Grabbe S, Sheth K et al. 2006. Initial study of tube networks for flexible airspace utilization. AIAA Guidance, Navigation and Control Conference, 6768-6777.

16
Wang J E, Jiao J J, Du C et al., 2015. Competition of spatial service hinterlands between high-speed rail and air transport in China: Present and future trends. Journal of Geographical Sciences, 25(9):1137-1152.

DOI

17
Wang W, Wang C J , 2013. Temporal-spatial network of flight schedule in hub airport: A case study of Beijing International Airport. Acta Geographica Sinica, 68(6):762-774. (in Chinese)

18
Wu X L, Man S , 2018. Air transportation in China: Temporal and spatial evolution and development forecasts. Journal of Geographical Sciences, 28(10):1485-1499.

DOI

19
Xu T, Ding J L, Gu B et al. 2009. Forecast warning level of flight delays based on incremental ranking support vector machine. Acta Aeronautica et Astronautica Sinica, 30(7):1256-1263. (in Chinese)

20
Xu X H, Li S M , 2015. Identification and prediction of air traffic congestion. Acta Aeronautica et Astronautica Sinica, 36(8):2753-2763. (in Chinese)

DOI

21
Xue M , 2009. Design analysis of corridors-in-the-sky. AIAA Guidance, Navigation, and Control Conference, 5859-5870.

22
Xue M, Kopardekar P , 2008. High-capacity tube network design using the hough transform. AIAA Guidance, Navigation and Control Conference and Exhibit, 7396-7407.

23
Ye Q, Wu D T, Dai T Q et al. 2013. A comparative analysis of hierarchy and regional system of domestic air passenger transport network between China and USA. Geographical Research, 32(6):1084-1094. (in Chinese)

24
Yousefi A, Zadeh A N , 2013. Dynamic allocation and benefit assessment of NextGen flow corridors. Transportation Research Part C Emerging Technologies, 33(4):297-310.

DOI

25
Zhang J, Hu M H, Zhang C , 2009. Complexity research in air traffic management. Acta Aeronautica et Astronautica Sinica, 30(11):2132-2142. (in Chinese)

Outlines

/