Research Articles

Trends and risk evolution of drought disasters in Tibet Region, China

  • CHEN Qiong 1 ,
  • LIU Fenggui 1, 2 ,
  • CHEN Ruijie 1 ,
  • ZHAO Zhilong 2 ,
  • ZHANG Yili , 2, 3, 4, * ,
  • CUI Peng 2, 3, 5 ,
  • ZHENG Du 2
Expand
  • 1.College of Geographic Sciences, Qinghai Normal University, Xining 810008, China
  • 2.Key Laboratory of Land Surface Pattern and Simulation, Institute of Geographic Sciences and Natural Resources Research, CAS, Beijing 100101, China
  • 3.CAS Center for Excellence in Tibetan Plateau Earth Sciences, Beijing 100101, China
  • 4.University of Chinese Academy of Sciences, Beijing 100049, China
  • 5.Key Laboratory of Mountain Hazards and Earth Surface Process, Institute of Mountain Hazards and Environment, CAS, Chengdu 610041, China
Zhang Yili, Professor, specialized in physical geography and biogeography. E-mail:

Chen Qiong (1975–), Associate Professor, specialized in land change science and GIS. E-mail: qhchen-qiong@163.com

Received date: 2018-07-11

  Accepted date: 2019-03-06

  Online published: 2019-12-05

Supported by

The Strategic Priority Research Program of the Chinese Academy of Sciences(No.XDA20040200)

National Natural Science Foundation of China(No.41271123)

National Natural Science Foundation of China(No.41261010)

Copyright

Copyright reserved © 2019. Office of Journal of Geographical Sciences All articles published represent the opinions of the authors, and do not reflect the official policy of the Chinese Medical Association or the Editorial Board, unless this is clearly specified.

Abstract

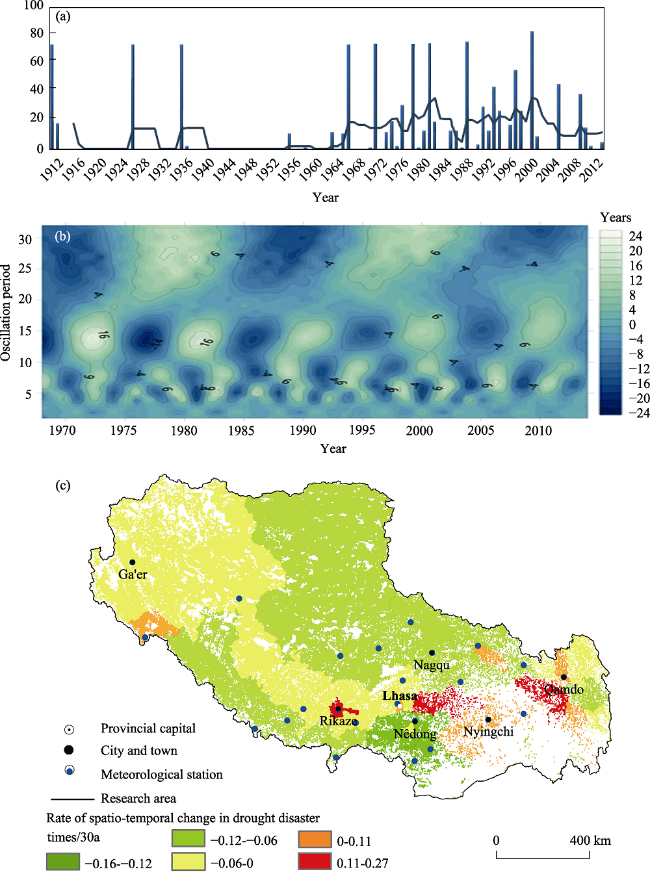
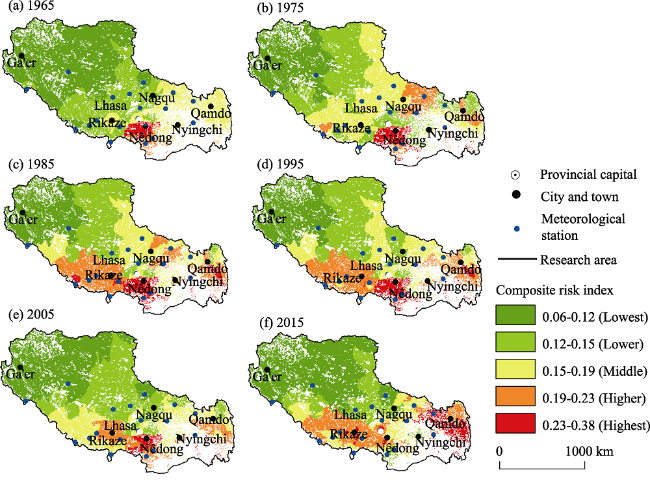
The risk posed by natural disasters can be largely reflected by hazard and vulnerability. The analysis of long-term hazard series can reveal the mechanisms by which risk changes. Drought disasters are one of the main types of disaster in the Tibet Region (TR) of China. In this study, using statistical drought disasters data in the TR from 1912 to 2012 and socio-economic statistics for five periods between 1965 and 2015, and adopting standard statistical analyses, a wavelet analysis, and a risk assessment model, we first construct the index system for drought disaster risk assessment, and then assess the risk of drought disasters and analyze the mechanisms of changes in risk. The results showed that the occurrence of drought in the TR had three distinct cycles during this study periods, with durations of 5, 15, and 27 years respectively. The frequency of drought in the TR showed increasing trends, and the cycle of drought had been prolonged. From 1965 to 2015, the risk of drought disaster in the TR is significantly increased with the growth rate of 6.8% in high-risk area. In addition, the severity of drought had enhanced, especially in Qamdo. The increased vulnerability locally and significantly enhanced hazard of drought disaster, with a shrinkage of 16.3% in the low-value area and an expansion of 7.4% in the high-value area, being the determinants of drought disaster risk. Therefore, agricultural areas of the TR are the focal locations where risk of drought disaster needs to be managed.

Cite this article

CHEN Qiong , LIU Fenggui , CHEN Ruijie , ZHAO Zhilong , ZHANG Yili , CUI Peng , ZHENG Du . Trends and risk evolution of drought disasters in Tibet Region, China[J]. Journal of Geographical Sciences, 2019 , 29(11) : 1859 -1875 . DOI: 10.1007/s11442-019-1993-z

The concepts of drought and drought disaster are quite different. The term “drought” does not accurately explain and express a drought disaster. A drought disaster is the result of the water shortage caused by abnormal natural precipitation and effect of human activities. It is a specific product of coupled natural environment and socio-economic system under specific spatial and temporal conditions (Houghton et al., 2001; Ashok et al., 2010). Vulnerability analysis based on the impact of human activity is an important method to assess drought risk (IPCC, 2014). Under the background of global warming, there is a lack of consistency in the prediction of drought disasters around the world, with some regions experiencing strong and prolonged drought disasters, while drought disasters in other areas are relatively minor events (IPCC, 2014). Drought is characterized as demonstrating very strong regional variability. The uplift and volume expansion of air masses over the Tibetan Plateau (TP) are the main cause of the Asian summer monsoon enhancement and inland aridification (An et al., 2001). At the same time, the TP also regulates the East Asian monsoon, the southwest monsoon, and the westerly circulation, which have complicated and profound influence on the internal climate system of the region (Manabe et al., 1974; Ye et al., 1979; Manabe et al., 1990; Kutzbach et al., 1993; Tang et al., 1996; Liu et al., 2001). Here there are various arid conditions due to its complex climate types and topography. The Tibet Region (TR) is located in the south of the Tibetan Plateau. Its northern part, the Qiangtang Plateau, is a cold area and affected by drought. The south of the TR is relatively humid and is affected by the Indian Ocean monsoon. In the past half century, the climate conditions of the TR have shown warming and wetting tendencies (Du et al., 2006; Xu et al., 2007; Liu et al., 2009), and it is projected to remain such conditions over the next 40 years (Zhao et al., 2011). But this trend presents predominantly in the northeast of the region. The TR is mainly arid or semi-arid together with long consecutive dry days, especially in most parts around Rikaze (Xigaze), Lhasa, Zedang and along the Yarlung Zangbo River (Zhang et al., 2016; Li et al., 2019). Drought greatly affects crop growth and development, and endangers crop agronomic yields (Zeng et al., 2016). Based on the historical meteorological disaster events, drought disaster is one of the most severe disasters (Xiong et al., 2017).
The results of statistical analyses for drought and drought disasters in the TR have revealed a trend for drought disasters to intensify and expand across the region. The results showed there were few drought disasters in the region in the 1940s and 1950s. Since the 1960s, the area subjected to drought disaster accounted for 20% of the total planted area in the 1980s, during which three heavy drought disasters occurred. In the 1990s, the area subjected to drought disaster accounted for 24%-27% of the total sown area, and there were more than three heavy drought disasters during this period (Du et al., 2000). Drought disasters that occurred in 2001 and 2005 affected 32 and 47 counties respectively over the Tibetan Plateau (Danzeng, 2008). The southern part of Nagqu, the northern part of Rikaze, the surrounding areas of Lhasa, and the northeast of Qamdo of the TR, are the areas that most frequently experienced drought disasters. Those disasters also affected border areas between TR, Qinghai, and Sichuan provinces (Gao et al., 2011). Based on statistical data for meteorological disasters over the 1961-2015 period and vulnerability data for disaster bearing bodies in 1965, 1975, 1985, 1995, 2005, and 2015, this study comprehensively analyzed the trend and risk evolution of drought disasters in the TR, and provides a theoretical basis for the prevention of regional drought disasters.

1 Data sources

1.1 Study area

The TR is located in the southwest of China (Figure 1), the land area is about 122×104 km2, of which the cultivated land is 5450.63 km2 and mainly concentrated in the areas of Rikaze, Shannan, Qamdo, Lhasa and Nyingchi. The forest land is about 18.107×10⁴ km2 and the natural grassland area is about 75.76×10⁴ km2 (Bureau of Surveying and Mapping of Tibet, 2017), due to the influence of topography and precipitation, most parts of the TR is dominated by grassland resources, which is the most important highland pasture in China. Annual precipitation in the TR is decreasing from southeast to northwest. In southeast TR and the west of the downstream of the Nujiang River, annual precipitation days are over 165 d due to the “water vapor channel” and climbing flow of the southwest monsoon and the annual average precipitation is over 600-800 mm, it is the area with the highest rainfall in TR. Ali (Ngari) region is located in northwest of TR, the annual precipitation days are only about 75 d, and the annual precipitation is less than 200 mm. It is the area with the lowest precipitation in TR, where the annual precipitation days of the Shiquan River are only 34 d, and the precipitation is less than 100 mm. Except for two extreme regions, other regions are arid and semi-arid regions, with annual precipitation between 200-600 mm. The precipitation days in the south of the Himalayas is more than 150 d (Du et al., 2004), with precipitation approaching 600 mm. There are two special dry belts in the south of the Himalayas, the east of the Nujiang River in TR, which formation is related not only to the action of the large orography but also to the partial topography of mountain range leeward slope.
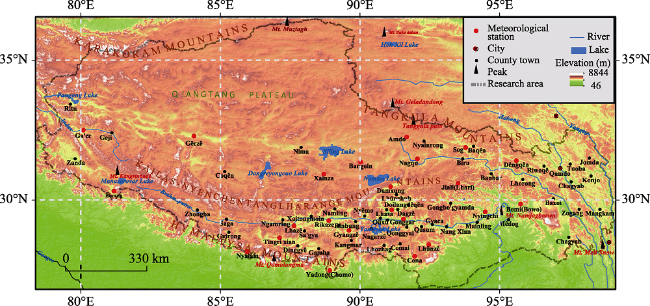
Figure 1 Location of the study area (Tibet Region, China)

1.2 Data sources

We compiled 127 records of drought disasters from 1912 to 2001 that were reported in China’s meteorological disaster books (Tibet Volume) (Liu et al., 2008). We also compiled 12 records of drought disasters from 1995 to 2015 in the climate communiques (Meteorological Bureau of Tibet Autonomous Region, 1995-2015), and 359 records of drought disasters from 1983 to 2014 in disaster statistical data provided by the Meteorological Bureau of the Tibet Autonomous Region. By cross-checking among different data sources, we established a database of drought disasters in the TR with 1182 records.
A total of 74 basic meteorological stations have been built in the TR successively since 1951. And we analyzed drought disasters by use of meteorological data from 23 stations in TR which were obtained from the China meteorological data service center (Figure 1). Socio-economic data used to analyze drought disasters and risk evolution were obtained from the Tibet statistical yearbooks of 1965, 1975, 1985, 1995, 2005, and 2015 (TSYEC, 1989; 1996; 2006; 2016). Maps of specific administrative regions were obtained from the 1:4 million basic map database of China (http://www.webmap.cn/map). We selected agricultural and pastoral areas within the TR as the study area (Zhao et al., 2013).

2 Methods

2.1 Disaster risk assessment model

We used the basic model of risk analysis (Geriving, 2006) as the disaster risk assessment method. The formula (UN-ISDR, 2004) for drought disaster risk can be written as follows:
R = H×V
where R indicates the drought disaster risk index, H indicates the hazard risk index of a drought disaster, and V indicates the vulnerability of a drought disaster.
We used the analytic hierarchy process to calculate the weighting of every index of drought disaster risk. In this process, we determined the rationality of the weighting through the consistency ratio (CR). All CR values were less than 0.1, and the weighting of every index passed the CR consistency test.

2.2 Drought disaster hazard index

In this study, the frequency and intensity of a historical disaster hazard was referred to as a historical disaster hazard, while other natural factors were referred to as potential disaster hazard (Table 1). On the basis of the weighted combination of the corresponding indexes, the hazard posed by a drought disaster was obtained (see Formula 1, Zhao et al., 2013).
$H=0.4{{H}_{l}}+0.6{{H}_{q}}=0.4(0.5{{h}_{p}}+0.5{{h}_{q}})+0.6(0.53{{h}_{j}}+0.173{{h}_{q}}+0.197{{h}_{s}})$
Table 1 The index system used in drought disaster hazard assessment
Grade I indexes Grade II indexes Grade Ⅲ indexes
$H$ Risk Hl Historical risk (0.4) Historical drought frequency (0.500);
Historical drought intensity (0.500)
Hq Potential risk (0.6) Annual mean precipitation (0.530); Annual mean temperature (0.173); Average runoff depth (0.297)
where H represents the hazard of a drought disaster, Hl represents the historical disaster hazard, hp is the number of years with drought disasters in a county administrative unit every 10 years, Hq is the potential disaster hazard, hj is the annual average precipitation, hq is the annual average temperature, and hs is the average runoff depth. The value determined by the formula is the weighting coefficient, which indicates the contribution to the overall risk, the reliability of data, and expert assignment, with AHP used to calculate the weighting of each index. Because the measurement unit and the physical dimensions of each index are different, the threshold method was used to standardize all data used in the calculation.

2.3 Drought disaster vulnerability

The physical exposure of drought disaster in the TR refers to the quantity or value of the risk-bearing body, i.e., population, livestock, or farmland, which is a necessary condition for the existence of a drought disaster. Susceptibility reflects the ability of a risk-bearing body to resist a natural disaster. The ability to cope with disasters is a function of the social system that helps predict, defend, adapt, and recover from disaster, and includes the availability of people, money, and materials (Table 2).
Table 2 The index system of drought disaster vulnerability assessment
Grade I
indexes
Grade II indexes Grade Ⅲ indexes
V E Physical exposure (0.286) Number of animals per unit area/cultivated area (0.173); Population density (0.297); Proportion of agricultural output/Proportion of animal husbandry output (0.530)
Vulnerability S Susceptibility (0.286) Dry land proportion/Grassland proportion (0.667); Grain yield/ Proportion of large domestic animals (0.333)
D ability to cope (0.428) Di Basic disaster capability (0.6) Per-capita net income of farmers and herdsmen (0.317); Per cultivated area/Per grassland area (0.091); Grain output per capita/Livestock per capita (0.091); Average cultural level of farmers and herdsmen (0.2); Topographic relief (0.091); Government emergency management capability (0.210)
Dz Special disaster capacity (0.4) Meteorological station density (0.167); Engineering disaster prevention ability (0.833)
The formula (Zhao et al., 2013) can be written as:
V = E + S + (1 - D)
where V indicates the vulnerability to a drought disaster, E is the physical exposure index, S is the susceptibility index, and D is an index of the ability to cope with disasters. As part of the risk analysis of drought disasters in the TR, based on the values of the vulnerability indexes of the TR in 1965, 1975, 1985, 1995, 2005, and 2015, the physical exposure, susceptibility, and ability to cope with disasters of the TR were calculated. A comprehensive index of the vulnerability of drought disasters in the TR was also calculated.

3 Trend of drought disasters in Tibet Region

3.1 Spatio-temporal variations of the frequency of drought disasters

From the data analyses, the frequency of drought disasters in the TR varied substantially in the past 100 years, although there was a lack of statistics in some years. The results of database we generated were similar to that of the contemporary statistical records, and were therefore considered to be reliable. In general, the frequency of drought disasters occurred in the TR (Figure 2a) showed a rising trend. There are eight years in 1912, 1927, 1936, 1967, 1972, 1979, 1989 and 2001 with high frequency drought disasters occurred at a rate of 74 times/a covering the entire region. Apparently, the year 1967 is a “tipping point” because high intensity and frequency drought disaster became more frequent later. From the 1910s to 1930s, high frequency of drought concentrated in one year of every decade, while low frequency was for other years. And the average frequency in these three decades were 9.2 times/a, 7.4 times/a and 7.7 times/a respectively. In the following 1940s and 1950s, the TR seemed to turn into a “dormant period” of drought, and it was rarely counted, only in 1956 and 1959. Therefore, the occurrence frequency of droughts for these two decades were 0 time/a and 1.2 times/a. But the sudden turning took place in the 1960s. Drought disaster like being detonated, not only did the frequency suddenly increase, but it happened almost every year. As a result, high frequency of drought lasted about 40 years with average frequencies of 9.7 times/a, 21.7 times/a, 20.7 times/a and 21.6 time/a were respectively for the 1960s, 1970s, 1980s and 1990s. Since 2000, the number of drought disaster decreased slightly, with average frequency of 12.7 times/a. Some recent research also presented a severe dryness condition in this region calculated by different meteorological indexes over 40 years (Liang et al., 2018; Li et al., 2019).
Figure 2 Spatio-temporal variation of drought disasters in the Tibet Region

(a) Frequency of drought disasters in the TR from 1912 to 2012; (b) A wavelet analysis of the cyclic variation of drought disasters in the TR from 1965 to 2015; (c) The spatial pattern of changes in the frequency of drought disasters in the TR (red for increasing areas, blue for decreasing areas)

At the same time, it was found that the frequency of drought disasters in the TR displayed a strong periodicity. A wavelet analysis indicated that there were three distinct cycles of drought occurrence (Figure 2b). These included 5, 15, and 27 years of cycles. And there were obvious changes in the three cycles. The 5-year cycle gradually extended to an 8-year cycle over the past 10 years, with a signal enhancement in the frequency of occurrence. The 15-year cycle was also prolonged, but the periodic signal was gradually weakened. The 27-year cycle was extended to 30 years within the past 10 years. From the spatial pattern of drought disaster frequency (Figure 2c), the area affected by drought disaster in the vast majority of the TR declined. The frequency of drought disasters in Nagqu decreased by 0.05 times/10a, and the frequency of drought disaster in the west of Qamdo and Nyingchi increased by 0.03-0.09 times/10a. In some dry hot valleys, the frequency of drought disasters increased significantly, especially in Rikaze.

3.2 Hazard evolution of drought disasters

In disaster risk assessment, the frequency and intensity of a historical disaster hazard are commonly used to indicate the hazard intensity. Factors such as precipitation, temperature, runoff depth, and river network density can be as hazard intensity factors. The frequency and intensity of historic drought disasters is an indirect reflection of hazard posed by a regional drought disaster. Regional annual precipitation and annual runoff depth reflect the availability of water resources in a particular region. Temperature indirectly affects changes in water resource availability. All of these indicators have their own degree of usefulness in a hazard assessment.
In this study, 1965, 1975, 1985, 1995, 2005, and 2015 were the representative years, for which historical literature, disaster statistics, ground-based meteorological data, and average runoff depth data were used to analyze and calculate the historical disaster hazard and potential disaster hazard of 72 counties in the TR. We then obtained a hazard distribution map of drought disaster in these five representative years (Figure 3).
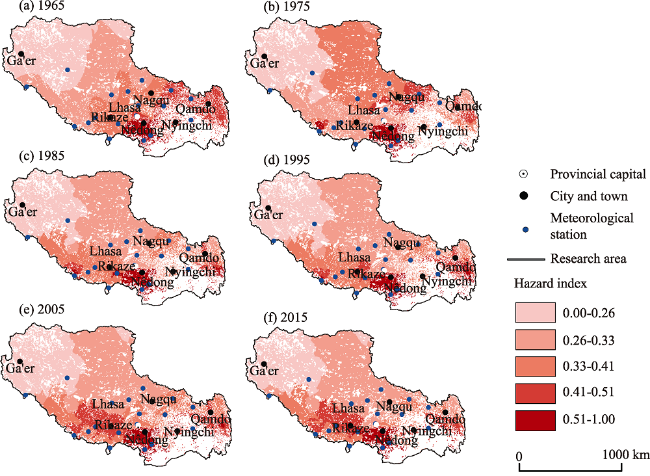
Figure 3 Hazard evolution of drought disaster in the Tibet Region from 1965 to 2015
From Figure 3, it can be seen that the hazard of drought disaster in most agricultural and pastoral areas of the TR was low during 1965-2015. The areas with high risk of drought disaster were mainly concentrated in Nedong, Qamdo, Nagqu, Lhasa, and Rikaze. The hazard of drought disaster was high in the agricultural regions. Since the 1980s, the northwest and north of the agricultural and pastoral areas have experienced a relatively low level of hazard. Specifically, the risk of drought disasters in Qamdo and Nagqu has gradually weakened, while Lhasa and Rikaze have experienced a high level of hazard. The area at high hazard of a drought disaster (value>0.41 in Figure 3) has expanded from 15.7% to 23.1% by spatial statistics based on the historic data between 1965 and 2015. In contrast, the low value areas (value<0.33 in Figure 3) decreased from 68.7% to 52.4%. It indicated that the severity of drought has increased. Under the background of global change, the trend of the occurrence of drought disasters in the pastoral areas of the TR has diminished, but the severity of drought disasters in the agricultural region has shown a strengthening trend. With the frequency and hazard of drought disasters showed decreasing pattern in general, we need to consider why the frequency of drought disasters shows a strengthening and increasing trend in agricultural areas of the TR.

4 Evolution of vulnerability to drought disasters in Tibet Region

The understanding of vulnerability in disaster risk assessment is very complex (Andrey et al., 2003), and its meaning is also developing and changing (Birkmann et al., 2006). It is generally understood to consist of three components: physical exposure, susceptibility, and the ability to cope with disasters. All three components are dynamic, varying over spatial and temporal scales, and depend on economic, social, geographical, demographic, cultural, institutional, managerial, and environmental factors (IPCC, 2014).

4.1 Changes in the physical exposure to drought disasters

Taking the whole TR as the basic unit, we selected population density, the area of cultivated land, unit area livestock volume, proportional value of agricultural output, and proportional value of livestock output to assess the physical exposure to drought disasters. By combining values with index weightings, a map showing the physical exposure to drought disasters in 1965, 1975, 1985, 1995, 2005, and 2015 for the TR was obtained by a dimensionless calculation (Figure 4).
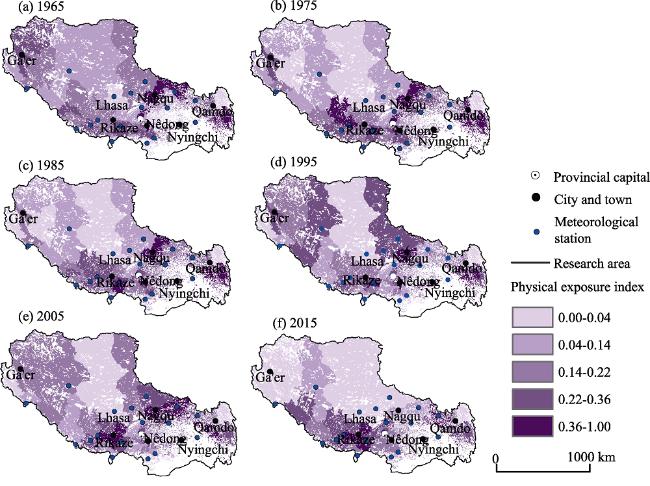
Figure 4 Changes in the physical exposure to drought disaster in the Tibet Region from 1965 to 2015
There was an increase in the area of low physical exposure (value<0.14 in Figure 4) from 50.3% in 1965 to 71.6% in 2015, but more importantly, the spatial disparity of the physical exposure is significant. Before the 1980s, due to the underdeveloped industrial system in the TR, agriculture and animal husbandry accounted for a high proportion of the physical exposure to a drought disaster, with a significantly increasing trend in Nagqu, Rikaze, Lhasa, Shannan, Nyingchi, and Qamdo. Between the 1980s and 1990s, the physical exposure in the northern part of the TR increased continuously due to the development of animal husbandry. However, the physical exposure in Lhasa, Shannan, Rikaze, and Qamdo remained stable. With the rapid urbanization and industrialization after 2005, especially the opening of the Qinghai-Tibet Railway, industrialization in the TR was rapidly accelerated. The agricultural output increased as industry developed. The proportion of agriculture and animal husbandry facing a physical exposure to a drought disaster was relatively low, but with the increasing population growth and the expansion of arable land, the number of livestock increased, and the physical exposure of the TR to drought disasters has remained high, with an increasing trend, especially in the south-central and eastern agricultural regions of the TR.

4.2 Changes in susceptibility to drought disasters

Susceptibility reflects the response to physical exposure to certain natural disasters, and the dynamic characteristics are reflected by the physical exposure of disaster-bearing bodies when they are subjected to natural disasters (Ge et al., 2007). In the face of the same or different natural disasters, the susceptibilities of disaster-bearing bodies can be significantly different due to differences in location, essential attributes, and morphology. Susceptibility depends mainly on the physical characteristics of a disaster-bearing body and the risk environment in which it is located. According to the characteristics of a drought disaster and the physical reality of the TR, we selected the proportion of dry land, grassland, grain yield, and livestock as the susceptibility index of a drought disaster. By combining values with index weightings, a map showing the susceptibility to drought disasters in 1965, 1975, 1985, 1995, 2005, and 2015 for the TR was obtained by a dimensionless calculation (Figure 5).
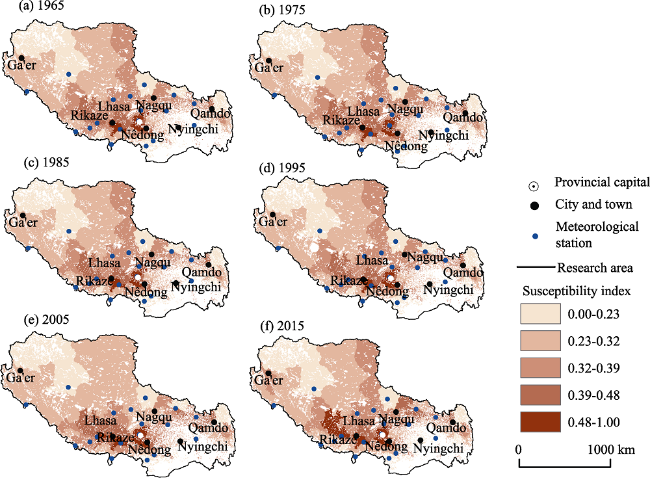
Figure 5 Changes in susceptibility to drought disasters in the Tibet Region from 1965 to 2015
The susceptibility to drought disasters in each representative year in the TR showed a slight decreasing in general. The highest value of >0.8, compared with the highest value of about 0.72 in other years, appeared near Lhasa and Rikaze in 2005. About 60% of the areas were in low susceptibility to drought disasters (value<0.32 in Figure 5) and only about 10% of the areas were high (value >0.39 in Figure 5). Before the 1970s, due to steady development of agriculture and animal husbandry in the TR, the area of arable land increased, but there was a lag in the development of irrigation and water conservation efforts. Thus the proportion of dry land was relatively high. At the same time, the number of livestock in pastoral areas increased steadily. After the 1980s, transformation of operational pattern of agriculture and animal husbandry had undertaken in the TR. The implementation of the project known as “returning farmland to forest or grass,” and the adjustment of land use structure in some agricultural valleys had led to significant decrease of dry land area, while the proportion of small livestock (sheep etc.) increased and the proportion of big livestock (yaks etc.) decreased in pastoral areas. These resulted in the decrease of susceptibility to drought disaster in the TR. However, the susceptibility to drought disaster in Rikaze and Lhasa was still relatively high. This is mainly because the proportion of dry land in the regions was relatively high, while the unit area grain output had increased.

4.3 Changes in the ability to cope with disasters

The ability to cope with disasters is negatively related to the vulnerability of the disaster bearing bodies. The greater ability to cope with disasters has, the lower the vulnerability and the smaller the risk from a natural disaster is. The ability to cope with a drought disaster is related to individual income of farmers and herdsmen, as well as the ability of government to manage such situations, and the prediction and prevention of disasters. We selected the per capita net income of farmers and herdsmen, per capita arable land, per capita grassland area, per capita grain yield, per capita number of livestock, education of farmers and herdsmen, relief of the land surface, government emergency management capacity, density of meteorological stations, and engineering disaster prevention and mitigation capacity as an index to evaluate the ability to cope with drought disasters. By combining values with index weightings, a map showing the ability to cope with drought disasters in 1965, 1975, 1985, 1995, 2005, and 2015 for the TR was obtained by a dimensionless calculation (Figure 6).
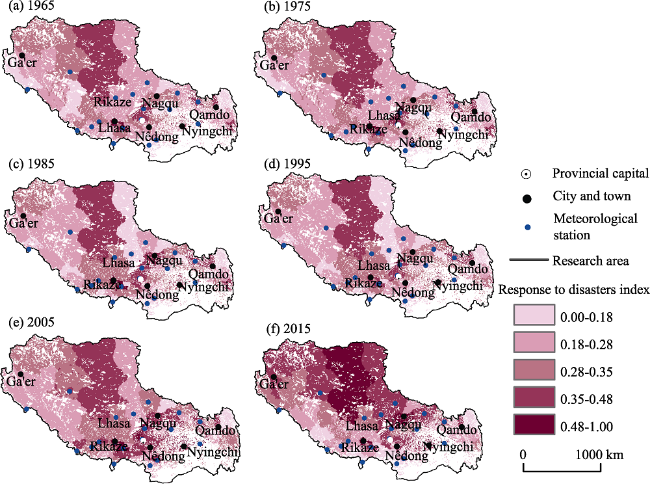
Figure 6 Changes in the ability to cope with drought disasters in the Tibet Region from 1965 to 2015
The ability to cope with disasters in the TR was improved and enhanced over the study period with its average value from 0.29 in 1965 up to 0.37 in 2015. Yet such capacity in the pastoral area in the northern TR had still remained as a challenge. Over the 50 years, the range of high ability to cope with disasters had expanded significantly, from 33.7% to 59.0%. Since the 1960s, the government implemented projects in pastoral areas of the TR to encourage and support animal husbandry. The projects included provision of fodder, housing, medicine baths, drinking water as measures to cope with snow disaster, as well as provision of other support measures for large scale disaster prevention. The ability to cope with disasters in the northern pastoral area of the TR has thus been greatly improved. In addition, the increase in the income of the herdsmen, and increase in the number of livestock, as well as improvement in the educational level of local people have improved their ability to cope with natural disasters. Nima County has a large area of land and few people. Therefore, its per capita grassland area and per capita number of livestock are large. When a drought disaster occurs, the higher per capita grassland area and per capita number of livestock can effectively reduce the adverse impact caused by drought disaster. These conditions explain the region’s strong ability to cope with disasters. The populations in the areas surrounding the important cities in the TR are relatively concentrated, and the per capita arable land area, per capita grassland area, per capita grain yield, and per capita number of livestock are relatively low in these areas. However, the ability to cope with disasters is high. This is because these regions are part of a regional economic center and farmers and herdsmen in these regions have a higher educational level. At the same time, as regional administrative centers, the ability of government emergency management and disaster engineering prevention and mitigation in these regions are high. These rendered the locals needed capacity to cope with drought disasters as well. Furthermore, due to the ongoing socio-economic development, the per capita net income of farmers and herdsmen has increased significantly, which has improved their ability to deal with regional drought disaster risk.

4.4 Changes in the vulnerability to drought disaster

The physical exposure, susceptibility, and the ability to cope with disasters in each representative year for the TR are dimensionless according to the formula of vulnerability and index weighting in Table 2. A map showing the vulnerability to drought disasters in 1965, 1975, 1985, 1995, 2005, and 2015 for the TR could then be obtained (Figure 7).
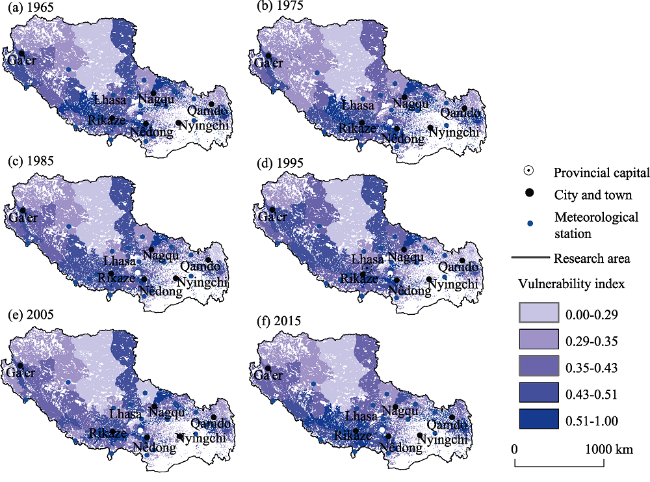
Figure 7 Changes in the vulnerability to drought disasters in the Tibet Region from 1965 to 2015
The vulnerability to drought disaster risk in the TR had clearly changed over the study period, with a decline in the northwestern and northern parts. The average value of vulnerability to drought disaster risk in 1965 is 0.46, after some ups and downs, 0.38 is obtained in 2015. This was mainly caused by a decrease in the number of high vulnerable areas, from 35.8% to 26.9% during this period. In the 1960s and 1970s, the vulnerability to drought disaster risk in Ali (Ngari), Rikaze, Shannan, Lhasa, Nagqu, and Qamdo was relatively high, which was mainly due to the relatively low ability to cope with disasters and the large physical exposure and susceptibility. After the 1980s, although there was an increase in population density, the number of livestock, and arable land area, the infrastructure improved significantly and the proportional value of agricultural output decreased in terms of gross domestic product (GDP), which significantly enhanced the ability to cope with disasters and the vulnerability to drought disaster risk decreased significantly. The vulnerability of the drought disaster risk in agricultural areas such as Rikaze and Shannan increased in recent years, which was associated with an increased susceptibility to drought disaster in the region. The construction of effective animal husbandry facilities such as epidemic prevention and livestock drinking water etc. has increased significantly in the TR, but there has been little construction of basic facilities including irrigation systems etc. in other agricultural areas. Therefore there is a need to improve construction in agricultural areas as disaster prevention measures.

5 Risk evolution of drought disasters in Tibet Region

5.1 Evolution of hazard and vulnerability of drought disasters

Through the analysis reported in sections 1.2, 2.1, 2.2, and 2.3, the drought frequency in most parts of the TR was found to have a downward trend. Yet slight increase had indicated in some valley areas. Therefore, the hazard of a drought disaster risk in the TR showed obvious decrease over the years. If the population density and value of the agricultural output of the TR remain unchanged, the drought disaster risk in the region may show a significant downward trend. However, from the risk levels calculated in section 3.2 with comparison to the result in the 1960s, the degree of risk and area subject to drought disasters in the TR had increased substantially. The main reason for this is because the vulnerability to drought disasters increased. Any mainstream risk assessment for a natural disaster is closely related to the degree of vulnerability to risk and the risk-bearing body. The extent of a regional natural disaster is not directly proportional to the losses caused by the disaster, but it depends on the vulnerability of the disaster-bearing body. Vulnerability is a consequence of complex human social system, which is comprised of natural, economic, and social vulnerability elements. Variation in these components results in great differences in the understanding of vulnerability. Regardless of how vulnerability is understood, the vulnerability caused by physical exposure, susceptibility, and the ability to cope with disasters are the key determinants of risk in natural disasters (IPCC, 2014).

5.2 Risk evolution of drought disasters

Based on the results calculated in sections 1.2 and 2.4, and the index weightings in Table 2, a map showing the risk of drought disasters in 1965, 1975, 1985, 1995, 2005, and 2015 for the TR was obtained (Figure 8).
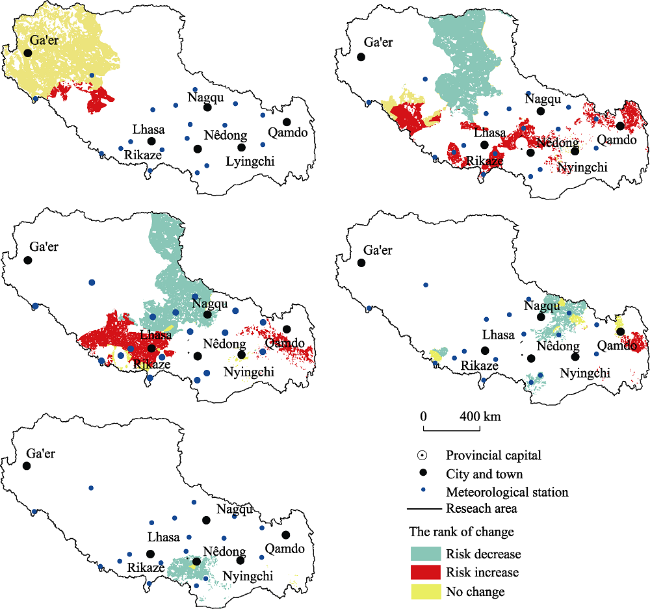
Figure 8 Changes in the risk of drought disasters in the Tibet Region from 1965 to 2015
The risk of drought disaster occurrence in the TR increased from low to middle risk level in 1965 to the middle to high risk level in 2015. The average risk value of drought disaster is rising significantly, with the average risk value being 0.06 in 1965 while increased to 0.14 in 2015. Large risk difference was presented in its distribution and changes reflected by an expansion of high-risk area (value>0.19 in Figure 8) from 23.1% to 16.2% together with a shrinkage of low area (value<0.16) from 66.0% to 55.6%. The northern part of the TR evolved from a low to a middle risk area, and the area with low risk decreased. The southern part of the TR evolved from a middle risk in the 1960s to a high risk in the current period. In the 1960s, the only high-risk region among the agricultural areas of the TR was Shannan, with other areas having a middle or a low risk. Since the 1970s, the risk of a drought disaster occurrence in agricultural areas intensified, with Qamdo evolving from a middle to a high risk. It turned out to be the area with the highest drought disaster risk in the TR. The risk of a drought disaster occurrence in agricultural area of the TR was generally higher than it was in an animal husbandry area. The risk of a drought disaster occurrence in the pastoral area of the northern TR increased, but the rate of increase was clearly lower than agricultural areas. Therefore, drought disaster risk prevention in the TR should focus on agricultural areas.
Figure 9 Spatio-temporal changes of drought disaster risk in agricultural and pastoral areas in the Tibet Region from 1965 to 2015

6 Conclusions

(1) Most parts of the TR belong to arid and semi-arid area. Drought is one of the most serious meteorological disasters in this area and occurs generally. Mover, drought always has significant impact on agriculture and livestock. In the past century, e.g., 1937, 1956, 1982, there occurred severe drought in the TR and the precipitation decreased by 20%-30% prior to the normal years. Especially the drought occurred in 1982-1983, high temperature and less rainfall made it difficult to seed on most of the farmland, crops died and the affected area was 33,350-157,412 ha, total grain output was only 200,000 t and the grain yield was only 1920 kg/ha.
(2) On spatial and temporal scales, the hazard of drought in agricultural and pastoral areas changed to a certain extent in most regions. The area affected by drought disaster showed an increasing trend over time, with the most obviously affected area being the south-central region, where the hazard was maintained a high level. The vulnerability of agricultural and pastoral areas in the TR to drought disasters was relatively low. But in the last 50 years, there was an increasing trend in the central and eastern parts of the TR, while the northern displayed a downward trend. This was mainly because the number of small livestock declined and the disaster response capacity was generally improved, while the vulnerability of agricultural areas had increased.
(3) From 1965 to 2015, the risk of drought disaster in the TR is significantly increased based on the average risk value from 0.06 to 0.138, and an increase of 6.8% in high-risk area. Over the past 50 years, the ability to cope with disasters had been greatly improved, which is reflected in the increase of 25.8% in high ability areas and the decrease of 14.7% in low ability areas. However, the hazard of drought disaster was significantly enhanced with the disappearance of 16.3% of the low value area and the increase of 7.4% of the high value area.
(4) According to the drought risk for agricultural and pastoral areas in the TR from 1965-2015, the integrated risk of the TR indicated occurrence of more severe events, or increasing pattern throughout the region. Drought risk in agricultural areas was generally higher than in pastoral areas. The northwestern part had a low level of risk, while there was a decreasing trend in the northern and an increasing trend in the southwestern and eastern parts, especially in Qamdo. The increased vulnerability locally and significantly enhanced hazard of drought disaster was the key determinant of drought disaster risk and its impact. Therefore, agricultural areas of the TR are the focal locations where risk of drought disaster needs to be managed.
The risk of drought disasters in different regions varied over the study period in the agricultural and pastoral areas of the TR. The historical hazard, potential hazard, physical exposure, susceptibility, and the ability to cope with disasters varied among different parts of the region. Therefore, the factors that played a leading role in determining the drought risk in different parts were also different, which should be the focus of further studies.

Acknowledgments

We thank Dr. Batin Qiuying and the anonymous reviewers providing valuable suggestions and constructive comments during the review process.
[1]
An Z S, Kutzbach J E, Prell W L et al., 2001. Evolution of Asian monsoons and phased uplift of the Himalaya-Tibetan Plateau since Late Miocene times. Nature, 411(6833):62-66.

[2]
Andrey J, Mills B, Leahy M et al., 2003. Weather as a chronic hazard for road transportation in Canadian cities. Natural Hazards, 28(2/3):319-343.

[3]
Ashok K M, Vijay P S , 2010. A review of drought concepts. Journal of Hydrology, 391(1/2):202-216.

[4]
Birkmann J , 2013. Measuring Vulnerability to Natural Hazards: Towards Disaster Resilient Societies. Tokyo: United Nations University Press, 26-45.

[5]
Du Jun, Hu Jun, Chen Hua et al., 2006. Trend of surface humid index in the middle reaches of the Yarlung Zangbo River over Tibet in recent 40 years. Journal of Natural Resources, 21(2):196-203. (in Chinese)

[6]
Du Jun, Ma Yucai , 2004. Climatic trend of rainfall over Tibetan Plateau from 1971 to 2000. Acta Geographica Sinica, 59(3):375-382. (in Chinese)

[7]
Du Jun, Xiang Yuyi , 2000. Research on climatic character and defensive measures against summer drought in Tibet. Agricultural Research in the Arid Areas, 18(1):101-107. (in Chinese)

[8]
Gao Maofang, Qiu Jianjun , 2011. Characteristics and distribution law of major natural disasters in Tibetan Plateau. Journal of Arid Land Resources and Environment, 25(8):101-106. (in Chinese)

[9]
Ge Quansheng, Zou Ming, Zheng Jingyun et al., 2008. Integrated Assessment of Natural Disaster Risks in China. Beijing: Science Press, 2-275. (in Chinese)

[10]
Geriving S , 2006. Multi-risk assessment of Europe’s regions. In: Birkmann J (ed). Measuring Vulnerability to Hazards of National Origin. Tokyo: United Nations University Press, 210-226.

[11]
Houghton J T, Ding Y H , 2001. The scientific basis. In: IPCC. Climate Change 2001: Summary for Policy Maker and Technical Summary of the Working Group I Report. London: Cambridge University Press, 98.

[12]
IPCC, 2014. Climate Change 2014: Synthesis Report. IPCC, Geneva, Switzerland, 1-151.

[13]
Kutzbach J E, Prell W L, Ruddiman W F , 1993. Sensitivity of Eurasian climate to surface uplift of the Tibetan Plateau. Journal of Geology, 101(2):177-190.

[14]
Li Sisi, Yao Zhijun, Liu Zhaofei et al., 2019. The spatio-temporal characteristics of drought across Tibet, China: Derived from meteorological and agricultural drought indexes. Theoretical and Applied Climatology, 1-16.

[15]
Liang Jingjing, Zhang Bo, Ma Bin et al., 2018. Drought evolution characteristics on the Tibetan Plateau based on daily standardized precipitation evapotranspiration index. Journal of Glaciology and Geocryology, 40(6):1100-1109. (in Chinese)

[16]
Liu Guangxuan, Wen Kegang , 2008. Chinese Meteorological Disasters Ceremony (Tibet Volume). Beijing: China Meteorological Press, 8-25. (in Chinese)

[17]
Liu Xiaodong, Cheng Zhigang, Zhang Ran , 2009. The A1B scenario projection for climate change over the Tibetan Plateau in the next 30-50 years. Plateau Meteorology, 28(3):475-484. (in Chinese)

[18]
Liu Xiaodong, Li Li, An Zhisheng , 2001. Tibetan Plateau uplift and drying in Eurasian interior and Northern Africa. Quaternary Sciences, 21(2):114-122. (in Chinese)

[19]
Manabe S, Broccoli A J , 1990. Mountains and arid climates of middle latitudes. Science, 247(4939):192-194.

[20]
Manabe S, Terpstra T B , 1974. The effects of mountains on the general circulation of the atmosphere by numerical experiments. Journal of Atmospheric Science, 31(1):3-42.

[21]
Sun Honglie , 1998. Formation and Evolution of the Qinghai-Xizang Plateau. Shanghai: Shanghai Scientific & Technical Publishers, 152-194.

[22]
Tenzin Zuozha , 2008. Civil Administration in Tibet for 30 years (1978-2008). Beijing: China Society Press, 5-98. (in Chinese)

[23]
Tibet Statistical Yearbook Editorial Committee (TSYEC), 1989. Tibet Social Economy Statistical Yearbook(1988). Beijing: China Statistics Press (in Chinese)

[24]
Tibet Statistical Yearbook Editorial Committee (TSYEC), 1996. Tibet Statistical Yearbook(1995) . Beijing: China Statistics Press (in Chinese)

[25]
Tibet Statistical Yearbook Editorial Committee (TSYEC), 2006. Tibet Statistical Yearbook(2005). Beijing: China Statistics Press (in Chinese)

[26]
Tibet Statistical Yearbook Editorial Committee (TSYEC), 2016. Tibet General Survey Team of National Bureau of Statistics, Tibet Statistical Yearbook(2015). Beijing: China Statistics Press (in Chinese)

[27]
UNYISDR, 2004. Living with Risk: A Global Review of Disaster Reduction Initiatives. Geneva: United Nations Publication.

[28]
Xiong Junnan, Liu Zhiqi, Fan Chunkun et al., 2017. Temporal and spatial distribution characteristics and changing trend of meteorologic disaster in Tibet Autonomous Region from 1983 through 2013. Journal of Glaciology and Geocryology, 39(6):1221-1231. (in Chinese)

[29]
Xu Zongxue, Zhang Ling, Huang Junxiong et al., 2007. Long-term trend of temperature, precipitation and relative humidity in the Tibetan region. Meteorological Monthly, 33(7):82-88. (in Chinese)

[30]
Ye Duzheng, Gao Youxi , 1979. Meteorology of Qinghai-Xizang Plateau. Beijing: Science Press, 1-278. (in Chinese)

[31]
Zeng Xingquan, Bai Lijun, Wei Zexiu et al., 2016. Transcriptome analysis revealed the drought-responsive genes in Tibetan hulless barley. BMC Genomics, 17(1):386.

[32]
Zhang Hezhen, Nimaji, Duojiciren, 2016. Variation characteristics of the longest continuous dry days: Tibet, 1961-2010. Chinese Agricultural Science Bulletin, 32(35):151-154. (in Chinese)

[33]
Zhao Junfang, Guo Jianping, Fang Shibo et al., 2011. Trends of Tibet’s dry-wet condition under future climate scenario. Chinese Journal of Agrometeorology, 32(1):61-66. (in Chinese)

[34]
Zhao Zhilong, Zhang Yili, Liu Fenggui et al., 2013. Drought disaster risk analysis of Tibetan Plateau. Journal of Mountain Science, 31(6):672-684. (in Chinese)

Outlines

/