
Journal of Geographical Sciences >
Estimation and analysis of the ratio of transpiration to evapotranspiration in forest ecosystems along the North-South Transect of East China
|
Ren Xiaoli (1984–), PhD, E-mail: renxl@igsnrr.ac.cn |
Received date: 2018-08-22
Accepted date: 2018-10-20
Online published: 2019-12-05
Supported by
National Key Research and Development Program of China(No.2015CB954102)
National Natural Science Foundation of ChinaNo.41571424(No.31700417)
National Natural Science Foundation of China(No.41571424)
Copyright
The ratio of transpiration to evapotranspiration (T/ET) is a key parameter for quantifying water use efficiency of ecosystems and understanding the interaction between ecosystem carbon uptake and water cycling in the context of global change. The estimation of T/ET has been paid increasing attention from the scientific community in recent years globally. In this paper, we used the Priestly-Taylor Jet Propulsion Laboratory Model (PT-JPL) driven by regional remote sensing data and gridded meteorological data, to simulate the T/ET in forest ecosystems along the North-South Transect of East China (NSTEC) during 2001-2010, and to analyze the spatial distribution and temporal variation of T/ET, as well as the factors influencing the variation in T/ET. The results showed that: (1) The PT-JPL model is suitable for the simulation of evapotranspiration and its components of forest ecosystems in Eastern China, and has relatively good stability and reliability. (2) Spatial distribution of T/ET in forest ecosystems along NSTEC was heterogeneous, i.e., T/ET was higher in the north and lower in the south, with an averaged value of 0.69; and the inter-annual variation of T/ET showed a significantly increasing trend, with an increment of 0.007/yr (p<0.01). (3) Seasonal and inter-annual variations of T/ET had different dominant factors. Temperature and EVI can explain around 90% (p<0.01) of the seasonal variation in T/ET, while the inter-annual variation in T/ET was mainly controlled by EVI (53%, p<0.05).
REN Xiaoli , LU Qianqian , HE Honglin , ZHANG Li , NIU Zhongen . Estimation and analysis of the ratio of transpiration to evapotranspiration in forest ecosystems along the North-South Transect of East China[J]. Journal of Geographical Sciences, 2019 , 29(11) : 1807 -1822 . DOI: 10.1007/s11442-019-1691-1
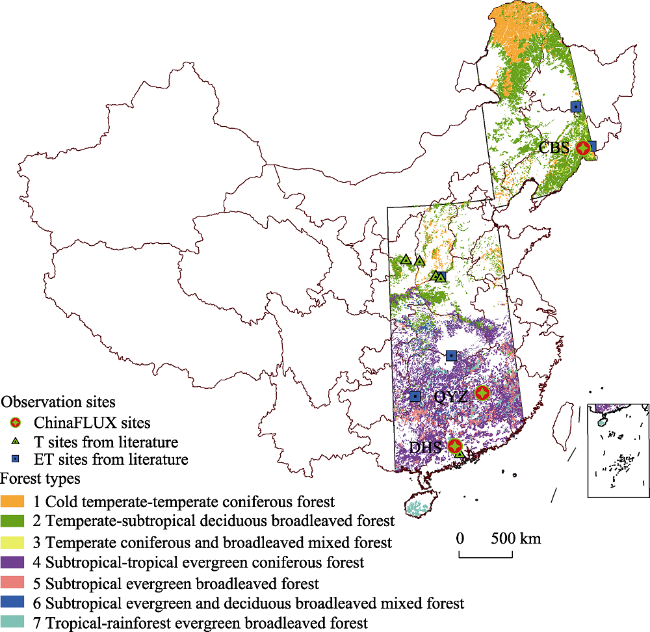
Figure 1 Location of the NSTEC, ChinaFLUX sites and observation sites collected from literature |
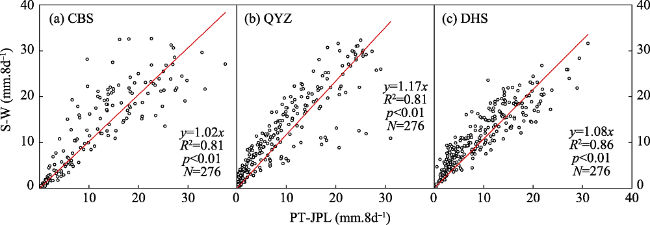
Figure 2 Comparison of the transpiration modeled by the PT-JPL model and the S-W model in CBS, QYZ, and DHS forests during 2003-2008 |
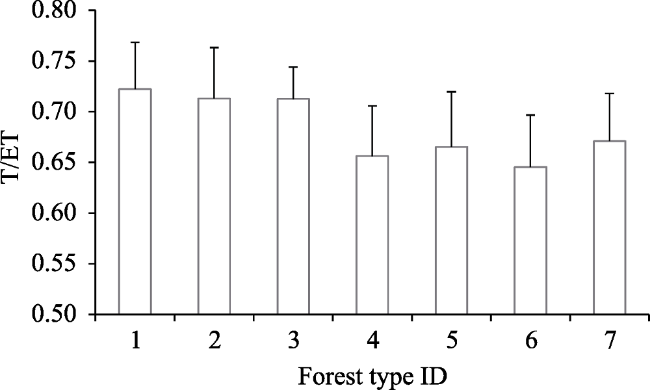
Table 1 Determined values of key model parameters for different forest types along the NSTEC |
| ID | Forest type | β | kpar |
|---|---|---|---|
| 1 | Cold temperate-temperate coniferous forest | 1 | 0.45 |
| 2 | Temperate-subtropical deciduous broadleaved forest | 1 | 0.59 |
| 3 | Temperate coniferous and broadleaved mixed forest | 1.8 | 0.4 |
| 4 | Subtropical-tropical evergreen coniferous forest | 1.5 | 0.3 |
| 5 | Subtropical evergreen broadleaved forest | 1.5 | 0.3 |
| 6 | Subtropical evergreen and deciduous broadleaved mixed forest | 1 | 0.59 |
| 7 | Tropical-rainforest evergreen broadleaved forest | 1 | 0.59 |
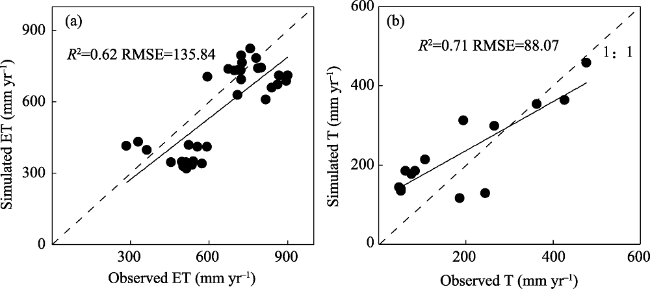
Figure 3 Comparison of the evapotranspiration and transpiration between modeled values by the PT-JPL model and measured values collected from literature |
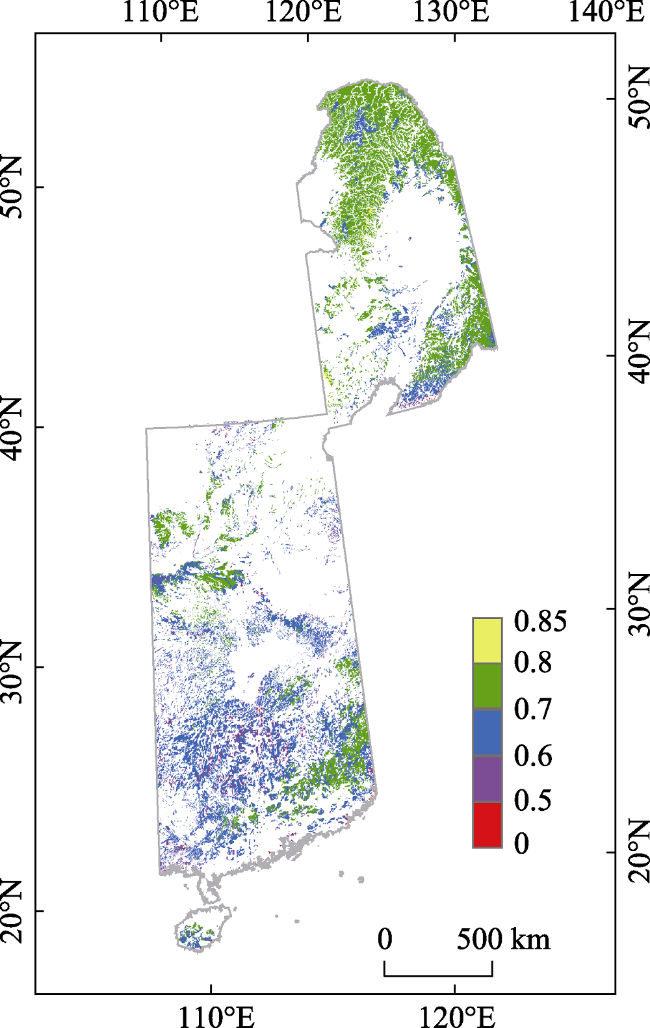
Figure 4 Spatial distribution of averaged T/ET in forests along the NSTEC during 2001-2010 |
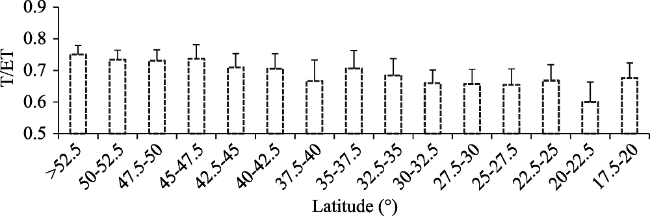
Figure 5 The zonally average T/ET of the forest ecosystems in the NSTEC along latitude |
Figure 6 The average T/ET for different forest types (see Table 1 for the specific forest type names represented by ID) along the NSTEC |
Figure 7 Spatial distribution of seasonal average T/ET in forests along the NSTEC during 2001-2010 |
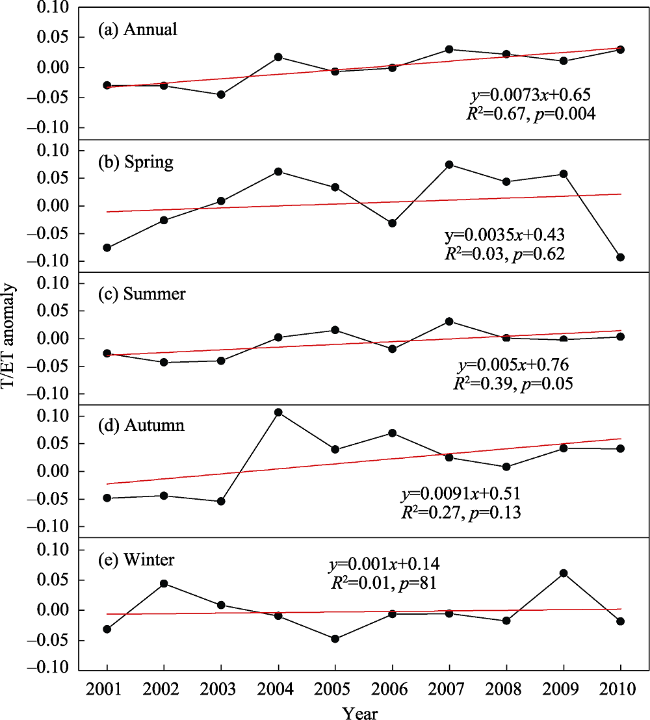
Figure 8 Anomalies of annual and seasonal T/ET averaged over the forests along the NSTEC during 2001-2010 |
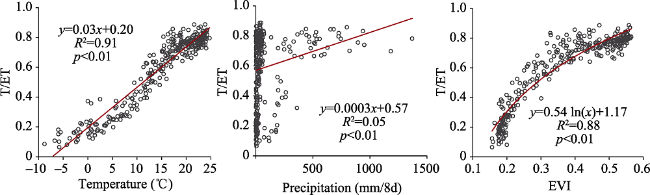
Figure 9 Responses of the modeled seasonal T/ET (8d) to temperature, precipitation, and EVI in the forests along the NSTEC |
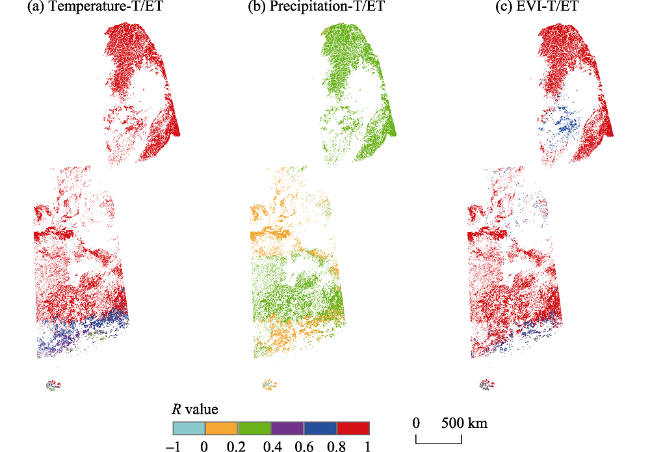
Figure 10 Spatial distribution of the correlation coefficient (R) between the modeled seasonal T/ET (8d) to temperature, precipitation, and EVI in forests along the NSTEC |
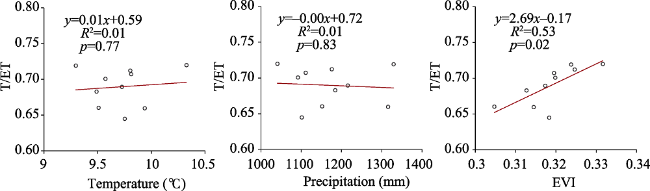
Figure 11 Relationships between the annual T/ET to temperature and precipitation, and EVI in forests along the NSTEC |
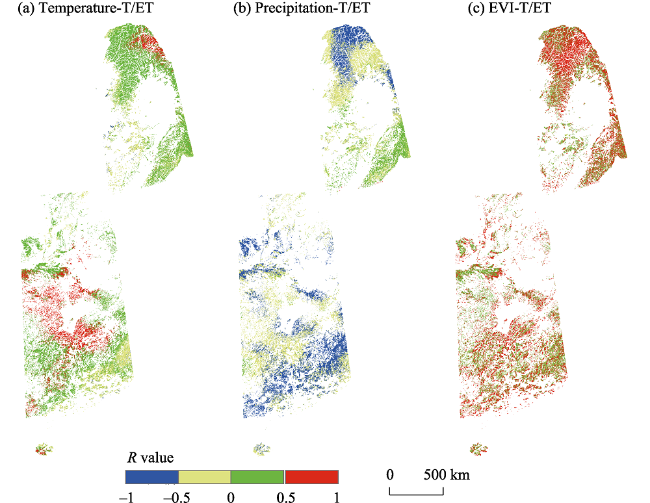
Figure 12 Spatial distribution of the correlation coefficient (R) of the annual T/ET with temperature, precipitation, and EVI in forests along the NSTEC |
| [1] |
|
| [2] |
|
| [3] |
|
| [4] |
|
| [5] |
|
| [6] |
|
| [7] |
|
| [8] |
|
| [9] |
|
| [10] |
|
| [11] |
|
| [12] |
|
| [13] |
|
| [14] |
|
| [15] |
|
| [16] |
|
| [17] |
|
| [18] |
|
| [19] |
|
| [20] |
|
| [21] |
|
| [22] |
|
| [23] |
|
| [24] |
|
| [25] |
|
| [26] |
|
| [27] |
|
| [28] |
|
| [29] |
|
| [30] |
|
| [31] |
|
/
| 〈 |
|
〉 |
