Research Articles

Paddy rice multiple cropping index changes in Southern China: Impacts on national grain production capacity and policy implications

  • JIANG Min 1, 2 ,
  • LI Xiubin 1, 2 ,
  • XIN Liangjie 1 ,
  • TAN Minghong , 1, 2, *
Expand
  • 1.Key Laboratory of Land Surface Pattern and Simulation, Institute of Geographic Sciences and Natural Resources Research, CAS, Beijing 100101, China
  • 2.University of Chinese Academy of Sciences, Beijing 100049, China
Tan Minghong (1970–), PhD and Professor, specialized in land use change and its effects E-mail:

Jiang Min (1989–), PhD Candidate, specialized in land use change and its effects. E-mail: jiangm.15b@igsnrr.ac.cn

Received date: 2018-08-21

  Accepted date: 2018-10-26

  Online published: 2019-12-05

Supported by

National Natural Science Foundation of China(No.41571095)

National Natural Science Foundation of China(No.41161140352)

Copyright

Copyright reserved © 2019. Office of Journal of Geographical Sciences All articles published represent the opinions of the authors, and do not reflect the official policy of the Chinese Medical Association or the Editorial Board, unless this is clearly specified.

Abstract

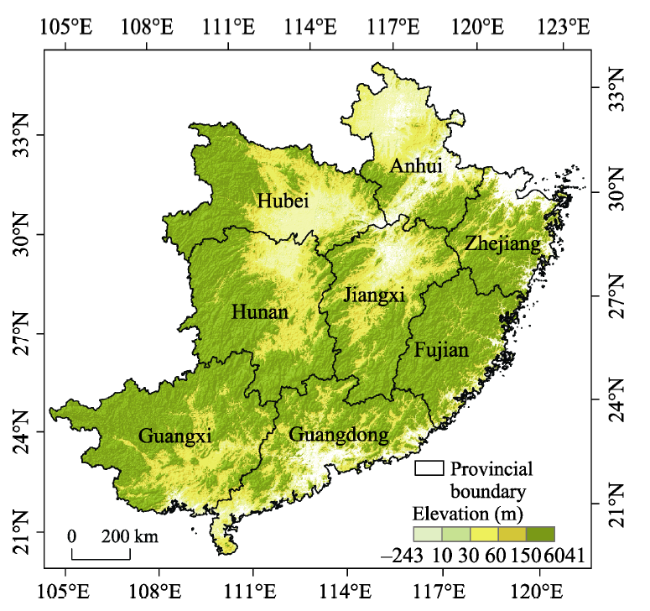
Changes in rice production in Southern China are crucial to national food security. This study employed Landsat images to map the distributions of paddy rice-cropping systems in Southern China in 1990 and 2015. The impact of rice multiple cropping index changes on grain production capacity was then evaluated. Three important results were obtained for the 1990 to 2015 study period. First, the multiple cropping index for rice decreased from 148.3% to 129.3%, and 253.16×10 4 ha of land area was converted from double-cropping to single-cropping rice, termed “double to single”. The area with the most dramatic changes is in the Middle-Lower Yangtze Plain. The rice-cropping system distribution in Southern China showed a change from north to south with double-cropping rice shrinking and single-cropping rice expanding. Second, the “double to single” conversion led to a reduction of 6.1% and 2.6% in rice and grain production, respectively. Hunan and Jiangxi Provinces, located in the main rice producing areas, and Zhejiang, which has shown better economic development, exhibited large reductions in rice production due to the “double to single” conversion, all exceeding 13%. Third, the grain production capacity of converted “double to single” paddy fields is equivalent to that of 223.3 × 10 4 ha of newly reclaimed cultivated land, which is 54% of the total newly cultivated land reclaimed through the 2001-2015 land consolidation project. It is also 1.7 times the target goal for newly cultivated land in the national land consolidation plan for 2016-2020. Making full use of the converted “double to single” paddy fields can save 167.44 billion yuan in newly reclaimed cultivated land costs. Therefore, instead of pursuing low-quality new arable land, it is better to make full use of the existing high-quality arable land. Based on these results, the government should change the assessment method for cultivated land balance, and incorporate the sown area increased by improving the multiple cropping index into the cultivated land compensation indicator.

Cite this article

JIANG Min , LI Xiubin , XIN Liangjie , TAN Minghong . Paddy rice multiple cropping index changes in Southern China: Impacts on national grain production capacity and policy implications[J]. Journal of Geographical Sciences, 2019 , 29(11) : 1773 -1787 . DOI: 10.1007/s11442-019-1689-8

1 Introduction

Food security has remained an important and popular research subject worldwide (Huang and Yang, 2017; Schmidhuber and Tubiello, 2007). Food self-sufficiency is the main principle of China’s current food security policy, which is ensured based on cultivated land resources (Fu et al., 2001). China is a large country with high population density and a relatively lower area of cultivated land; the per capita cultivated land of China is less than 1.5 mu (0.1 ha). China feeds nearly 19% of the world’s population with 9% of the world’s cultivated land (NBSC, 2017). Since the reform and opening up, with rapid urbanization and industrialization, large tracts of high-quality cultivated land have been occupied for construction purposes (Ju et al., 2018), especially in the eastern coastal areas of China that host rapid economic development (Lichtenberg and Ding, 2008). Approximately 3 million ha of high-quality cultivated land have been occupied by built-up areas between 1996 and 2009 (Kong, 2014). Nearly 80% of cultivated land converted to built-up areas was located in eastern and central China from 1991 to 2001 (Zhang et al., 2007). The rapid and great loss of high-quality cultivated land has attracted the attention of the Chinese government. In 1998, the well-known farmland protection policy, termed the Dynamic Balance of Total Farmland Area (DBTFA), was implemented with the aim of maintaining total area and quality of cultivated land and ensuring food security (Liu et al., 2017). However, after decades of large-scale reclamation, there are few remaining untouched farmland resources in China to potentially exploit (Jin et al., 2016). The newly reclaimed cultivated land is mostly located in ecological vulnerable areas, and it is of mostly lower quality than that of the lost cultivated land, which has been summarized as “bad land for good land” (Song and Liu, 2017; Song and Pijanowski, 2014; Wang et al., 2012). Therefore, it is difficult for the DBTFA policy to achieve its goal of “maintaining both land quality and land quantity.”
Rice is the staple food for more than 65% of China’s population. It is also the food crop with the highest planting area, total production and per unit area yield, and plays an important role in grain production and consumption. In 2016, rice sown area and production accounted for 27% and 34% of grain sown area and production in China, respectively (NBSC, 2017). Southern China is an important rice-producing region, and its rice sown area accounts for more than 60% of the total sown area in China. Due to good hydrothermal conditions, most double-cropping rice in China is concentrated in this region. As an intensive agricultural practice and effective way to increase land productivity and ensure food security, double-cropping yields nearly double that of single-cropping (Yang and Wang, 2013). However, due to rural labor shortages and increases in labor wages under the combined effects of urbanization and economic development, substantial croplands have been converted from double-cropping rice (DCR) to single-cropping rice (SCR) in Southern China in recent decades, a kind of seasonal land abandonment (Wang et al., 2018; Xin and Li, 2009). Previous studies, based on both statistical (Li et al., 2015; Xie and Liu, 2015) and remote sensing data (Li et al., 2012; Liu et al., 2014; Qiu et al., 2016), have indicated that the rice sown area and rice multiple cropping index are trending downward. Changes in rice multiple cropping have had an important impact on grain production in Southern China and its status as China’s main grain producing area is gradually declining. China’s grain transportation pattern has changed from south grain transported to north to north grain transported to south (Fan et al., 2018; Li et al., 2017; Wang and Xin, 2017). The decline in rice multiple cropping in Southern China indicates that existing high-quality cultivated land resources have not been fully utilized, and valuable high-quality cultivated land resources have been wasted to some extent.
In this context, large-scale reclamation of new cultivated land to ensure a dynamic balance of cultivated land area is undoubtedly a waste of financial resources and extremely disadvantageous for ecological construction. Increasing the multiple cropping index to increase the sown area, instead of massive reclamation of newly low-quality cultivated land, will effectively avoid wasting cultivated land and contribute to the environmental protection of ecologically fragile areas, which will achieve positive progress in food security and ecological security. Determining the impact of rice multiple cropping changes on grain production in Southern China and the equivalent new cultivated land that can be supplemented by increasing rice multiple cropping deserve comprehensive analyses.
Most previous studies on the impact of rice cropping index on grain production are based on statistical data (Jin et al., 2011; Xin and Li, 2009). However, statistical data only reflect the net change in the sown area of single- and double-cropping rice. It is not possible to describe the conversions between different land use types in a more detailed and in-depth manner, which cannot depict the spatial heterogeneity within administrative units (Liu et al., 2016; Yan et al., 2005). Remote sensing data are appropriate for space-time comparisons and can describe the process of land use change in detail, so as to better reflect and analyze the impact of rice multiple cropping index change on grain production (Liu et al., 2013; Yan et al., 2018). Due to the lack of detailed remote sensing maps of regional rice-cropping systems, few studies evaluated the effects of rice multiple cropping changes on grain production using higher resolution remote sensing data.
This study applied Landsat images obtained in 1990 and 2015to monitor and analyze spatiotemporal variations in rice-cropping systems in Southern China. The impacts on national grain production capacity were then evaluated and policy implications proposed.

2 Materials and methods

2.1 Study area

Southern China includes eight provinces: Zhejiang, Anhui, Hubei, Fujian, Jiangxi, Hunan, Guangdong, and Guangxi. It is located between 104°28′-122°57′E and 20°14′-34°40′N and covers an area of 134.37×10⁴ km2 (Figure 1). This region is primarily located in the subtropics with a long warm season and abundant precipitation, and its topography is complex and variable, including plains, hills, basins, and mountains. As one of the main rice production regions in China, the region is divided into two cropping system areas from north to south: (1) a double- and single-cropping rice mixed cropping production area in Anhui, Hubei, Hunan, Jiangxi, and Zhejiang) and (2) a double-cropping rice dominated cropping production area in Fujian, Guangdong, and Guangxi. SCR is generally sown in late May, transplanted in middle June and harvested in early October. DCR consists of early rice and late rice that are sequentially cultivated in the same paddy field. Early rice is generally sown in late March, transplanted from late April to early May, and harvested in middle and late July. Late rice is transplanted in late July and early August and harvested in middle and late October. DCR requires an extraordinary amount of work, especially during the harvesting of early rice and the transplanting of late rice. Due to insufficient heat resources, most of this work must be done within a short time window (usually in middle and late July), which is called “shuangqiang” or “rush-harvesting and rush-planting”, resulting in a high labor pressure. In recent years, due to the increase in the opportunity cost of farming and shortages of rural labor, the proportion of DCR cultivation in this region has trended downward. Planting SCR instead of DCR has become a common phenomenon in many provinces, a significant change from previous decades.
Figure 1 The study area in Southern China with the province names and boundaries indicated

2.2 Datasets

2.2.1 Remote sensing data
Landsat TM\ETM+\OLI images were downloaded from the U.S. Geological Survey Center for Earth Resources Observation and Science (USGS/EROS) (https://earthexplorer.usgs.gov/). Covering the study area requires 67 scene images. We selected a total of 244 images with little or low cloud cover (less than 10%) in specific phenology time windows around 1990 and 2015. After radiometric calibration, atmospheric correction, detection of clouds and cloud shadows, and ETM+ SLC-off pixels repair, these images were used to calculate the Normalized Difference Vegetation Index (NDVI) to extract the distributions of rice-cropping systems.
2.2.2 Non-remote sensing data
Non-remote sensing data applied in this study were mainly land use data, rice phenological data, rice-cropping system samples, and county level rice yield data. Land use data from 1990 and 2015 were applied to generate paddy field masks and avoid interference from other land cover types, which were obtained from the Institute of Remote Sensing and Digital Earth at a resolution of 30 m with an accuracy > 94%. Rice phenological data were obtained from household surveys and the provincial farming database created by the Ministry of Agriculture of China (http://www.zzys.moa.gov.cn/), which were then used to select the optimum time windows to discriminate between different rice-cropping systems. Rice-cropping system samples were collected through field surveys and visual interpretation of Landsat images associated with Google Earth images. A total of 1053 samples (692 DCR and 361 SCR) from 1990 and 1109 samples (470 DCR and 639 SCR) for 2015 were collected. These samples were randomly divided into two groups. One group was used as training samples to determine the monitoring rules for rice-cropping systems. The other group was utilized to assess accuracy. Rice yield data at the county level for 1990 was obtained from the Chinese Academy of Agricultural Sciences and used to calculate the effects of multiple cropping changes on rice production.

2.3 Methodology

2.3.1 Mapping the distribution of rice-cropping system in 1990 and 2015
To map rice-cropping systems at a large scale, this study developed an automatic rice-cropping system mapping procedure (ARCSM), based on the key time windows for rice growth. The ARCSM procedure included the following three modules: 1) Landsat image preprocessing; 2) pixel- and phenology-based paddy rice cropping system auto mapping; and 3) accuracy assessment and analysis of mapping results (Figure 2). The ARCSM procedure was executed using ENVI 5.3 and Interactive Data Language (IDL) 8.5 platform (www.exelisvis.com).
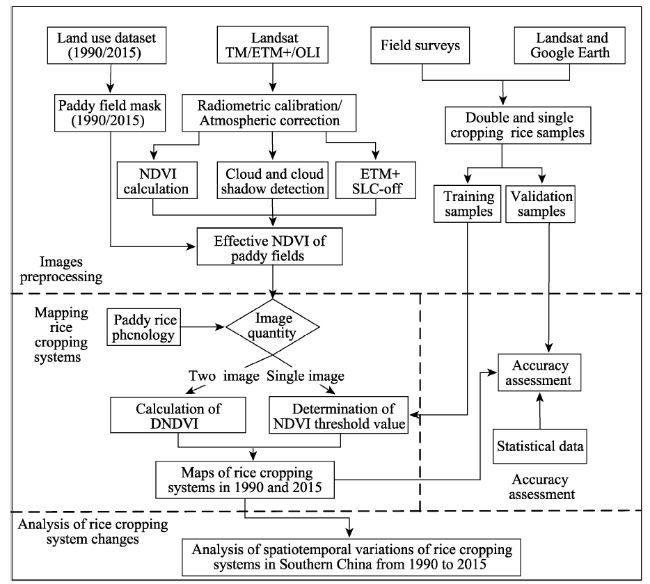
Figure 2 Overview of the mapping methodology for the rice-cropping systems
(1) Difference in NDVIs (DNDVI) approach
The land cover for rice paddies has three main stages: flooding and transplanting, growing rice plants, and exposed soil after harvest. The spectrum features in the three stages are significantly different. Specifically, the NDVI curve for a paddy rice field shows a low-high-low trend during the rice growth period. NDVI is low after transplantation; then, it increases rapidly in the reviving to tillering stage, and reaches its peak value during the panicle initiation and heading stage. When rice growth enters the filling and milky stage, NDVI begins to decrease and declines to a low value again after the harvest.
Due to differences in phenology, the NDVI curve for DCR has two peaks, while that for SCR has only one peak (Figure 3). From late May to early August, early rice is in the mature stage and its NDVI decreases, whereas SCR is in the growing stage and its NDVI increases. Sequentially, from late July to early October, the NDVI of late rice increases while the NDVI of SCR decreases. Therefore, the inverse changes in NDVIs during a given time window can be detected to calculate the DNDVI and discriminate between DCR and SCR quickly and efficiently. Based on the difference in NDVI changes, two given time windows were chosen: one from late May to late July, and the other from late July to early October.
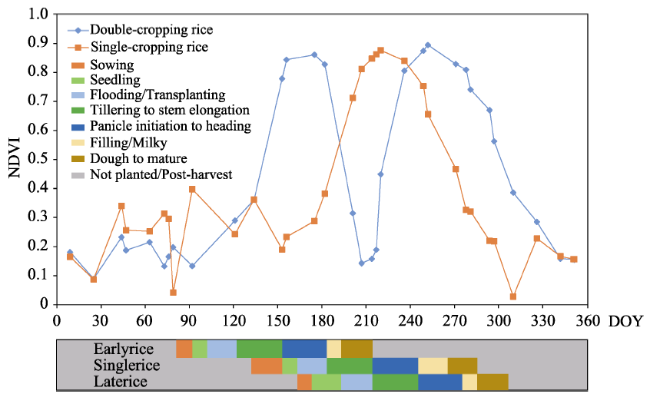
Figure 3 Temporal profiles of NDVI for different rice-cropping systems and rice calendar. For this example, double-cropping rice site is located at 28°52.39"N, 116°33.12'E and the single-cropping rice site is at 28°56.85'N, 116°4.97'E. Note: DOY = day of year
According to these described DCR and SCR characteristics, the DNDVI index was created to capture NDVI changes in single- or double-cropping rice. DNDVI was calculated using the following equation:
$DNDVI=NDV{{I}_{t1}}-NDV{{I}_{t2}}$
where t1 and t2 represent the acquisition time of each scene in which the NDVI values of SCR and DCR (i.e., early or late rice) show inverse changes, such as late May to Middle June (t1) and late July (t2), or late July to early August (t1) and late September to early October (t2).
DNDVI values range from ‒2.0 to 2.0. A negative DNDVI value indicates that the NDVIs of the candidate rice pixel increase from t1 to t2 and thus reflects a growing period, while a positive DNDVI value indicates a decreasing trend and thus reflects a mature period. DCR or SCR are distinguished based on the change in character in the time window from t1 to t2. For instance, if t1 and t2 are during late May to late July, a pixel with a positive DNDVI represents DCR (early rice), while a pixel with a negative DNDVI represents SCR.
(2) Single image threshold method based on rice phenology
The DNDVI approach highlights the difference in phenology between DCR and SCR and only requires two images in crucial time windows, which significantly reduces the demand for the number of Landsat images. However, our goal was to monitor paddy rice-cropping systems at a large scale in Southern China, which is located in the subtropics. Due to cloud and rain contamination, two images were not always available in crucial time windows in some regions, thus, the DNDVI approach was not always appropriate. To overcome this problem, we used the single image threshold method proposed by Li et al. (2012), as a substitute to map rice-cropping systems in these regions with insufficient images. This method is also a phenology-based algorithm. Based on the NDVI variations in different rice-cropping systems, several optimum time windows were selected. Then, the NDVI derived from a single Landsat-image within one of the optimum time windows was used to discriminate between different rice-cropping systems by setting a proper threshold. This method can effectively extract the distribution of paddy rice-cropping systems at a local scale. However, because thresholds vary regionally, it is not easy to apply this method at a large scale. Figure 4 shows the distributions of scenes to which the threshold method or DNDVI approach was applied.
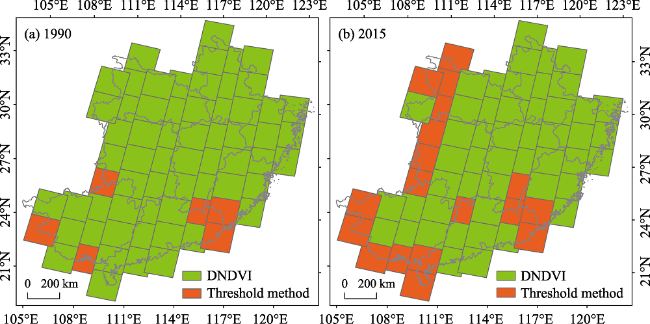
Figure 4 The distribution of scenes to which the single image threshold method or DNDVI approach was applied (DNDVI = difference in NDVIs method)
(3) Accuracy assessment
Using the validation sites collected via field surveys and the visual interpretation of Landsat images and Google Earth images, a confusion matrix was created to calculate conventional classification accuracy statistics (i.e., overall accuracy and Kappa index). In addition, we compared the Landsat-derived cropping system areas with statistical data and calculated the coefficient of determination (R2) to assess the mapping results.
2.3.2 Estimating the effect of rice multiple cropping changes on rice production
Because the goal of this research is to analyze the impact of rice multiple cropping changes on rice production, it was necessary to eliminate rice production changes caused by other reasons, e.g., fertilizer usage, seed improvement, agricultural machinery, and climate changes. To control the variables, similar to the approach of Li et al. (2018), we assumed that the rice yield per unit area was constant in the period, i.e., equal to the yield from 1990.The formula for calculating the effect of rice multiple cropping index on rice yield is as follows:
$NP=\Delta {{P}_{SD}}+\Delta {{P}_{DS}}$
$\Delta {{P}_{SD}}=({{Y}_{E}}+{{Y}_{L}}-{{Y}_{S}})\times {{S}_{SD}}$
$\Delta {{P}_{DS}}=({{Y}_{E}}+{{Y}_{L}}-{{Y}_{S}})\times {{S}_{DS}}$
where NP is the net change in rice production caused by rice multiple cropping index changes; ΔPSD is the change in rice production caused by the conversion from SCR to DCR; ΔPDS is the change in rice production caused by the conversion from DCR to SCR; SSD is rice field area of SCR converted to DCR; SDS is the rice field area of DCR converted to SCR; YE, YL, and YS refer to the rice yield of early, late, and single-cropping rice, respectively.

3 Results and analysis

3.1 Accuracy of maps of rice-cropping systems in Southern China

The accuracy of the resulting rice-cropping system maps for 1990 and 2015 were evaluated using the validation samples and confusion matrix. As shown in Table 1, the generated rice-cropping system maps had high accuracies; the overall accuracies were 88.83% and 86.55% in 1990 and 2015, respectively, and the Kappa coefficients were 0.75 and 0.72, respectively. The user accuracies and producer accuracies were all greater than 80%. The overall accuracy in 1990 was higher than that in 2015 because of the relatively better quality of Landsat images in 1990, which is consistent with previous research in Northern China (Dong et al., 2015).
Table 1 Classification accuracy for the rice-cropping systems distribution maps in 1990 and 2015
Year Classified results Overall accuracy Kappa coefficient
Single rice Double rice Producer accuracy
1990 Validation
samples
Single rice 207 46 81.82% 88.83% 0.75
Double rice 35 437 92.58%
User accuracy 85.54% 90.48%
2015 Validation
samples
Single rice 394 48 89.14% 86.55% 0.72
Double rice 53 256 82.85%
User accuracy 88.14% 84.21%
To further assess the accuracy of the generated rice-cropping system maps, the Landsat-derived double and single rice areas and proportions of DCR areas were compared to the statistical data at the provincial level. Because the study area includes eight provinces and the sample size is relatively small, we aggregated the 1990 and 2015 provincial data for verification to enhance the sample size and improve the reliability of the verification results. The Landsat-derived double and SCR areas and proportion of DCR areas correlated well with statistical data at the provincial scale, yielding R2 values of 0.52 and 0.83, respectively, which indicated that the Landsat-derived cropping system maps adequately described the rice-cropping system patterns in Southern China.These validation calculations show that the distribution maps of rice-cropping systems derived from Landsat are reliable.

3.2 Spatiotemporal changes in rice-cropping systems in Southern China for 1990- 2015

In general, from 1990 to 2015, rice sown area in Southern China decreased from 2183.87×104 ha to 1778.27×104 ha, and the rice multiple cropping index decreased from 149.3% to 129.7% (Table 2). Specifically, the SCR sown area increased by 201.4×10⁴ ha, while the DCR sown area decreased by 607×104 ha.
Table 2 Provincial area and production of single and double-cropping rice in 1990 and 2015 (×104 ha, ×104 t)
Province 1990 2015
Single-cropping rice Double-cropping rice Single-cropping rice Double-cropping rice
Sown area Production Sown area Production Sown area Production Sown area Production
Zhejiang 43.34 225.07 131.48 735.08 63.83 339.09 33.72 191.63
Anhui 300.05 2173.65 164.34 810.68 341.65 2409.03 74.69 360.44
Fujian 19.26 100.42 54.25 271.3 18.13 94.12 31.69 154.97
Jiangxi 39.49 188.89 283.99 1395.48 112.17 541.21 149.15 719.01
Hubei 192.32 1752.05 110.51 618.32 224.08 2032.08 34.78 189.4
Hunan 80.58 495.45 285.45 1605.43 130.34 833.26 142.11 786.76
Guangdong 26.61 136.81 247.97 1318.71 39.81 198.15 176.83 923.6
Guangxi 59.79 222.16 144.45 714.63 32.83 122.19 172.45 839.18
Total 761.44 5294.49 1422.43 7469.62 962.84 6569.12 815.43 4164.98
The change in rice sown area was mainly driven by changes in rice-cropping system (transformation between DCR and SCR) and changes in planting area (transformation between rice and non-rice). Of the two, the rice multiple cropping conversion was dominant. From the perspective of change in rice-cropping systems (Figure 5), the field area of DCR converted to SCR was 253.16×10⁴ ha, while the field area of SCR converted to DCR was only 74.62×10⁴ ha, less than one third the DCR converted to SCR. The rice-cropping system distribution in Southern China showed shrinkage of double rice and expansion of single rice from north to south. The most dramatic changes occurred in the Middle-Lower Yangtze Plain, including the Hubei-Hunan Plain, Poyang Lake Plain, Yangtze River coast in southern Anhui, and Zhejiang, where traditional DCR and SCR mixed cropping areas were located. Rice-cropping system patterns in these regions had shifted from DCR-dominated cropping system patterns in 1990 to SCR-dominated cropping system patterns in 2015.
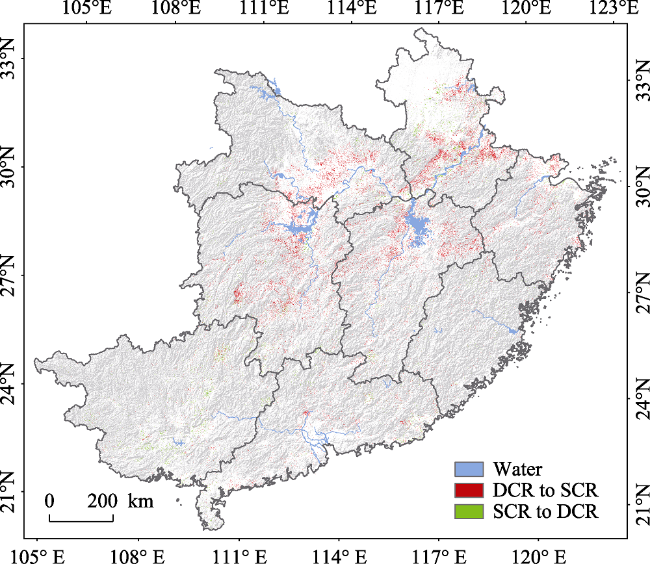
Figure 5 Changes in rice-cropping systems from 1990 to 2015 (DCR = double-cropping rice, SCR = single-cropping rice)

3.3 The impact of rice multiple cropping change on rice production

Calculated based on the rice yield in 1990, the reduction in rice production due to changes in rice sown area from 1990 to 2015 was 2030×104 t, accounting for 16% of the rice production in 1990. Specifically, DCR production decreased by 3304.6×104 t, while SCR production increased by 1274.6×104 t. At the provincial scale, the changes in rice production were generally consistent with changes in rice sown area. The largest losses were in Hunan and Jiangxi Provinces, which are major rice production areas, and Zhejiang and Guangdong provinces, which have more robust economic development. The net loss in each province was greater than 320×104 t.
From the perspective of change in rice-cropping systems, the net losses of rice production due to decreases in the rice multiple cropping index were 811.78×10⁴ t, accounting for 40% of the entire reduction. The reduction in rice production due to the “double to single” conversion was 1164.22×104 t, accounting for 6.1% of national rice production in 1990 and 2.6% of national grain production in 1990. Figure 6 shows that Hunan and Jiangxi provinces, the major rice producing areas, had a more than 250 ×104 t reduction in rice production due to “double to single” conversion, accounting for more than 15% of rice production in each province. In addition, the rice production in Zhejiang and Guangdong, where economic development is rapid, decreased by more than 13% due to the “double to single” conversion. Therefore, there is great potential to increase the planting area by increasing multiple cropping, especially in Hunan, Jiangxi, and Zhejiang provinces, where there has been a large reduction in rice production due to “double to single” conversion.
Figure 6 Provincial losses in rice production caused due to “double to single” conversion from 1990-2015 and their proportional contribution to rice production in 1990
From the county level (Figure 7), nearly 70% of the counties (cities) in the study area had lost rice production due to a decline in rice multi-cropping. More than 20% of the counties and cities lost more than 20,000 tons, mainly distributed in the middle and lower reaches of the Yangtze River. The counties that increased production due to increases in the rice multiple cropping index were mainly distributed in Guangxi and the western regions of Hunan and Hubei provinces, of which 97% of the counties (cities) increased rice production by less than 20,000 tons.
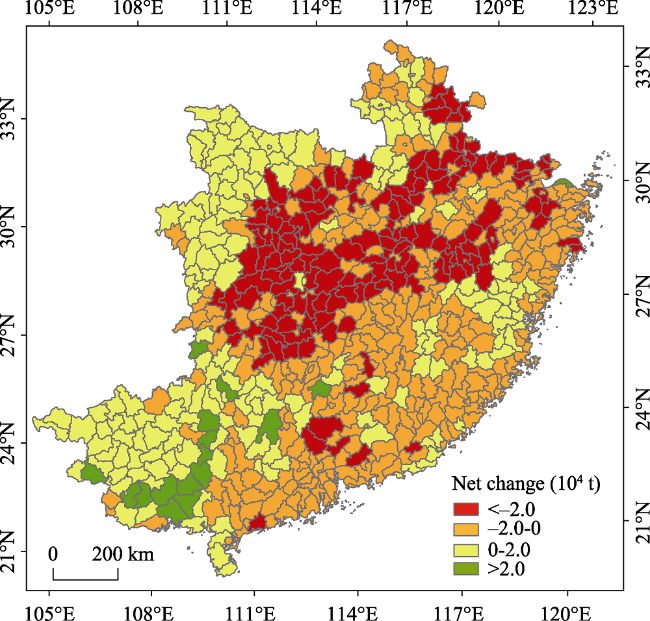
Figure 7 Net changes in rice production due to rice multiple cropping changes at the county level

4 Discussion

With urbanization, rapid urban expansion has led to the conversion of large amounts of cultivated land to construction land, and the issue of cultivated land loss has become serious. To cope with the loss of cultivated land and ensure food security, the well-known farmland protection policy called DBTFA was implemented in 1998 (Du et al., 2018). Land reclamation is regarded as the most effective approach to achieve a dynamic balance of total farmland. After 2009, the “first-supplement and post-occupation” policy was fully implemented for cultivated land occupied by non-agricultural construction, and most newly reclaimed cultivated land can be used as a quota traded in the land market, further promoting and strengthening land reclamation. According to China Land and Resources Statistical Yearbook from 2002 to 2016, the amount of newly reclaimed land reached 4.14 million ha via land reclamation, with an annual average of 0.22 million ha. According to the Land Consolidation Plan 2016-2020, which was approved in 2017, the supplemental goal for new farmland is 1.33 million ha from 2016 to 2020.
However, China has encouraged the exploitation of wasteland over the years, resulting in the remaining untouched farmland resources being exhausted. Newly reclaimed land is mostly from wetlands, tidal flats, meadows, and sloping lands, which are highly vulnerable to soil erosion, landscape fragmentation, and land degradation (Kong, 2014). A number of studies have shown that lost cultivated land is mostly located in the southern part of the region with better hydrothermal conditions, while the supplementary cultivated land is located in the northwest and northeast regions, where natural conditions are relatively poor (Lichtenberg and Ding, 2008; Song and Liu, 2017; Song and Pijanowski, 2014). Li suggested that the land quality of cultivated land converted to built-up areas in Southern China was 1.54 times the quality of newly cultivated land in Xinjiang, 2 times that of the Northeast China Plain and 3.54 times that of eastern Inner Mongolia (Li et al., 2018). Field surveys have also shown that newly reclaimed cultivated lands are mostly located on sloping fields or floodplains in remote mountain areas, with high land reclamation costs and poor grain yield. In addition, some newly reclaimed cultivated lands are located in the mountains and arid regions where land abandonment has been common, usually of poor quality, and located far from other rural residents. In these regions, newly reclaimed lands adjoin abandoned lands. Some land is even abandoned immediately after reclamation (Xin and Li, 2018). The quality of newly reclaimed cultivated land is generally lower than that of lost cultivated land. Thus, the cultivated land protection policy can only maintain the quantity of cultivated land but cannot maintain the quality of cultivated land.
Concurrently, due to rural labor shortages and increases in labor wages from the combined effects of urbanization and economic development, conversion from DCR to SCR in recent decades has become prevalent in Southern China (Wang et al., 2018; Xin and Li, 2009). Rice paddy fields in Southern China have better hydrothermal conditions and higher yields, which are valuable high-quality cultivated land. The “double to single” conversion phenomenon indicates that high-quality cultivated land has not been utilized effectively. According to our results, rice sown area in Southern China decreased by 253.16 ×10⁴ ha due to “double to single” conversion from 1990 to 2015, resulting in a reduction of 1164.2 ×104 t in rice production, accounting for 2.6% of grain production in 1990. The average grain yield from cultivated land in 1990 (6153 kg/ha) is equivalent to a 189.2×10⁴ ha loss of cultivated land. Song argued that the national average quality of cultivated land lost by construction occupation was 1.8 times that of newly reclaimed cultivated land (Song and Pijanowski, 2014). Therefore, the reduction in rice production capacity due to “double to single” conversion is equivalent to 223.3×10⁴ ha of newly reclaimed cultivated land. Therefore, making full use of the grain production capacity of “double to single” paddy fields is equivalent to an increase of 223.3 × 10⁴ ha of newly reclaimed cultivated land, which is 54% of the total newly reclaimed cultivated land through the land consolidation project for 2001-2015 and 1.7 times the newly cultivated land target in the national land consolidation plan (2016-2020). Currently, the construction cost of land reclamation ranges from 45,000 to 90,000 Chinese yuan per ha. If the management cost is also considered, the lowest cost for land reclamation reaches 75,000 Chinese yuan per ha (Xin and Li, 2018). Calculated by the lowest cost, fully using “double to single” rice fields instead of supplementing cultivated land through land reclamation will save about 167.44 billion yuan in newly cultivated land reclamation costs.
Continuing to reclaim new farmland to pursue a balance in total area of cultivated land and neglect the location and quality of newly reclaimed farmland will inevitably exacerbate the destruction of the ecological environment; balancing the quantity and quality of cultivated land will also be hard to achieve. If DCR fields converted to SCR are fully used, high-quality cultivated land can be used effectively to ensure food security while avoiding the ecological environment damage caused by newly reclaimed rice fields and wasted financial resources. Instead of pursuing low-quality new arable land, it is better to fully use of existing high-quality arable land to achieve a better food and ecological security status.

5 Conclusions and policy implications

5.1 Conclusions

This study used 244 Landsat images in specific time windows, selected based on rice phenological features, to monitor the distribution of rice-cropping systems in Southern China in 1990 and 2015. Changes in the rice multiple cropping index and its impact on grain production were analyzed and estimated. Three key conclusions were reached in this study.
(1) From 1990 to 2015, SCR sown area increased by 201.4×10⁴ ha, while DCR sown area decreased by 607×104 ha. The multiple cropping index for rice decreased from 148.3% to 129.3%, the loss in area due to “double to single” conversion was 253.16×10⁴ ha, and the most dramatic changes occurred in the Middle-Lower Yangtze Plain. The rice-cropping systems in Southern China showed a pattern of double-cropping rice shrinking and single-cropping rice expanding from north to south.
(2) From 1990 to 2015, “double to single” conversion led to an 1164.22×104 t reduction in rice production, accounting for 6.1% and 2.6% of rice and grain production in China in 1990, respectively. Hunan Province and Jiangxi Province, the major rice producing areas, and Zhejiang Province, with a rapidly developing economy, had a relatively large reduction in rice production due to “double to single” conversion, all exceeding 13%.
(3) Converted according to grain yield, fully using the grain production capacity of “double to single” paddy fields is equivalent to 223.3 × 10⁴ ha of newly reclaimed cultivated land, which was 54% of the total newly reclaimed cultivated land through the land consolidation project for 2001-2015, 1.7 times the newly cultivated land goal in the national land consolidation plan (2016-2020), which could save approximately 167.44 billion yuan in newly reclaimed cultivated land costs. Instead of pursuing low-quality new arable land, it is better to fully use existing high-quality arable land.

5.2 Policy implications

(1) The “double to single” conversion in Southern China has resulted in 2.6% of the national grain production capacity not being fully utilized in current land policies and market conditions. However, for food shortages, they can quickly be restored to ensure food security, and can be included in the “storing food in land” program. The results of this study can quantitatively enhance the understanding of China’s “storing food in land” plan and provide data support for decision-making.
(2) Pursuing low-quality new arable land is likely to lead to ecological problems, whereas making full use of the existing high-quality arable land can effectively utilize high-quality arable land while also saving significant reclamation costs. Therefore, in the current context of the “double to single” conversion, the Chinese government should change the assessment method, balancing cultivated land occupation and compensation. The sown area increased by the multiple cropping index should be used as the cultivated land compensation indicator to deduct the cultivated land area occupied by construction. Furthermore, to realize a sustainable and healthy balance of cultivated land occupation and compensation, newly reclaimed cultivated land should not be used as the only means of supplementing cultivated land area.
[1]
Dong J, Xiao X, Kou W et al., 2015. Tracking the dynamics of paddy rice planting area in 1986-2010 through time series Landsat images and phenology-based algorithms. Remote Sensing of Environment, 160:99-113.

[2]
Du X, Zhang X, Jin X , 2018. Assessing the effectiveness of land consolidation for improving agricultural productivity in China. Land Use Policy, 70:360-367.

[3]
Fan L, Liang S, Chen H et al., 2018. Spatio-temporal analysis of the geographical centroids for three major crops in China from 1949 to 2014. Journal of Geographical Sciences, 28(11):1672-1684.

[4]
Fu Z, Cai Y, Yang Y et al., 2001. Research on the relationship of cultivated land change and food security in China. Journal of Natural Resources, 16(4):313-319. (in Chinese)

[5]
Huang J, Yang G , 2017. Understanding recent challenges and new food policy in China. Global Food Security, 12:119-126.

[6]
Jin S, Hou L, Xu L , 2011. The relationship of multiple cropping index of arable land change and national food security in the middle and lower reaches of Yangtze River. Chinese Agricultural Science Bulletin, 27(17):208-212. (in Chinese)

[7]
Jin X, Zhang Z, Wu X et al., 2016. Co-ordination of land exploitation, exploitable farmland reserves and national planning in China. Land Use Policy, 57:682-693.

[8]
Ju H, Zhang Z, Zhao X et al., 2018. The changing patterns of cropland conversion to built-up land in China from 1987 to 2010. Journal of Geographical Sciences, 28(11):1595-1610.

[9]
Kong X , 2014. China must protect high-quality arable land. Nature, 506(7486):7.

[10]
Li P, Feng Z, Jiang L et al., 2012. Changes in rice cropping systems in the Poyang Lake Region, China during 2004-2010. Journal of Geographical Sciences, 22(4):653-668.

[11]
Li T, Long H, Zhang Y et al., 2017. Analysis of the spatial mismatch of grain production and farmland resources in China based on the potential crop rotation system. Land Use Policy, 60:26-36.

[12]
Li Y, Li X, Tan M et al., 2018. The impact of cultivated land spatial shift on food crop production in China, 1990-2010. Land Degradation & Development, 29(6):1652-1659.

[13]
Li Z, Liu Z, Anderson W et al., 2015. Chinese rice production area adaptations to climate changes, 1949-2010. Environmental Science & Technology, 49(4):2032-2037.

[14]
Lichtenberg E, Ding C , 2008. Assessing farmland protection policy in China. Land Use Policy, 25(1):59-68.

[15]
Liu J, Kuang W, Zhang Z et al., 2014. Spatiotemporal characteristics, patterns, and causes of land-use changes in China since the late 1980s. Journal of Geographical Sciences, 24(2):195-210.

[16]
Liu X, Zhao C, Song W , 2017. Review of the evolution of cultivated land protection policies in the period following China’s reform and liberalization. Land Use Policy, 67:660-669.

[17]
Liu Y, Song W, Deng X , 2016. Changes in crop type distribution in Zhangye City of the Heihe River Basin, China. Applied Geography, 76:22-36.

[18]
Liu Z, Li Z, Tang P et al., 2013. Change analysis of rice area and production in China during the past three decades. Journal of Geographical Sciences, 23(6):1005-1018.

[19]
National Bureau of Statistics of China(NBSA), 2017. China Statistical Yearbook. Beijing: China Statistics Press. (in Chinese)

[20]
Qiu B, Qi W, Tang Z et al., 2016. Rice cropping density and intensity lessened in southeast China during the twenty-first century. Environmental Monitoring & Assessment, 188(1):5.

[21]
Schmidhuber J, Tubiello F N , 2007. Global food security under climate change. Proceedings of the National Academy of Sciences of the United States of America, 104(50):19703-19708.

[22]
Song W, Liu M , 2017. Farmland conversion decreases regional and national land quality in China. Land Degradation & Development, 28(2):459-471.

[23]
Song W, Pijanowski B C , 2014. The effects of China's cultivated land balance program on potential land productivity at a national scale. Applied Geography, 46:158-170.

[24]
Wang J, Chen Y, Shao X et al., 2012. Land-use changes and policy dimension driving forces in China: Present, trend and future. Land Use Policy, 29:737-749.

[25]
Wang J, Xin L , 2017. Spatial-temporal variations of cultivated land and grain production in China based on GlobeLand30. Transactions of the Chinese Society of Agricultural Engineering (Transactions of the CSAE), 33(22):1-8. (in Chinese)

[26]
Wang R, Li X, Tan M et al., 2018. Inter-provincial differences in rice multi-cropping changes in main double-cropping rice area in China: Evidence from provinces and households. Chinese Geographical Science.

[27]
Xie H, Liu G , 2015. Spatiotemporal differences and influencing factors of multiple cropping index in China during 1998-2012. Journal of Geographical Sciences, 25(11):1283-1297.

[28]
Xin L, Li X , 2009. Changes of multiple cropping in double cropping rice area of southern China and its policy implications. Journal of Natural Resources, 24(1):58-65. (in Chinese)

[29]
Xin L, Li X , 2018. China should not massively reclaim new farmland. Land Use Policy, 72:12-15.

[30]
Yan H, Liu F, Niu Z et al., 2018. Changes of multiple cropping in Huang-Huai-Hai agricultural region, China. Journal of Geographical Sciences, 28(11):1685-1699.

[31]
Yan H, Liu J, Cao M , 2005. Remotely sensed multiple cropping index variations in China during 1981-2000. Acta Geographica Sinica, 60(4):559-566. (in Chinese)

[32]
Yang W, Wang Y , 2013. Analysis on cropping changes and contributing factors of double cropping: Empirical study based on 10 major rice producing provinces. Rural Economy, (11):24-28. (in Chinese)

[33]
Zhang K, Yu Z, Li X et al., 2007. Land use change and land degradation in China from 1991 to 2001. Land Degradation & Development, 18(2):209-219.

Outlines

/