
Journal of Geographical Sciences >
Glacier changes from 1975 to 2016 in the Aksu River Basin, Central Tianshan Mountains
Author: Zhang Qifei, PhD, specialized in glacier change and water resources. E-mail: zhangqifei15@mails.ucas.ac.cn
Received date: 2018-03-22
Accepted date: 2018-09-29
Online published: 2019-06-25
Supported by
National Natural Science Foundation of China, No.41630859, No.41471030
Copyright
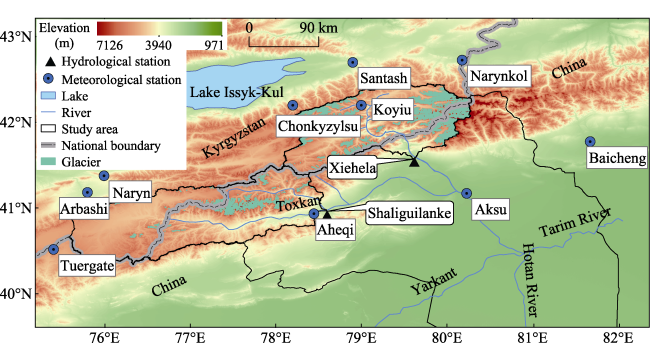
In this study, we analyzed glacier changes in the Aksu River Basin during the period 1975-2016, based on Landsat MSS/TM/ETM+/OLI imagery analysis and the Chinese Glacier Inventory (CGI). The results showed that the total number, area, and volume of the studied glaciers in the Aksu River Basin decreased by 202 (7.65%), 965.7 km2 (25.88%), and 74.85-78.52 km3 (23.72%-24.3%), respectively. The rate of glacier retreat in the basin was slower in the north, northwest and west, but reached the highest in the east (measuring 0.86% yr-1). Furthermore, there were significant regional differences in the distribution and change of glaciers, the Kumalak River Basin had the largest glacier number and area, about 63.15% and 76.47% of the studied basin, and the rate of glacier retreat in the Kumalak River Basin was 0.65% yr-1, it was higher than the Toxkan River Basin which reached 0.57% yr-1. We found the shrinkage rate of glacier for different periods in the past 41 years, during 1975-1990 the glaciers showed the greatest retreat, while the rate of glacier area retreat slowed down significantly from 1990 to 2000. In recent 16 years since 2000, the rate of glacier retreat in the Toxkan River Basin was higher compared with 1990-2000. The RGI50-13.04920 glacier of Kumalak River Basin had been in a state of retreat since 1990. Over the past 41 years, the temperature and precipitation in the Aksu River Basin increased obviously, and the warming temperatures were clearly the main reason for glacier retreat in the region, while the increased precipitation in the mountain area may have a direct relation with the retreating rate of glaciers.
Key words: glacier change; glacier retreat; remote sensing; Aksu River Basin
ZHANG Qifei , CHEN Yaning , LI Zhi , LI Yupeng , XIANG Yanyun , BIAN Wei . Glacier changes from 1975 to 2016 in the Aksu River Basin, Central Tianshan Mountains[J]. Journal of Geographical Sciences, 2019 , 29(6) : 984 -1000 . DOI: 10.1007/s11442-019-1640-z
Figure 1 Location of the Aksu River Basin |
Table 1 Remote sensing image data of Landsat images |
| Period | Data | Path/Row | Satellite sensor | Spatial resolution |
|---|---|---|---|---|
| 1975 | 1977-08-18 | 158/31 | Landsat MSS | 80 m (Channels 4-6, 7) |
| 1975-08-12 | 159/31 | Landsat MSS | ||
| 1975-08-13 | 160/31 | Landsat MSS | ||
| 1975-08-13 | 160/32 | Landsat MSS | ||
| 1990 | 1990-08-02 | 146/31 | Landsat TM | 30 m (Channels 3-5, 7) |
| 1989-08-22 | 147/31 | Landsat TM | ||
| 1991-08-19 | 148/31 | Landsat TM | ||
| 1991-08-19 | 148/32 | Landsat TM | ||
| 1990-08-07 | 149/31 | Landsat TM | ||
| 1990-08-07 | 149/32 | Landsat TM | ||
| 2000 | 2003-07-29 | 146/31 | Landsat ETM+ | 15/30 m (Channels 3-5, 7) |
| 1999-08-26 | 147/31 | Landsat ETM+ | ||
| 1999-09-18 | 148/31 | Landsat ETM+ | ||
| 1999-09-18 | 148/32 | Landsat ETM+ | ||
| 1999-08-16 | 149/32 | Landsat ETM+ | ||
| 2016 | 2016-08-09 | 146/31 | Landsat OLI | 15/30 m (Channels 4-6, 7) |
| 2016-09-01 | 147/31 | Landsat OLI | ||
| 2015-08-21 | 148/31 | Landsat OLI | ||
| 2016-09-08 | 148/32 | Landsat OLI | ||
| 2015-08-12 | 149/31 | Landsat OLI | ||
| 2015-08-12 | 149/32 | Landsat OLI |
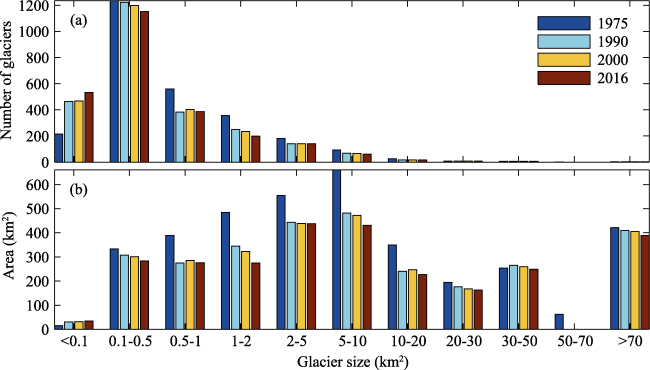
Figure 2 Changes in glacier number and area in the Aksu River Basin from 1975 to 2016 |
Table 2 Changes in glacier area according to various glacier sizes of the Aksu River Basin from 1975 to 2016 |
| Interval area (km²) | 0.01-0.1 | 0.1-0.5 | 0.5-1 | 1-2 | 2-5 | 5-10 | 10-20 | 20-30 | 30-50 | 50-70 | >70 |
|---|---|---|---|---|---|---|---|---|---|---|---|
| Number change | 317 | -84 | -173 | -156 | -41 | -31 | -10 | -1 | 0 | -1 | 0 |
| Number change (%) | 147.44 | -6.80 | -30.89 | -43.94 | -22.53 | -33.70 | -38.46 | -12.50 | 0 | -100 | 0 |
| Area change (%) | 131.58 | -14.72 | -29.20 | -43.20 | -21.06 | -34.76 | -35.25 | -16.17 | -1.71 | -100 | -7.63 |
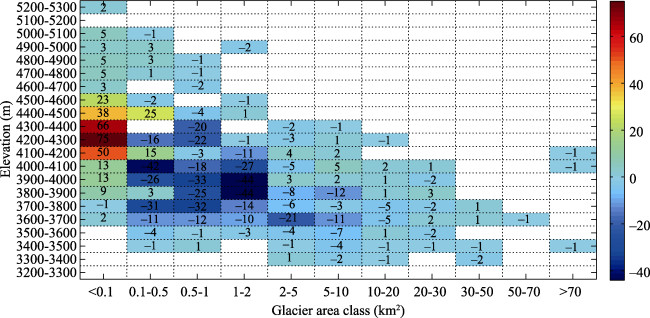
Figure 3 Changes in glacier number by glacier class and elevation during 1975-2016. The color bar shows the number change of glaciers, the blue color shows the decrease number and the red color shows the increase number. |
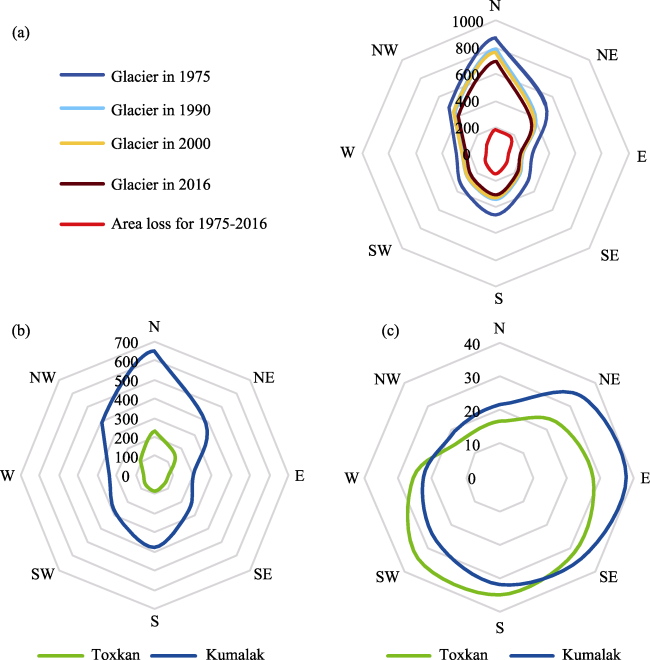
Figure 4 Distribution of glacier areas and their changes according to aspect in the Aksu River Basin and sub-basins during 1975-2016 (a. Glacier area changes in the Aksu Basin; b. Distribution of glacier areas in different Aksu sub-basins in 1975; c. Relative changes in glacier areas in different Aksu sub-basins) |
Table 3 Glacier changes in the Aksu River Basin in different periods from 1975 to 2016 |
| Sub-basin | Glacier number | Glacier area proportion (%) | ||||||
|---|---|---|---|---|---|---|---|---|
| 1975 | 1990 | 2000 | 2016 | 1975 | 1990 | 2000 | 2016 | |
| Toxkan | 998 | 968 | 971 | 970 | 4.77 | 3.90 | 3.87 | 3.66 |
| Kumalak | 1710 | 1597 | 1572 | 1536 | 22.30 | 17.62 | 17.32 | 16.34 |
| Total | 2708 | 2565 | 2543 | 2506 | 12.04 | 9.59 | 9.45 | 8.92 |
Figure 5 Terminus retreat of the typical glaciers in the Aksu River Basin since 1975 |
Table 4 Terminus retreat of the typical glaciers in the Aksu River Basin |
| Glacier ID | Sub-basin | Length change | Area change | Terminus change | ||||||
|---|---|---|---|---|---|---|---|---|---|---|
| m | (%) | m yr-1 | km2 | (%) | km2 yr-1 | m | (%) | m yr-1 | ||
| RGI50-13.09540 | Toxkan | 1530.1 | 1.54 | 37.32 | 5.43 | 26.26 | 0.13 | 47 | 1.21 | 1.15 |
| RGI50-13.04920 | Kumalak | 660.22 | 12.87 | 16.1 | 1.9 | 19.62 | 0.05 | 77 | 2.18 | 1.88 |
Table 5 Glaciers retreat in the Aksu River Basin in different periods from 1975 to 2016 |
| Glacier ID | Sub-basin | Length change (m yr-1) | Area change (% yr-1) | ||||
|---|---|---|---|---|---|---|---|
| 1975-1990 | 1990-2000 | 2000-2016 | 1975-1990 | 1990-2000 | 2000-2016 | ||
| RGI50-13.09540 | Toxkan | 44.36 | 35.69 | 31.74 | 1.42 | 0.2 | 0.27 |
| RGI50-13.04920 | Kumalak | 10.79 | 13.95 | 22.43 | 1.02 | 0.27 | 0.15 |
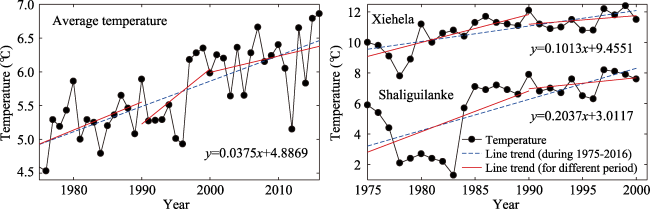
Figure 6 Variations in annual average temperature in the Aksu River Basin during 1975-2016 |
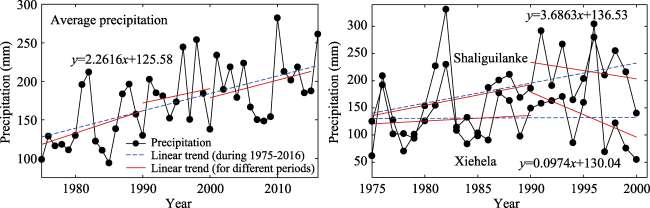
Figure 7 Variations in annual average precipitation in the Aksu River Basin during 1975-2016 |
Table 6 The increasing rate of temperature in different regions |
| Region | Global | Central Asia | China | Northwest China | Xinjiang |
|---|---|---|---|---|---|
| Increasing temperature | 0.12 | 0.15-0.31 | 0.22 | 0.34 | 0.33 |
| (°C 10yr-1) | IPCC, 2013 | Deng et al., 2017 | Ding et al., 2007 | Chen et al., 2014 | Li et al., 2012 |
The authors have declared that no competing interests exist.
| [1] |
|
| [2] |
|
| [3] |
|
| [4] |
|
| [5] |
|
| [6] |
|
| [7] |
|
| [8] |
|
| [9] |
|
| [10] |
|
| [11] |
|
| [12] |
|
| [13] |
|
| [14] |
|
| [15] |
|
| [16] |
|
| [17] |
|
| [18] |
|
| [19] |
|
| [20] |
|
| [21] |
IPCC, 2013. Climate Change 2013: The Physical Science Basis. Cambridge: Cambridge University Press, 1308.
|
| [22] |
|
| [23] |
|
| [24] |
|
| [25] |
|
| [26] |
|
| [27] |
|
| [28] |
|
| [29] |
|
| [30] |
|
| [31] |
|
| [32] |
|
| [33] |
|
| [34] |
|
| [35] |
|
| [36] |
|
| [37] |
|
| [38] |
|
| [39] |
|
| [40] |
|
| [41] |
|
| [42] |
|
| [43] |
|
| [44] |
|
| [45] |
|
| [46] |
|
| [47] |
|
| [48] |
|
| [49] |
|
| [50] |
|
| [51] |
|
| [52] |
|
| [53] |
|
/
| 〈 |
|
〉 |
