
Journal of Geographical Sciences >
Spatial-temporal variations in cold surge events in northern China during the period 1960-2016
Author: Gao Wenlan (1985-), PhD, specialized in global change and extreme climatic events. E-mail: gaowenlan1@126.com
Received date: 2018-05-29
Accepted date: 2018-12-22
Online published: 2019-06-25
Supported by
National Natural Science Foundation of China, No.41571062, No.41701592
Copyright
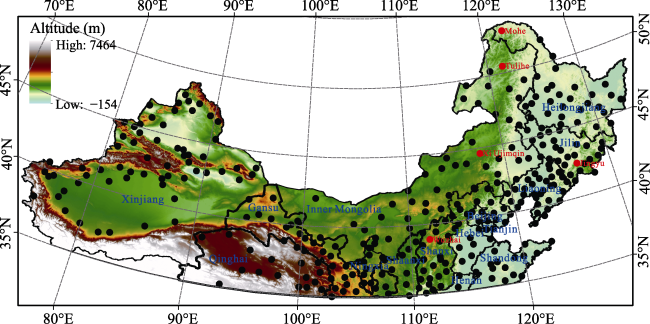
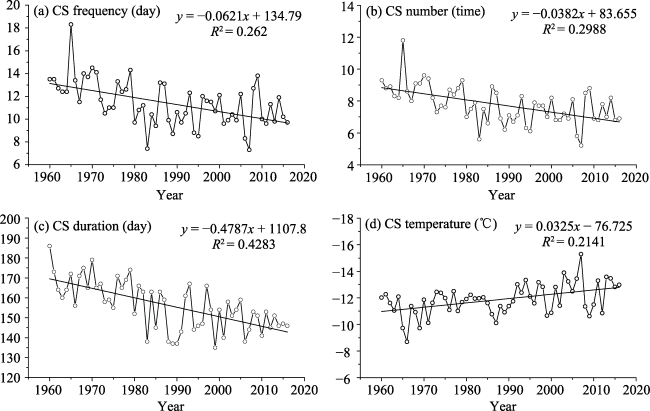
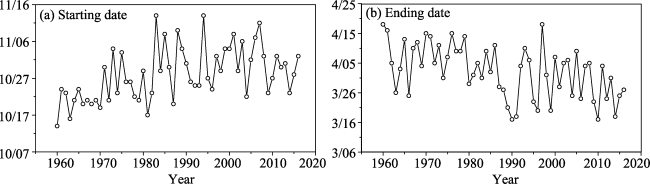
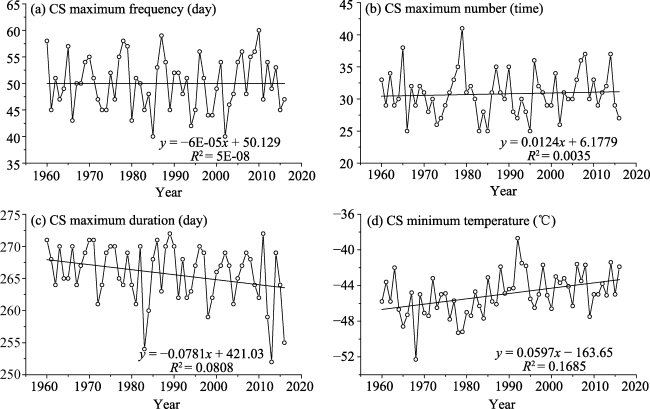
Among the most devastating extreme weather events, cold surge (CS) events frequently impact northern China. It has been reported that extreme weather events will increase in the global warming context. However, the direct evidence of this hypothesis is limited. Here, we investigated the changes in frequency, number, duration, and temperature of CS events in northern China using the daily minimum temperature dataset of 331 stations from 1960 to 2016. The results indicate that the annual CS events in terms of frequency and number decreased, and the duration shortened as the starting date was later and the ending date earlier. Meanwhile, the annual CS temperature increased. In addition, spatial trends in the CS events in terms of frequency, number, and duration decreased while the CS temperature increased in most regions of northern China. We interpreted these variations as a response to global warming. However, the extreme CS events in terms of frequency, number and the earliest starting date and the latest ending date showed little change though the extreme CS temperature increased, implying climate warming had not limited extreme CS events. The adverse effect of CS events on agriculture and human health remain concerning.
Key words: cold surge; frequency; number; duration; temperature; northern China
GAO Wenlan , DUAN Keqin , LI Shuangshuang . Spatial-temporal variations in cold surge events in northern China during the period 1960-2016[J]. Journal of Geographical Sciences, 2019 , 29(6) : 971 -983 . DOI: 10.1007/s11442-019-1668-0
Figure 1 Distribution of meteorological stations in northern China. The black circles and red circles represent meteorological stations. The blue text represent provinces and the red text are meteorological station names. |
Table 1 Definition of CS events in terms of frequency, number, duration, and temperature |
| Items | Definition | Units |
|---|---|---|
| CS frequency | Number of participating days according to CS events | Day |
| CS number | Number of CS events | Time |
| CS duration | Number of days between the first day and the last day according to CS events in a CS year | Day |
| CS temperature | Daily minimum temperature of CS events | ℃ |
Figure 2 Annual variations in CS events in northern China during the period 1960-2016. The marked circles are annual values, and black lines are linear trends. |
Figure 3 Annual variations in the starting date and ending date of CS events in northern China during the period 1960-2016. The marked circles are the dates of the CS occurrences. |
Table 2 Decadal variations in CS events in terms of frequency, number, duration, and temperature |
| Items | 1960-1970 | 1971-1980 | 1981-1990 | 1991-2000 | 2001-2016 |
|---|---|---|---|---|---|
| CS frequency (days per year) | 13.63 | 12.07 | 10.47 | 10.76 | 10.41 |
| CS number (times per year) | 9.06 | 8.23 | 7.27 | 7.31 | 7.16 |
| CS duration (days per year) | 169.53 | 163.47 | 150.75 | 151.69 | 148.44 |
| CS temperature (℃ per year) | -12.97 | -12.33 | -12.57 | -11.83 | -11.31 |
Figure 4 Annual variations in the extreme value in CS events in northern China during the period 1960-2016. The marked circles are annual extreme values, and the black lines are linear trends. |
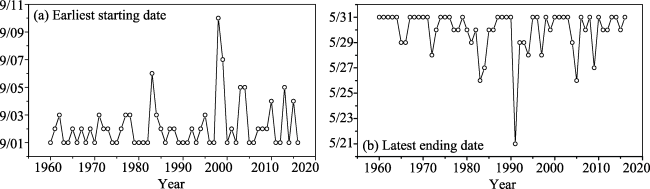
Figure 5 Annual variations in the earliest starting date and the latest ending date of CS events in northern China during the period 1960-2016. The marked circles are the dates of CS occurrence. |
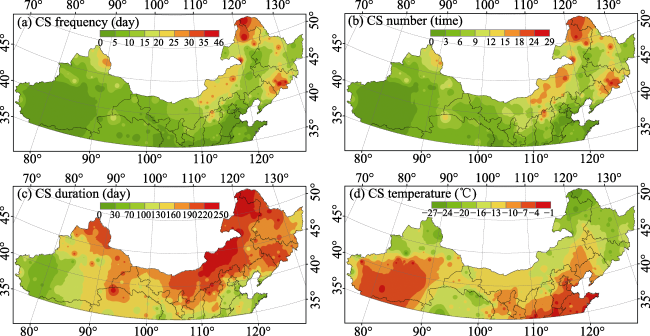
Figure 6 Spatial distribution of CS events in northern China during the period 1960-2016 |
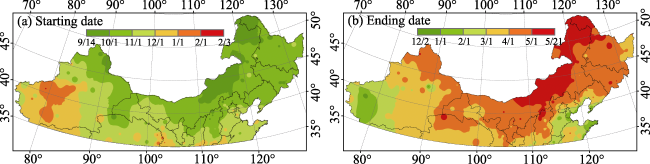
Figure 7 Spatial distribution of the starting date and ending date of mean CS events in northern China during the period 1960-2016 |
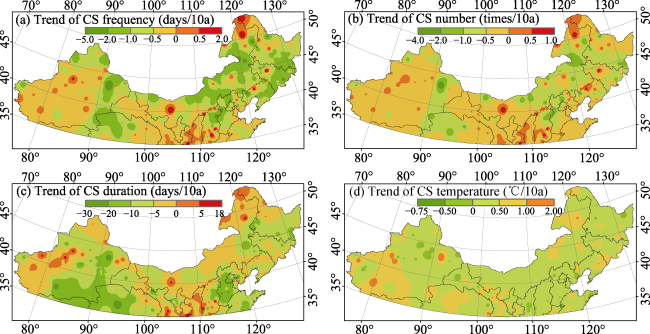
Figure 8 Spatial trends of CS events in northern China during the period 1960-2016 |
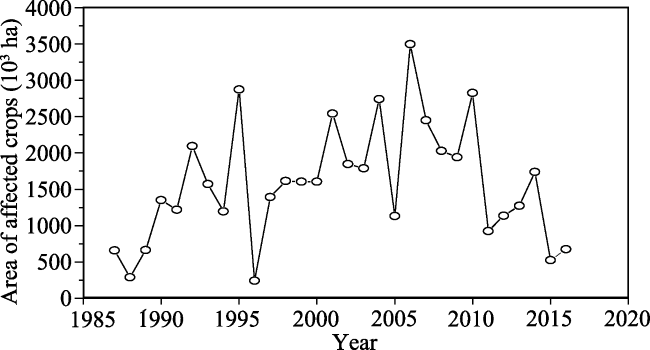
Figure 9 Area of affected crops in northern China during the period 1987-2016 |
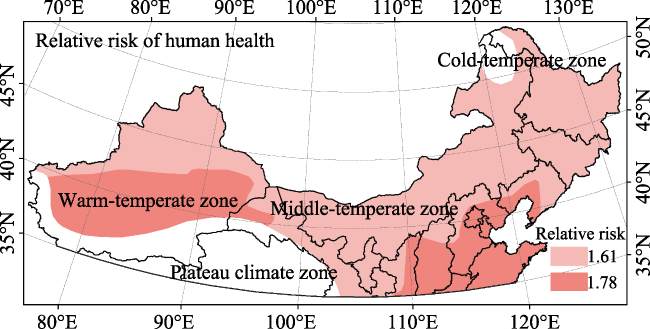
Figure 10 Spatial distribution of the relative risk to human health in northern China during the period 2007-2012. This figure was redrawn from Wang et al., 2017. The relative risk in the cold-temperate zone and the plateau climate zone was not analyzed in their study. |
The authors have declared that no competing interests exist.
| [1] |
|
| [2] |
|
| [3] |
|
| [4] |
|
| [5] |
|
| [6] |
|
| [7] |
|
| [8] |
|
| [9] |
|
| [10] |
|
| [11] |
|
| [12] |
|
| [13] |
|
| [14] |
|
| [15] |
|
| [16] |
|
| [17] |
|
| [18] |
|
| [19] |
|
| [20] |
|
| [21] |
|
| [22] |
|
| [23] |
|
| [24] |
Ministry of Agriculture of the People’s Republic of China (MAC), 1988-2017. Agricultural Statistics of China. Beijing: Chinese Agricultural Press.
|
| [25] |
|
| [26] |
|
| [27] |
|
| [28] |
|
| [29] |
|
| [30] |
|
| [31] |
|
| [32] |
|
| [33] |
|
| [34] |
|
| [35] |
|
| [36] |
|
| [37] |
|
/
| 〈 |
|
〉 |