Special Issue: Water Resources in Beijing-Tianjin-Hebei Region

The effects of urban water cycle on energy consumption in Beijing, China

  • HE Guohua 1, 2 ,
  • ZHAO Yong , 1, 2* ,
  • WANG Jianhua 1, 2 ,
  • ZHU Yongnan 1, 2 ,
  • JIANG Shan 1, 2 ,
  • LI Haihong 1, 2 ,
  • WANG Qingming 1, 2
Expand
  • 1. State Key Laboratory of Stimulation and Regulation of Water Cycles in River Basins, Beijing 100038, China
  • 2. China Institute of Water Resources and Hydropower Research, Beijing 100038, China
*Corresponding author: Zhao Yong (1977-), Professor, specialized in water cycle. E-mail:

Author: He Guohua (1990-), PhD, specialized in water-energy nexus. E-mail:

Received date: 2018-05-12

  Accepted date: 2018-11-23

  Online published: 2019-06-25

Supported by

National Key Research and Development Program of China, No.2016YFC0401407

National Science Fund for Distinguished Young Scholars, No.51625904

International Science & Technology Cooperation Program of China, No.2016YFE0102400

Copyright

Journal of Geographical Sciences, All Rights Reserved

Abstract

Energy is consumed at every stage of the cycle of water production, distribution, end use, and recycled water treatment. Understanding the nexus of energy and water may help to minimize energy and water consumption and reduce environmental emissions. However, the interlinkages between water and energy have not received adequate attention. To address this gap, this paper disaggregates and quantifies the energy consumption of the entire water cycle process in Beijing. The results of this study show that total energy consumption by water production, treatment and distribution, end use, and recycled water reuse amounts to 55.6 billion kWh of electricity in 2015, or about 33% of the total urban energy usage. While water supply amount increased by only 10% from 2005 to 2015, the related energy consumption increased by 215% due to water supply structural change. The Beijing municipal government plans to implement many water saving measures in the area from 2016 to 2020, however, these policies will increase energy consumption by 74 million kWh in Beijing. This study responds to the urgent need for research on the synergies between energy and water. In order to achieve the goal of low-energy water utilization in the future, water and energy should be integrated in planning and management.

Cite this article

HE Guohua , ZHAO Yong , WANG Jianhua , ZHU Yongnan , JIANG Shan , LI Haihong , WANG Qingming . The effects of urban water cycle on energy consumption in Beijing, China[J]. Journal of Geographical Sciences, 2019 , 29(6) : 959 -970 . DOI: 10.1007/s11442-019-1639-5

1 Introduction

The volume of urban water supply has increased rapidly with the expansion of the global population during recent decades (Vörösmarty et al., 2000). According to the world urbanization prospects (Valek et al., 2017), there will be 7 billion people living in urban areas as of 2050. This is equivalent to the entire global population today. A large urban population implies a considerable increased demand on water service provision, along with water-related energy consumption. Although water and energy policies continue to be formulated separately, the relationship between water and energy is inherently linked. Energy is used in every stage of urban water cycle, from water abstraction, treatment, distribution, to end use and recycled water treatment (Lam et al., 2017). As a pertinent example, at present about 12% of primary energy consumption in the US is related to the water sector (Sanders and Webber, 2012) and current estimates state that at least 2% to 8% of global energy use is in the water sector (Connor, 2012).
As one of the world’s most populous cities, Beijing’s population exploded in the early 21st century because of rapid urban growth (Zhang and Brown, 2005). In 2011, the municipal population exceeded 20 million for the first time and is expected to continue increasing in the coming decades (Wang et al., 2015). As a consequence of population growth, the average water resources per capita decreased from 300 m3 in 2000 to 100 m3 in 2011 (Xinhua Report, 2011). To meet urban water demand, many high energy-intensive water sources are used in Beijing, including deep groundwater, recycled water and inter-basin transfer water. At the same time, the increase in water supply has also increased the energy consumption of water treatment and distribution, as well as recycled water treatment. Beijing is a city where water and energy are in relative shortage, and the extensive use of water and energy will restrict the sustainable development of the city. In this grave water and energy situation, an in-depth study of water and energy synergies is of particular importance for the healthy development of both water and energy resources.
General information regarding water and energy and their relationship is available, especially in terms of national, regional, or the average values (Council, 2011). However, the study of energy consumption in the whole water cycle at the city-level is still in its infancy (Kahrl and Roland-Holst, 2008; Qin et al., 2015). Kenway et al. (2013) quantified the impact of different policy decisions on the water-energy future for Melbourne, Australia. Using urban metabolism modelling, they found that a compact urban form would result in greater water savings than a sprawling city. They also showed that while desalination will become more important, it currently provides a low percentage of total water, but with a high energy cost. Lam et al. (2017) developed a cost curve of water-related energy management options from a city perspective for a hypothetical Australian city. The results show that the end use process has a greater effect on energy consumption, and if policy maker invested in end use options instead of utility options, greater energy saving potential at greater cost-effectiveness could be achieved in urban water systems. Vincent et al. (2014) discussed the energy cost that has been, or may be, associated with water independence for Singapore. They showed that while Singapore is world-leading in terms of becoming self-sufficient with regard to water supply, this may come at a high energy cost, increasing reliance on energy imports. In a more narrowly focused study, Venkatesh et al. (2014) showed that climate, technology, and geography, inter alia, play important roles in shaping the water-energy nexus in different parts of the world. Jiang et al. (2016) showed the important contribution of urban residential water consumption to overall energy demand in an urban area, taking Tianjin, China, as an example. They showed that through a variety of in-home water savings measures, a significant energy saving city-wide could be achieved. A smaller scale study of household water-energy nexus was conducted by Hokoi et al. (2013), who quantified the energy consumption by hot water supply and cooking in Nanjing city and Hefei city through a field survey. Some small influencing factors, such as frequency of cooking, cooking time, and bathing time were considered. Taking Beijing as a case, Chen and Chen (2016) used input-output modelling and system network modelling to show the energy used for water services in the city, and demonstrated the tight coupling of water and energy use for Beijing. In general, although the majority of previous academic studies have analyzed the energy use of a certain part of water cycle processes and are very useful in providing general quantitative results, they lack an in-depth analysis of whole water cycle energy use at the city-level and the study of the water-energy nexus in China is still in its infancy.
In this study, data from multiple sources are compiled and used to calculate energy consumption for di?erent processes of water utilization in Beijing, including water production, treatment, and distribution, as well as end use and recycled water treatment. Furthermore, our work analyzes the trend of water supply structure change on energy consumption for the water sector from 2005 to 2015. The impact of different water-saving activities on energy consumption also is discussed in this article. A better understanding of water-energy linkages will provide valuable insights on water resource sustainable utilization and technical solutions, which, in turn, will contribute to achieving the goal of low-energy water utilization in the future.

2 Method and data

Energy used by the water sector can be divided into constructional use and operational use. Constructional use refers to the energy used in constructing water-related infrastructure such as wells, conveyance pipes and treatment plants; operational use indicates the energy used to extract, convey, treat and distribute water (Rothausen and Conway, 2011). The former category is usually counted as energy used by industry and therefore is not considered in this study.
In general, the water cycle can be divided into four parts: water production, treatment and distribution, end use, and recycled water treatment. The energy consumed by each process is expressed in terms of kWh of electricity per cubic meter of water applied or served in this study.

2.1 Data source

The data sources used in this paper are divided into three categories: water supply amount data, pumping lift data, and parameters and energy quota data. These data were collected from Chinese government-authorized sources, as well as a series of reports and academic journal articles. The data used in this study, as well as their sources, are shown in Table 1 and explained in detail in the following sections.

2.2 Energy use for water production

2.2.1 Groundwater withdrawal
According to the theoretical physical relationship, the energy required to lift groundwater varies depending on the quantity and depth of the water being pumped and the type and efficiency of the pumping system. This method has been widely used in several studies (Rothausen et al., 2011), and the formula is as follows:
Table 1 Energy intensity for various water processes in Beijing and the data sources
Item Value Data sources
Water supply amount Water supply amount of different sources (108 m³) CWSY (2016)
Pumping lift Groundwater pump (m) CGMY (2015)
Surface water lift (m) CIAD Centre (2009)
Parameters and
energy quota


Efficiency of electrical motors (%) 40 Shah et al. (2009)
Karimi et al. (2012)
Efficiency of diesel motors (%) 15 Shah et al. (2009)
Karimi et al. (2012)
Water lost rate in water supply network (%) 15 Beijing 13th Five-year Water-
saving Plan (2016)
Fresh water treatment (kWh/m³) 0.374 CUWSD (2015a)
Fresh water distribution (kWh/m³) 0.441 CUWSD (2015b)
Wastewater collection (kWh/m³) 0.2 Gao (2012)
Wastewater treatment (kWh/m³) 0.33 CUWSD (2015b)
Recycled water treatment (kWh/m³) 0.84 CUWSD (2015b)
Energy intensity for bathing (kWh/m³) 31.5 Zhu (2017)
Energy intensity for cooking water use (kWh/m³) 99.2 Zhu (2017)
Energy intensity for hot water drinking (kWh/m³) 99.2 Zhu (2017)
Energy intensity for washing machine (kWh/m³) 7.5 Plappally and Leinhard (2012)
Energy intensity for office water use (kWh/m³) 6.6 Arpke and Hutzler (2006)
Energy intensity for school water use (kWh/m³) 5.7 Arpke and Hutzler (2006)
Energy intensity for hotel water use (kWh/m³) 22 Arpke and Hutzler (2006)
Energy intensity for restaurant water use (kWh/m³) 69 Turiel et al. (1987)
Arpke and Hutzler (2006)
Energy intensity for hospital water use (kWh/m³) 58 Turiel et al. (1987)
Arpke and Hutzler (2006)
$Energy\ consumption(kWh)=\frac{gravity(m{{s}^{-2}})\times lift(m)\times Mass(kg)}{3.6\times {{10}^{6}}\times efficiency(%)}$ (1)
where the gravitational acceleration is 9.8 m/s2. The pumping efficiency is mainly affected by the power type, which is primarily electricity or diesel in Beijing, and the efficiencies of electrical and diesel motors are estimated to be 40% and 15% (Shah et al., 2009; Karimi et al., 2012), respectively.
By considering the impact of the water table drawdown and water head on the pump lift, the experimental results in 366 villages of north China were applied to refine the calculation of the pump lift (Eq 2) (Wang et al., 2012).
$Lift(m)=0.906\times groundwater\ level(m)+21.75\ \ {{R}^{2}}=0.62$ (2)
2.2.2 Surface water conveyance pumping
Surface water lift refers to use of energy to pump surface water from rivers, lakes or reservoirs. Eq. (1) was also used to calculate energy use for surface water lift. Pumping lift is a critical factor that influences surface energy consumption and varies according to specific local conditions. China’s Irrigation and Drainage Development Centre investigated the surface water pumping lift in Beijing in 2009 (CIAD Centre, 2009) and the pumping lift data were used in this paper. Data on the volume of surface water lift was obtained from the China Water Statistical Yearbook 2015 (CWSY, 2016).
Inter-basin water transfer projects are the most energy-intensive type of surface water supply. The energy consumption of these projects depends primarily on the length of each individual transfer project. The middle route of the South-to-North water transfer project is the only water transfer project in Beijing, and the amount of water transferred in 2015 was 880 million m³. A previous study calculated the energy use for water transfer projects per unit distance in China to be 0.0045 kWh/m3 per km (Gao, 2012) and this quota is adopted in this paper.

2.3 Water treatment and distribution

Freshwater can be either directly used or treated in public water plants before use. The fresh water treated in the study area mainly includes surface water, groundwater and inter-basin transfer water. Additionally, these water sources are mainly distributed in urban domestic and industrial. Energy is also required to distribute the water from treatment plants to users. The energy consumption of water distribution depends primarily on the topography. China’s urban water supply yearbook for 2015 (CUWSDA, 2015a) contains data regarding the provincial energy consumption of water treatment and distribution. The average value of energy consumption for water treatment and distribution in Beijing is 0.374 kWh/m³ and 0.441 kWh/m³, which are adopted as the calculation standard in this paper.

2.4 End users

The end users of water in the study area including domestic, public, industry, environment, and agriculture. For some direct water users, such as agriculture and the environment, there is little energy consumed in the end use process; therefore, this paper only calculates domestic, public, and industrial energy consumption in the end use part.
2.4.1 Domestic water use
Energy consumption for domestic water can be divided into water heating and washing machine energy use (Plappally and Leinhard, 2012). Water heating energy use includes bathing, cooking, and other activities, which require a higher water temperature. Che et al., (2015) investigated the structure of household water use in Beijing, and found that hot water use accounts for 43% (bathing, cooking, and hot water drinking) of the total. Heating energy intensity for bathing, cooking and hot water drinking in Beijing is 31.5, 99.2, and 99.2 kWh/m3, respectively (Zhu, 2017). Energy consumption for washing machines is related to the type of machine. At present, 90% of China’s washing machines are vertical, and the average energy consumption is 7.5 kWh/m3 (Plappally and Leinhard, 2012).
2.4.2 Public domestic water use
Public domestic water use refers to water consumption in offices, schools, hospitals, and other public buildings, as well as green-land irrigation. Water heating is the major part of public domestic water-related energy consumption. Wang et al. (2008) analyzed the structure of public domestic water use in Beijing, of which water use by offices accounted for the largest proportion. Due to a lack of previous studies considering China, some foreign quota of energy intensity in public domestic water use is used in this study (Turiel et al., 1987; Arpke and Hutzler, 2006).
2.4.3 Industry
Water-related energy consumption in industry is mainly concentrated in the water cooling and heating. At present, the electricity consumption of water cooling and heating in Beijing accounted for 10% of total industrial electricity consumption (Xiao, 2015). Thus, 10% of Beijing’s total industrial electricity consumption is used as water-related energy consumption in this paper.

2.5 Energy use for recycled water treatment

The treatment of recycled water can be divided into two categories: preliminary treatment before discharging water to the environment, and high-quality treatment for water recycling. Eq.3 shows the formula used for calculating the energy consumed to process recycled water:
$E={{Q}_{i}}\times {{R}_{W}}\times (1+L)+{{Q}_{i}}\times {{R}_{R}}$ (3)
where E is energy consumption (kWh); Qi is the volume of recycled water (m3); L is water lost to pipeline leaks in the water supply system (%), and distribution losses in the water supply network were estimated to be 15% (BWA, 2016); and RW and RR are energy needed for treating recycled water and wastewater (kWh/m3). The Urban Drainage Statistical Yearbook (CUWSD, 2015) contains annual electricity consumption data of the recycled water plants and wastewater treatment plants in Beijing, which are used in this paper.

3 Result and discussion

3.1 Energy consumption for Beijing water utilization

The Sankey diagram shown in Figure 1 depicts the energy required for the whole water cycle process in Beijing in 2015. The chain of water utilization (including water production, treatment and distribution, end use, and recycled water treatment) consumed 55.6 billion kWh, accounting for about 33% of total energy consumption in the city (NBSC, 2016). The highest percentage of energy use was for end use process (90%) and domestic water use in particular (32.8 billion kWh). Groundwater is the main water supply source in Beijing (50%), and also is the most energy-intensive water source in the water production process. The overexploitation of groundwater not only consumes a lot of energy, but also has caused many geological and environmental problems. Beijing and the surrounding area has become the world’s largest groundwater mining region, second only to Northern India (Margat and Gun, 2013). With falling water tables and the long-term unsustainable use of groundwater, one can expect that more energy will be required for each unit of water withdrawn. In 2015, the leakage rate of the water supply network was estimated to be 15%, which means that 0.32 billion m³ of water and 0.14 billion kWh of electricity for water treatment and distribution was lost. Recycled water is Beijing’s second largest water source for water supply, accounting for 25% of the total. Although the use of recycled water can ease water pressure, the energy consumption for recycled water production is much higher than for other water sources. According to the government’s plan, Beijing’s recycling rate will increase by 25% in 2020 compared with 2015, meaning that electricity consumption in the recycled water treatment process will continue to increase in the future.
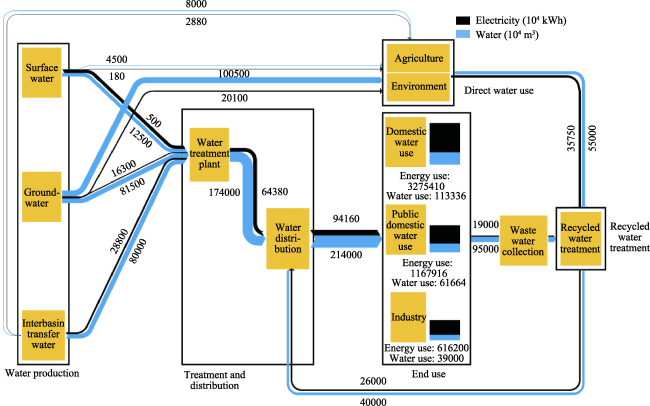
Figure 1 Sankey diagram of energy use in the whole water cycle process in Beijing in 2015

3.2 Time series analysis of energy consumption for water supply

Despite the water supply amount remaining stable during the past years, the water supply structure has changed a lot in Beijing (Figure 2a). For example, over the past 11 years, the recycled water supply has increased from 260 million m3 to 950 million m3, an increase of 3.7 times. In 2015, recycled water became the second largest water source in Beijing only after groundwater. Inter-basin transfer water is another unconventional source that has increased; the amount of water transferred accounted for 23% in 2015. To evaluate the effect of water supply structure change on energy use, this paper calculates the water-related energy use for the water supply during 2005 to 2015 (Figure 2a). We can clearly see in Figure 2a that the water supply amount in Beijing only increased by 10% during the last decade, however, the energy used for the water supply increased by three times, from 1.3 billion kWh in 2005 to 4.1 billion kWh in 2015. In addition, it can be seen in Figure 2a that there are two inflection points, in 2008 and 2015, respectively. Before 2008, energy use for water supply increased significantly at a rate of 25% per year. During 2008 to 2014, the upward trend was relatively weak, at a rate of 4% per year. In 2015, the upward trend increased again at a rate of 23%.
The energy use for different water supply sources in Beijing is showed in Figure 2b. Figure 2b shows that the rapid increase of water-related energy use in Beijing during 2005 to 2008 was mainly due to the increase of energy use associated with recycled water supply. In 2008, the 29th Olympic Games was hosted in Beijing and Green Olympics was adopted as the propaganda slogan. To achieve this goal, Beijing proposed that the urban wastewater treatment rate and recycled water reuse rate would reach 90% and 50%, respectively, by 2008 (Sina Reports, 2006). Six new recycled water plants were built during 2005-2008, resulting in a significant increase of recycled water use, as well as energy consumption. In 2015, the main reason for the significant increase in energy use is attributed to inter-basin transfer water. The mid-route of the South-to-North Water Diversion Project (SNWDP) is the unique water transfer project in Beijing and was implemented in December 2014. The water supply amount from the SNWDP in 2015 reached 880 million m³ and 320 million kWh were used to transfer water.
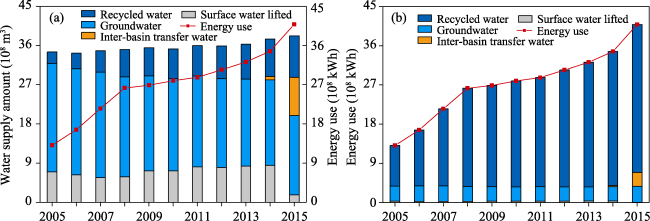
Figure 2 Energy use for water supply during 2005 to 2015 (a. Energy use for water supply in Beijing; b. Energy use for different water supply sources)
Beijing is a water shortage city, with a gap more than 2 billion m³ between available water resources and the required amount of water (Figure 3). In order to meet water demand, some high energy intensity water sources are being used extensively in Beijing. However, through the above analysis, Beijing eases water supply pressure at the expense of electricity consumption. In addition, Beijing’s electricity is mainly generated by thermal power, and the increase of water-related energy use means more emissions of greenhouse gases and other air pollutants (Xue et al., 2016).
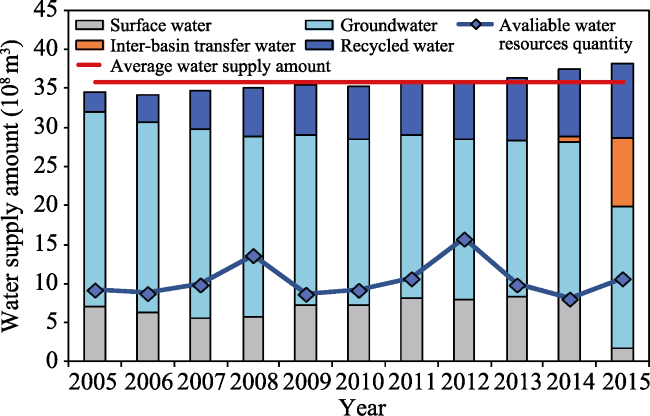
Figure 3 Water supply amount and available water resources quantity from 2005 to 2015 in Beijing

3.3 The effect of future water saving activities on energy consumption

Facing the pressure of water shortage, water conservation is the inevitable trend and the basic requirement of future economic and social development. According to the Water-saving Society Establishment Plan (2016-2020) (hereafter referred to as the “Establishment Plan”) released by the Beijing municipal government in April 2016, Beijing will limit the water use amount to 4.3 billion m³ in 2020, of which recycled water have to account for 1.2 billion m³. Five water-saving measures will be implemented according to the Establishment Plan during 2016-2020 (Table 2). Through the calculation method displayed in Part 2, the impact of different water-saving activities on energy consumption was evaluated and detailed evaluation results are shown in Figure 4. We can clearly see in Figure 4 that water conservation and energy conservation are not simply identical and not always consistent. In some cases, water conservation can result in energy saving, but in other cases, entails more energy consumption. For example, reducing groundwater use by increasing recycled water usage can save about 1.5 billion m3 of water, however, this water-saving activity will increase energy consumption by 100 million kWh. In general, implementation of water-saving measures in Beijing can save water about 350 million m³ of water, but the electricity consumption would increase by 74 million kWh (Figure 4).
Table 2 Water saving activities implemented in 2016-2020
Water cycle Option Unit Current value Plan value in 2020
Water production Reduce groundwater exploitation by increasing the use of inter-basin transfer water 104 0 26000
Treatment and distribution Reduce leakage rate of urban water
supply network
% 15 10
End use
Improve industrial water recycling rate % 89.7 91.4
Improve the utilization efficiency of irrigation water in farmland % 0.705 0.75
Recycled water treatment Reduce groundwater exploitation by increasing the use of recycled water 104 0 15100
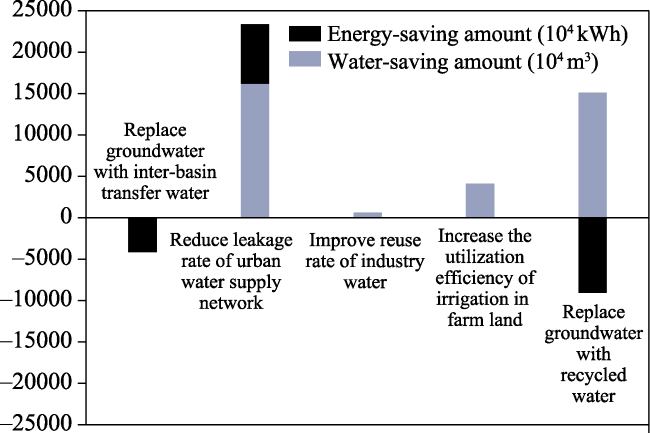
Figure 4 Energy consumed in water saving activities (when the energy-saving amount is negative, it means that energy is consumed; the reverse means that the energy is saved)

3.4 Uncertainty

To evaluate the accuracy of the calculation results, this paper compares the water-related energy quota between Beijing and other regions (Table 3). Table 3 shows that our results match well with Cohen et al. (2004), Klein (2005), and Goldstein and Smith (2002). The difference between our estimates and those of Griffiths (2009) in regard to domestic water-related energy use are within ±10%.
Because there are no records indicating the annual energy quota in regard to recycled water treatment in Beijing, this paper evaluates energy use for recycled water treatment from 2005 to 2015 according to the 2015 quota (Figure 2a). However, the energy quota will gradually decrease with technological progress; therefore, this paper may underestimate the energy use of recycled water treatment before 2014. In addition, using a constant pumping efficiency to evaluate the energy use of groundwater pumping during 2005 to 2015 also introduces some uncertainties in the results.
Table 3 Comparison between results from other studies
Author and
region
Water-sector processes Estimated energy intensity (kWh/m³) Beijing water sector processes Estimated energy intensity (kWh/m³)
Cohen et al.
San Diego, USA
Supply and treatment 0.06-3.4 Water production (Surface water, ground-water and inter-basin transfer water) 0.25
Residential end use 0-22 Fresh water treatment 0.374
Wastewater treatment 0.11-0.79 Fresh water distribution 0.441
Klein California, USA Water supply/conveyance 0-3.69 Wastewater collection 0.2
Water treatment 0.03-4.23 Wastewater treatment 0.33
Water distribution 0.2-0.32 Recycled water treatment 0.84
Wastewater collection and treatment 0.29-1.22 Domestic water use 28.9
Recycled water treatment
and distribution
0.11-0.32 Public domestic use 18.9
Goldstein and Smith, USA Surface-water
treatment
0.371-0.392 Industry 15.8
Wastewater treatment 0.177-0.780
Griffiths, USA Heating of residential water 32

4 Conclusions

Energy and water are essential, inseparable, and inextricably linked resources, and understanding the nexus between water and energy will help to develop a sustainable, low-carbon water supply and to optimize the allocation of water resources. This study classifies the water cycle into water production, treatment and distribution, end use and recycled water treatment. Collected and compiled data from multiple sources are used to calculate the energy use in different processes. According to the results, for the entire processes considered, the water cycle consumes 55.6 billion kWh of electricity, or about 33% of the total urban energy consumption. The highest percentage of energy consumption for water is attributed to the water end use process (90%), especially for domestic water use (32.7 billion kWh). Although the water supply amount remained stable from 2005 to 2015, the structure of the water supply changed significantly, which led to the continued increase of energy consumption associated with water supply (215%).
This study also reveals the relationship between water saving and energy conservation. Energy use by the water sector is directly proportional to the water use amount for prescribed technologies. However, water saving cannot translate into energy savings when these water savings are achieved through more energy-intensive technologies. According to government’s water-saving plan, the water-saving measures that will be implemented in Beijing can save about 350 million m³ of water, but the electricity consumption would increase by 74 million kWh.
This study focused on energy use for water, however, it is equally important to explore water use for energy production. With the rapid increase of population and economic development in China, ensuring water and energy security simultaneously is becoming an unprecedented challenge. Moving forward, comprehensive studies that explore all aspects of the water-energy nexus for integrated and spatially explicit planning would help improve the sustainability and prosperity of Beijing.

The authors have declared that no competing interests exist.

[1]
Arpke A, Hutzler N, 2006. Domestic water use in the United States: A life-cycle approach.Journal of Industrial Ecology, 10(5): 169-184.

[2]
Beijing Water Authority (BWA), 2016. Beijing’s 13th Five-year Water-saving Society Construction Plan. Beijing: China Water & Power Press. (in Chinese)

[3]
China GEO-Environmental Monitoring Institute, 2015. China Groundwater Level Yearbook of GEO-Environmental Monitoring. Beijing: China Land Press. (in Chinese)

[4]
China GEO-Environmental Monitoring Institute, 2016. China Groundwater Level Yearbook of GEO-Environmental Monitoring. Beijing: China Land Press. (in Chinese)

[5]
Che J M, Fu Y C, Wu Z Het al., 2015, Investigation and analysis on household water use level and structure in Beijing.China Rural Water and Hydropower, 93-95. (in Chinese)

[6]
Chen S, Chen B, 2016. Urban energy-water nexus: A network perspective.Applied Energy, 184(15): 905-914.

DOI

[7]
China Irrigation and Drainage Development Center, 2009. Renovation Plan of Large-scale Irrigation and Drainage Pumping Station in China. Beijing: CIDDC Press. (in Chinese)

[8]
Cohen R, Nelson B, Wolff G, 2004. Energy Down the Drain. The Hidden Costs of California’s Water Supply. Pacific Institute & Natural Resources Defense Council.

[9]
Connor R, 2012. Managing Water under Uncertainty and Risk. The United Nations.

[10]
China Urban Water Supply and Drainage Association (CUWSDA), 2015a. China’s Urban Water Supply Yearbook. (in Chinese)

[11]
China Urban Water Supply and Drainage Association (CUWSDA), 2015b. China’s Urban Water Drainage Yearbook. (in Chinese)

[12]
China Water Statistical Yearbook, 2016. China Water Statistical Yearbook 2015. Beijing: China Water Resources and Hydropower Press. (in Chinese)

[13]
Gao J J, 2012. The Nexus of Water Resource and Electricity Production in China. Tianjin: Tianjin University. (in Chinese)

[14]
Goldstein R, Smith W, 2002. Water and Sustainability: US Electricity Consumption for Water Supply and Treatment: The Next Half Century. Electric Power Research Institute.

[15]
Griffiths-Sattenspiel B, Wilson W, 2009. The Carbon Footprint of Water. River Network. .

[16]
Hokoi S, D Ogura, X Fuet al., 2013. Field survey on energy consumption due to hot water supply and cooking in Nanjing and Hefei, China.Frontiers of Architectural Research, 2: 134-146.

DOI

[17]
Jiang S, Wang J, Zhao Yet al., 2016. Residential water and energy nexus for conservation and management: A case study of Tianjin.International Journal of Hydrogen Energy, 41(35): 15919-15929.

DOI

[18]
Kahrl F D, Roland-Holst, 2008. China’s water-energy nexus.Water Policy, 3(10): 1-16.

[19]
Karimi P, Qureshi A S, Bahramloo R, 2012. Reducing carbon emissions through improved irrigation and groundwater management: A case study from Iran.Agricultural Water Management, 108(2): 52-60.

DOI

[20]
Kenway S, Turner G M, Cook Set al., 2013. Water and energy futures for Melbourne: Implications of land use, water use, and water supply strategy.Journal of Water and Climate Change, 5(2): 163-175.

[21]
Klein G, 2005. California’s Water-Energy Relationship. California Energy Commission.

[22]
Lam K L, Kenway S J, Lant P A, 2017. Energy use for water provision in cities.Journal of Cleaner Production, 143: 699-709.

DOI

[23]
Margat J, Gun J V D, 2013. Groundwater around the World. Boca Raton: CRC Press.

[24]
National Bureau of Statistics of China(NBSC), 2016. China Statistical Yearbook. Beijing: China Statistics Press. .

[25]
Plappally A K, Leinhard V J H, 2012. Energy requirements for water production, treatment, end use, reclamation, and disposal.Renewable & Sustainable Energy Reviews, 16(7): 4818-4848.

[26]
Qin Y, Curmi E, Kopec G Met al., 2015. China’s energy-water nexus: Assessment of the energy sector’s compliance with the “3 Red Lines” industrial water policy.Energy Policy, 82(1): 131-143.

DOI

[27]
Rothausen S, Conway D, 2011. Greenhouse-gas emissions from energy use in the water sector.Nature Climate Change, 1(4): 210-219.

DOI

[28]
Sanders K T, Webber M E, 2012. Evaluating the energy consumed for water use in the United States.Environmental Research Letters, 7(3): 4034-4045.

[29]
Shah T, Bovolo C I, Parkin Get al., 2009. Climate change and groundwater: India’s opportunities for mitigation and adaptation.Environmental Research Letters, 4(3): 375-383.

[30]
Sina Reports,2006. Beijing has accelerated its Olympic environmental goals. Accessed May 2006, .

[31]
Turiel I, Craig P, Levine Met al., 1987. Estimation of energy intensity by end-use for commercial buildings.Energy, 12(6): 435-446.

DOI

[32]
Valek A M, Sušnik J, Grafakos S, 2017. Quantification of the urban water-energy nexus in México City, México, with an assessment of water-system related carbon emissions.Science of the Total Environment, 2(24): 234-245.

[33]
Venkatesh G, Chan A, Brattebø H, 2014. Understanding the water-energy-carbon nexus in urban water utilities: Comparison of four city case studies and the relevant influencing factors.Energy, 17(75): 153-166.

[34]
Vincent L, Michel L, Catherine Cet al., 2014. The energy cost of water independence: The case of Singapore.Water Science & Technology A Journal of the International Association on Water Pollution Research, 70(5): 787-799.

[35]
Vörösmarty C J, Green P, Salisbury Jet al., 2000. Global water resources: Vulnerability from climate change and population growth.Science, 289(5477): 284-288.

DOI

[36]
Wang J, Rothausen S G S A, Conway Det al., 2012. China’s water-energy nexus: Greenhouse-gas emissions from groundwater use for agriculture.Environmental Research Letters, 7(1): 14035-14044.

DOI

[37]
Wang J, Shang Y, Wang Het al., 2015. Beijing’s water resources: Challenges and solutions.Jawra Journal of the American Water Resources Association, 51(3): 614-623.

DOI

[38]
Wang Y, Chen Y S, Weng J Wet al., 2008. Analysis on characteristics of urban public water use in Beijing.Water and Wastewater Engineering, 16(34): 138-143. (in Chinese)

[39]
World Energy Council, 2011. World Energy Resources: 2010 Survey.

[40]
Xiao Z M, 2015. Energy saving analysis of industrial water cycle system.Industry, 284-285. (in Chinese)

[41]
Xinhua Report, Beijing water resources per capita decreases to 100 m3. Accessed May 2011, .

[42]
Xue Y, Tian H, Yan Jet al., 2016. Temporal trends and spatial variation characteristics of primary air pollutants emissions from coal-fired industrial boilers in Beijing, China.Environmental Pollution, 15(213): 717-726.

[43]
Zhang H H, Brown D F, 2005. Understanding urban residential water use in Beijing and Tianjin, China.Habitat International, 29(3): 469-491.

DOI

[44]
Zhu Y X, 2017. An Analysis of Energy Consumption on Whole Water Cycle Processes in Jing-Jin-Ji. Beijing: China Institute of Water Resources and Hydropower Research. (in Chinese)

Outlines

/