Special Issue: Water Resources in Beijing-Tianjin-Hebei Region

Optimizing water resources allocation in the
Haihe River basin under groundwater sustainability constraints

  • Grith MARTINSEN 1, 2, 3, 4 ,
  • LIU Suxia , 1, 3* ,
  • MO Xingguo 1, 3 ,
  • BAUER-GOTTWEIN Peter 2, 3, 4
Expand
  • 1. Key Laboratory of Water Cycle and Related Land Surface Processes, Institute of Geographic Sciences and Natural Resources Research, CAS, Beijing 100101, China
  • 2. Department of Environmental Engineering, Technical University of Denmark, 2800 Kgs. Lyngby, Denmark
  • 3. College of Resources and Environment/Sino-Danish Center for Education and Research, University of Chinese Academy of Sciences, Beijing 100049, China
  • 4. Sino-Danish Center for Education and Research, 8000 Aarhus, Denmark
*Corresponding author: Liu Suxia, Professor, specialized in hydrology and water resources. E-mail:

Author: Grith Martinsen (1988-), PhD Candidate, specialized in water resources modelling and hydroeconomic optimization for water resources management. E-mail:

Received date: 2018-05-12

  Accepted date: 2018-11-23

  Online published: 2019-06-25

Supported by

National Key Research and Development Program of China, No.2016YFC0401402

National Natural Science Foundation of China, No.41471026

Copyright

Journal of Geographical Sciences, All Rights Reserved

Abstract

This study applies a hydroeconomic optimization method for water resources management in the highly water stressed Haihe River basin. A multi-objective, multi-temporal deterministic hydroeconomic optimization model has been built to quantify the economic trade-offs and reveal “minimum cost strategies” when reducing groundwater abstraction to sustainable levels. A complex basin representation, with ~140,000 decision variables is formulated where each decision variable represents a flow-path from a water source to a sink. Available water sources are runoff generated by the sub-basins upstream the nine major surface water reservoirs, the inter-basin transfers from Yellow River and South to North Water Transfer Project (SNWTP) and the natural groundwater recharge to the three main groundwater aquifers. Water demands, i.e. sinks, are aggregated for each model sub-basin in categories of the major agricultural users, domestic, industrial and ecological water demands. Each demand is associated with a curtailment cost and groundwater abstraction with a pumping cost. Groundwater overdraft is constrained in each model scenario, ranging from unlimited overdraft in the plain area groundwater aquifer to sustainable abstractions over an 8-year period. Inflow upstream Yuqiao reservoir, and the inter-basin transfers from SNWTP and Yellow River are identified as the water resources with the highest increase in average shadow prices when limiting groundwater overdraft. An increase in inflow shadow prices of 37.5% indicates that these water sources will be most valuable if sustainable groundwater abstraction should be achieved. The shadow prices of water sources reveal when and where in the Haihe River basin users are curtailed if water resources are managed in the most optimal way. Average shadow prices of 1.6 yuan/m3 for all surface water sources in the sustainable abstraction scenarios shows that overdraft can be avoided by curtailment of users with a willingness-to-pay ≤1.6 yuan/m3. The shadow prices of the existing surface water reservoirs represented in the model shows that no costs can be saved from expanding their capacities. Finally, the cost of achieving sustainable groundwater abstraction with present water resource availability is found to be minimum 8.2 billion yuan/year.

Cite this article

Grith MARTINSEN , LIU Suxia , MO Xingguo , BAUER-GOTTWEIN Peter . Optimizing water resources allocation in the
Haihe River basin under groundwater sustainability constraints[J]. Journal of Geographical Sciences, 2019
, 29(6) : 935 -958 . DOI: 10.1007/s11442-019-1638-6

1 Introduction

Efficient water allocation is an on-going challenge for China being the world’s most populous nation and a major economy. Economic development has increased the pressure on the nations’ natural resources for decades. Consequences can be witnessed in many regions of China. Growing environmental concerns are also reflected in present 5-year political roadmaps of the Government of the People’s Republic of China, i.e. China’s 13th Five-Year Plan for Ecological & Environmental Protection (2016-2020). Herein green development and economic water use are emerging as priorities. One of the regions experiencing severe environmental consequences of economic development is the Haihe River basin in China. The basin covers 360,000 km2, including Hebei province and cities of Beijing and Tianjin, also stretching into Shanxi, Henan and Shandong provinces. The Taihang Mountain region bordering the basin to the West is supporting mining activities as well as sustaining rural farming. From the mountains the plain area with intensive agriculture and agglomerations of mega cities stretches to the Bohai Gulf to the east. To the south the basin is bordered by the lower reaches of the Yellow River. The plain area is a part of the area traditionally referred to as the North China Plain, the “food basket of China”. Approximately 70% of the water consumption here is used by the agricultural sector (Wang et al., 2015). Alongside the intensive agriculture, heavy industries as well as family owned small-scale industries are present within the basin, counting more than 15,000 private and state-owned industrial enterprises (CSY, 2015b; CSY, 2015c). The highly populated urban areas, industrialization and intensive agriculture have caused an immense pressure on the region’s water resources. The mega cities experience drastic declines in groundwater levels and land subsidence as a consequence of decade-long groundwater overdraft (Shu et al., 2012; Zhang and Li, 2013; Chen et al., 2016). The excessive surface water abstraction is facilitated by sophisticated engineered water infrastructure including channels and reservoirs, and abstraction schemes have dried out natural rivers. The combination of the region’s semi-arid climate and the competing water users has caused water deficit for decades, resulting in overdraft of the region’s groundwater resources (Feng et al., 2013). The changes in climatic variables have exerted remarkable impacts on the crop phenological stages, water consumption, and productivity during the last 3 decades over the North China Plain (Liu et al., 2010, Mo et al., 2017). The pressure on the region’s water resources is therefore expected to become more severe under future climate changes. Inter-basin water transfers from the neighboring Yellow River basin and the South to North Water Transfer Project (SNWTP) have been transporting billions of cubic meters of water to the basin every year. These huge water infrastructure projects have not succeeded in covering the water deficit, with their present water transfer schemes, and the groundwater aquifers within the basin are still experiencing overdraft.
When water resources are scarce, planning and management becomes crucial to avoid overexploitation and inefficient use. In a case of water scarcity the UN (1992) recommends that water should be viewed not merely as a human right but also as an economic good. With economics often being referred to as the “study of allocation of scarce resources”, hydroeconomic analysis has become an increasingly popular tool to assess water allocations and management under scarcity, since it emerged in the last part of the 20th century (Harou et al., 2009). For a review on the background of hydroeconomic models, optimization methods and economic valuation of water the reader is referred to Labadie (2004), Loucks et al. (2005), Harou et al. (2009) and Young (2005).
Hydroecomic models can serve as decision support for both planning and operation of water resources systems. These two aspects of water resources management have different objectives. Whereas planning deals with the aspect of “to do, or not to do” in terms of building new reservoirs, expanding infrastructure capacities, changing land uses etc., the operational objective deals with day-to-day decisions on the use of water, given the inherent uncertainty of future water availability. Planning aspects often involve a cost-benefit analysis of the value added of e.g. construction of a new reservoir. Having determined the economic value of water allocations to every user within the basin, the spatio-temporal economic effects in the system with or without the new projects can be evaluated within a given timeframe. For operational management of a given water resources system, the value of saving a unit of water for future use must be carefully assessed, and the importance of inflow uncertainties, planning horizons and other factors affecting the present value of water must be carefully considered in the formulation of the hydroeconomic optimization model.
China has in recent years had increased focus on market mechanisms and efficiency in water resources management in several policy documents, such as the No. 1 document of 2011 (MA PRC, 2010) and Water Ten Plan (Gov PRC, 2015). The most recent 13th Five-Year Plan (2016-2020) urges “the strictest possible water resources management system” and sets a cap on the Chinese water use of 670 billion m3 (CPC, 2016). Hydroeconomic optimization models can give insight into cost efficient water resources management under water availability and infrastructure constraints. Academic application of hydroeconomic modeling in China spans a wide variety of modeling approaches, such as optimization under climate change scenarios (Hong et al., 2017) and exploring water market scenarios (Fu et al., 2016). For the water stressed region of North China Plain studies are also numerous. Methods such as input-output models have been used to assess the link between economic activities, water resources and water quality in China (Guan and Hubacek, 2008) as well as the Haihe River basin (Qin et al., 2014). There have been several studies on multi-objective optimization and scenario analysis using hydroeconomic optimization in Haihe River basin (Wang et al., 2009; Weng et al., 2010; Zhu et al., 2010). Small-scale optimization studies on a single or a few reservoirs have been carried out within Haihe River basin (Liu et al., 2008; Wang et al., 2012, Davidsen et al., 2016) as well as on some of the major Chinese water infrastructure projects (Li et al., 2017).
These academic studies address the challenges of water authorities, and are often developed to serve as decision support. However, actual applications of hydroeconomic models in practical decision making are rare (Harou et al., 2009). It is often difficult for decision makers to relate abstract hydroeconomic model results to real-world dilemmas. One major reason is the high level of simplification and aggregation in the system representation that is often required for computational feasibility.
For operational management the choice of optimization method is crucial. The method determines the necessary level of system aggregation and how conveniently inflow uncertainty, and thereby uncertainty in available water resources, can be represented. Dynamic programming (DP) has often been applied for reservoir operation. In DP each system state variable, e.g. reservoir storage, is discretized into stages and all possible stages solved recursively (Loucks et al., 2005). Allowing a fine discretization of stages increases both precision as well as computational cost. As the number of state variables included in the problem increases, the computational demand increases exponentially, also referred to the curse of dimensionality. Methods such as stochastic dynamic programming (SDP) (Stedinger et al., 1984) capture inflow uncertainties, but inherit the curse of dimensionalities of the DP method. Applying the Benders cuts approximation of the cost-to-go function, as in stochastic dual dynamic programming (SDDP) (Pereira, 1989; Pereira and Pinto, 1991; Tilmant et al., 2008) further demands a convex future cost function. In problems with non-linearity or non-convexity of the future cost function, such as head-dependent groundwater costs, heuristic optimization algorithms, such as the Genetic Algorithm (GA), can be applied. GA can be used to search the feasible region for near-optimal solutions, but is also computationally demanding. Examples of such an optimization modeling framework can be found in Cai et al. (2001) and Davidsen et al. 2015a; 2016).
In contrast to staged DP approaches and near-optimal heuristic search algorithms are the multi-temporal deterministic optimization models that can identify optimal solutions of much more complex system representations. The multi-temporal model set-up reveals shadow prices and water allocations in each model time step. A problem with a linear objective function, linear constraints and a large number of decision variables can be formulated as a linear program (LP). Efficient LP solvers are available that can handle millions of decision variables at a reasonable computational cost. However, such models are typically formulated under the assumption of perfect foresight of future water availability. For preliminary decision support and relative comparison of water management scenarios this is often an appropriate assumption.
The aim of this study is twofold: 1) to increase the level of detail at which the water resources system is represented in a large-scale linear programming (LP) optimization model in order to identify new applications in decision making, and 2) to quantify the economic trade-offs from achieving sustainable groundwater allocation in Haihe River basin from the model set-up.
To approach the first aim, a detailed representation of the water resources system is proposed with respect to the following aspects:
· Optimize surface- and groundwater resources allocations in all major sub-basins within the Haihe River basin in one single holistic optimization model
· Illustrate decision-support for a large number of disaggregated water users up- and downstream of all major reservoirs
· Include individual groundwater units within the basin to assess spatial issues of groundwater overdraft
The second research objective is addressed by
· Analyzing the spatio-temporal distribution of shadow prices of water in the basin, originating from the model constraints
· Using the constraining method on the groundwater abstraction to identify economic trade-offs from sustainable groundwater abstraction
A LP optimization problem of ~140,000 decision variables covering monthly time steps over an eight year time horizon is formulated. The Haihe River basin is separated into 16 sub-basins with detailed user representation. Three major groundwater aquifer units are included and abstractions from these are represented using the constraining method starting from business-as-usual abstractions going to a scenario where total abstraction equals total groundwater recharge.
The model results help address relevant water resources management problems, such as: What is the economic trade-off from curtailing water users of the basin? What effects on optimal water allocations can be observed from constraining groundwater abstractions? Does the basin have water infrastructure bottlenecks? What is the water related economic consequence of restricting groundwater overdraft in the basin?
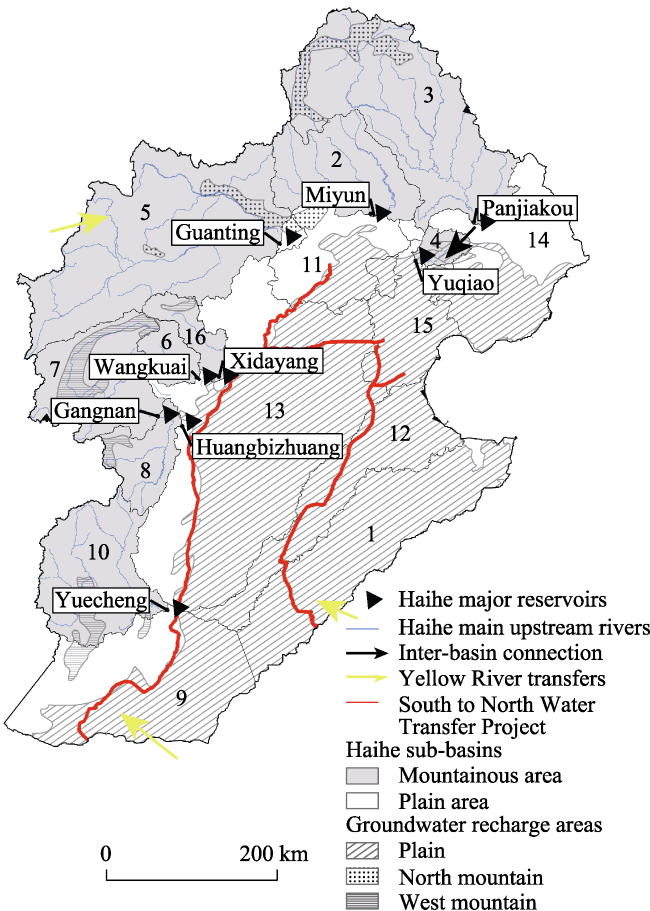
Figure 1 Conceptual model of the Haihe River basin with the nine major surface water reservoirs and their respective names, the transfer schemes and the 16 model sub-basins (1. Tumahe, 2. Miyun, 3. Panjiakou, 4. Yuqiao, 5. Guanting, 6. Wangkuai, 7. Gangnan, 8. Pingshan, 9. Zhangweihe, 10. Yuecheng, 11. Beijing, 12. Heilonggangyundong, 13. Plain mid, 14. Plain north, 15. Tianjin, 16. Xidayang) and the three groundwater units within Haihe River basin

2 Methods and data

The chapter presents the conceptual model and hydrological input data in section 2.1, the hydroeconomic optimization model setup in section 2.2 and the economic input dataset in section 2.3.

2.1 Study region and input data

2.1.1 Conceptual model
A conceptual model of the area is the basis of formulating the hydroeconomic optimization model. The conceptual model in Figure 1 shows the river basin outline and its 16 sub-basins together with the major groundwater aquifer units and inter-basin water transfers. The basin and sub-basins of the model are found using watershed delineation from Satellite Radar Topography Mission (SRTM) data (USGS, 2017). The nine largest reservoirs of the Haihe River basin, with capacities above 1000 M m3 (Lehner et al., 2011), define the mountainous sub-basin outlets. The sub-basins have been named after the major surface water reservoirs at their outlets. Huangbizhuang reservoir works in series with Gangnan reservoir and unit 8 in Figure 1 is therefore named after the hydrological station Pingshan at the sub-basin outlet only feeding Huangbizhuang reservoir. The plain area of the Haihe River basin downstream the nine reservoirs is divided into five additional units based on the watershed delineation method. Further, Beijing and Tianjin make up separate sub-basins in the model. The delineation of the sub-basins is aligned with the official Ministry of Water Resources publications (MWR, 2016), and also with the sub-basins generally referred to, by the Haihe River Commission, as Luanhe (No. 3 in Figure 1), Beisanhe (Nos. 2 and 4), Yongdinghe (No. 5), Daqinghe (Nos. 6 and 16), Ziyahe (Nos. 7 and 8) and Zhangweihe (Nos. 9 and 10). The model also includes the inter-basin connections between Haihe River basins sub-basins, as the channel link between Panjiakou and Yuqiao reservoirs. Each of the total 16 sub-basins has water user demands aggregated into eight categories: Domestic, industry, ecological water demands and the five agricultural user groups of double cropping of wheat and maize, single cropping maize, single cropping wheat, orchards and vegetables. These water user demands are the system sinks, and the sources are the hydrological inflow generated in the mountainous sub-basins, inter-basin water transfers and groundwater abstractions as well as surface water allocations from reservoir storages.
2.1.2 Hydrological data
The hydrological input data consists of estimated water availability from the three main sources of water for Haihe River basin; the mountainous catchment run-off, the inter-basin transfers from neighboring river basins and the groundwater resources within the Haihe River basin. Water availability from these sources is estimated in the following sub-sections.
(1) Catchment run-off
A Budyko rainfall-runoff model framework (Zhang, 2008) was calibrated and validated for three minor sub-basins within Haihe River basin in order to simulate surface water runoff. Daily time series from the gridded meteorological data of China Meteorological Administration (CMA, 2017) were used as forcing of the Budyko model while model performance was evaluated based on historical daily in-situ run-off observations from MWR (2016). The runoff data for the three calibration basins were taken from the hydrological stations Goutaizi (41º35´N, 117º03´E) at Xiaoluanhe in Luanhe River basin, Pingshan (38º15´N, 114º12´E) at Yehe in Ziyahe River basin and Kuangmenkou (36º27´N, 113º47´E) at Qingzhanghe in Zhangweihe River basin, respectively (Figure 2a). A data gap of observed runoff existed in the Pingshan calibration basin, which was excluded from the calibration dataset. Meteorological forcing data consists of daily precipitation as well as mean, maximum and minimum temperature at a 0.5 degree resolution. The data was split into a 20-year calibration period from 1971-1991 and a validation period from 2006-2011. A genetic search algorithm (GA) implemented in MATLAB was used to find best performing model parameters against the historical runoff series, assessed by the Nash-Sutcliffe efficiencies. The resulting parameters from the Budyko rainfall-runoff model calibration can be seen in Table 6.
(2) Inter-basin transfers
The SNWTP eastern and middle routes, as well as the Yellow River, are sources of inter-basin water transfers to Haihe River basin. Yellow River basin transfers are found on the southern fringe of the Haihe River basin, which is bordered by the Yellow River, and via an underground pipe system to the Datong area (Figure 1). Capacities of these inter-basin transfers have been estimated in Table 1. The sum of the three Yellow River transfers is assumed equal to the total yearly Yellow River to Haihe River basin transfers according to Wang et al. (2015). The SNWTP allocations are based on NSBD ( 2016a and 2016b) .
(3) Groundwater resources
The major groundwater systems in the model area are simulated as three individual groundwater reservoirs with monthly allocations to users in the connected sub-basins. Aquifer systems are represented as box-like compartments which can supply users with water allocations. In the two smaller aquifer units of the northern and western mountainous regions, yearly total abstractions are constrained to less than or equal total yearly groundwater recharge. The groundwater recharge to the plain area aquifer, of 120 mm/year is based on literature values from groundwater modeling studies of the plain area aquifer (Kendy et al., 2003; Shu et al., 2012; Cao, 2013). The recharge rates of the two mountain area groundwater units are based on a precipitation-scaled coefficient relating the plain area recharge to precipitation. Based on average yearly precipitation, the precipitation to recharge coefficient was estimated as 0.23. The groundwater recharge areas were based on the extent of quaternary surface geology from the USGS (1990) geological map (Figure1). Estimated recharge areas and recharge rates (Table 2) sum up to 18.5 km3/year of total groundwater recharge, a bit more than estimated by Cao et al. (2013) as plain area groundwater recharge.
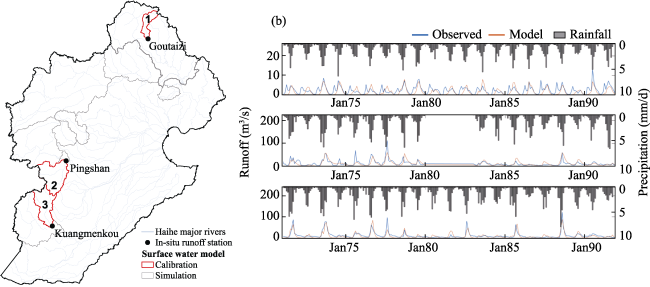
Figure 2 Outline of calibration (red) and simulation (grey) basins of Haihe River basin (black) (a), and rainfall forcing data (grey bars), observed in-situ runoff (blue) and simulated runoff (red) from Budyko model calibration (b)
Table 1 Capacities and yearly allocations of inter-basin transfers from neighboring river basins to Haihe River basin (Wang et al., 2015; NSBD, 2016a; NSBD, 2016b)
SNWTP east SNWTP mid Yellow River east Yellow River mid Yellow River Datong link
Water transfers (M m3/year) 2,000 5,700 1,490 1,490 1,490
2.1.3 Water demands
Water users of the Haihe River basin were aggregated into eight user groups: (1) Domestic, (2) industry, (3) ecological water demands, and agriculture. Agriculture is split to subcatego-ries (4) double cropping of wheat and maize, (5) single cropping maize, (6) single cropping wheat, (7) orchards and (8) vegetables. Estimates of domestic, industrial and ecological water demands are based on water supply statistics from the Chinese Statistical Yearbook (2015d) of Beijing, Tianjin and Hebei provinces. The Landscan 2016 population count (Bright et al., 2017) was used to estimate a population-scaled water demand for these three categories of users in each of the model sub-basins, using the statistics of Hebei province on all sub-basins except Beijing and Tianjin.
Table 2 Recharge areas (USGS, 1990) and rates * (Kendy et al., 2003; Shu et al., 2012; Cao, 2013) of the model’s three groundwater aquifer units
Plain area North mountainous West mountainous
Groundwater reservoir recharge area (M m2) 141,398 6,648 7,673
Recharge rate (mm/year) 120* 92 115
The agricultural groups included in the model altogether cover 90% of the sown area in the region, according to the China Statistical Yearbook (2015a). For the agricultural users, consumptive water demands were estimated using the FAO 56 method (Allen et al., 1998) for determining crop specific water demands based on crop state according to:
$De{{m}_{agr,t}}={{A}_{c}}\cdot (E{{T}_{c,t}}-{{P}_{t}})={{A}_{c}}\cdot (E{{T}_{0,t}}\cdot {{K}_{c,t}}-{{P}_{t}})$ (1)
with Demagr being agricultural water demand for a specific crop, c, covering the area Ac, P is precipitation, ETc is the crop specific potential evapotranspiration, calculated from reference evapotranspiration ET0 and crop type and -stage specific crop coefficient Kc. Index t denotes the specific monthly time step.
Kc values have been estimated based on a literature review of crop coefficients and stages from both simulation models and experimental field data in, or nearby, the model region (Cai et al., 2009; Gao et al., 2009; Liu et al., 1998; Liu and Yi, 2010; Sun et al., 2012; Zhang et al., 2011; Wang et al., 2006). Since vegetables in the model area is a heterogeneous group of crop types (Yang et al., 2010), some cultivated in greenhouses, the water demands of this user category is based on a fixed aggregated monthly water demand of 0.1 m3/m2/year. This estimate is an average obtained from farmer field interviews in the Haihe River basin.
A method based on land use products, official statistics, field trip interviews and literature has been developed to determine crop water demands in the model sub-basins. For a detailed explanation, the reader is referred to the publication by Martinsen (2019). The resulting temporal agricultural water demand for the model sub-basin 13 can be seen in Figure 3. From these temporal estimates the 2011 agricultural demand of this sub-basin is 10,924 M m3. The estimated agricultural water demands align well with the official statistics of total water demands for Hebei province in 2012, which were 14,380 M m3 (CSY, 2011) considering that Hebei province has approximately 40% more cultivated area than the total cultivated area of the model basin 13.
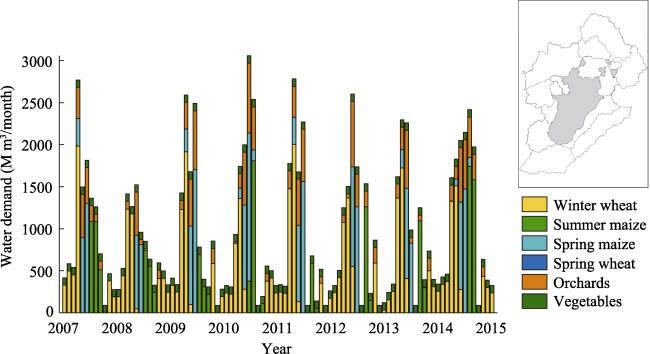
Figure 3 Estimated monthly agricultural water demands for the model sub-basin 13

2.2 Hydroeconomic optimization model

The hydroeconomic optimization model was formulated as one large linear program with 96 time steps (8 years at monthly time steps), with the objective to minimize the total economic costs within the Haihe River basin. The plain area groundwater reservoir storage was successively constrained, spanning from unlimited abstraction possibilities to a sustainable abstraction over the full optimization period. Optimizations with different groundwater abstraction constraints were run assuming perfect foresight of future runoff and groundwater recharge. This assumes stable climatic conditions similar to the historical hydrological dataset. The model was set up using MATLAB 2014a and solved with the MATLAB linear programming solver using a dual-simplex algorithm. The objective was formulated as:
$\text{Min}({f}'\cdot x)$ (2)
with f being the vector of multipliers associated with all elements of the decision vector, x. The decision vector contains quantities of water transferred on each flow path for each time step, deficits for all users at any time step, amounts of groundwater pumped from each aquifer system as well as the plain area groundwater aquifer storage for each time step:
· Flow paths of surface water allocations: FPsw, including RR and RS
· Flow paths of groundwater allocations from each groundwater storage: FPGRSnorth, FPGRSwest, FPGRSplain
· User demand deficits: Def
· Groundwater reservoir storage of the plain area aquifer: GRSplain
All possible water allocations were formulated via flow paths, as described by Cheng et al. (2009), instead of node based water balances. In this way all water sources were linked with all downstream sinks that possibly receive water allocations. An explanation of all decision variable and model parameter abbreviations can be seen in Tables 3 and 4, respectively.
Table 3 List of abbreviations and units for the decision variables of the hydroeconomic optimization model
Abbreviation Explanation Unit
FPSW Flow via any surface water source flow path to a downstream user node [M m3/month]
FPGRSnorth Flow via any North mountainous groundwater aquifer flow path to any connected user node [M m3/month]
FPGRSwest Flow via any West mountainous groundwater aquifer flow path to any connected user node [M m3/month]
FPGRSplain Flow via any plain area groundwater aquifer flow path to any connected user node [M m3/month]
Def Water deficit for any water user node from not having its Dem fulfilled [M m3/month]
GRSplain Groundwater aquifer storage in the plain area aquifer [M m3]
RR Surface water reservoir release - a subset of FPSW [M m3/month]
RS Surface water reservoir storage - a subset of FPSW [M m3/month]
The total number of decision variables in x for each time step is 1,490, and the total decision variable count for the dynamic problem is 143,040. The CPU time required to solve the eleven groundwater scenarios is 59 seconds in a 2 Intel® Core™ i5-7200U processor with 8 GB RAM and Windows 7 operating system.
The multipliers for the surface water flow path decision vector elements (FPsw,1…FPsw,tot) are all set as zero. The multipliers for the demand deficits (Def1…DefU) are the specific cur-tailment costs (cc), presented later in this section. The multiplier for the groundwater flow paths (FPGRS) is the cost of pumping groundwater, cpump.
Table 4 List of abbreviations and units for the parameters of the hydroeconomic optimization model
Abbreviation Explanation Unit
Dem Water demand for any water user node [M m3/month]
cc Curtailment cost for any water user from a water demand deficit [yuan/m3]
cpump Cost of delivering one unit of groundwater [yuan/m3]
I Surface water inflow from either runoff or inter-basin transfer [M m3/month]
Re Groundwater recharge to any given groundwater aquifer unit [M m3/month]
RSvol Maximum storage capacity of any of the nine reservoirs [M m3]
2.2.1 Constraints
The optimization problem is subject to constraints that fall into four categories: User constraints, inflow constraints, time step carry-over constraints and infrastructure constraints.
Demand constraints:
$De{{f}_{i,t}}=De{{m}_{i,t}}-\Sigma _{n=1}^{{{n}_{tot}}}F{{P}_{sw,n,i,t}}-\Sigma _{n=1}^{{{n}_{tot}}}F{{P}_{GRS,n,i,t}}$ (3)
Water availability constraints:
${{I}_{t}}=\sum\limits_{j=1}^{{{j}_{tot}}}{F{{P}_{sw,j,t}}}$ (4)
$\Sigma _{j=1}^{{{j}_{tot}}}\Sigma _{t=1}^{t=12}F{{P}_{GRSnorth,j,t}}\le R{{e}_{GRSnorth,yearly}}$ (5)
$\Sigma _{j=1}^{{{j}_{tot}}}\Sigma _{t=1}^{t=12}F{{P}_{GRSwest,j,t}}\le R{{e}_{GRSwest,yearly}}$ (6)
Infrastructure constraints:
$R{{S}_{t}}\le R{{S}_{vol}}$ (7)
Time step carry-over constraints:
$R{{R}_{t}}=R{{S}_{t-1}}+\Sigma _{n=1}^{{{n}_{tot}}}F{{P}_{sw,n,t}}-\Sigma _{j=1}^{{{j}_{tot}}}F{{P}_{sw,j,t}}$ (8)
$GRSplai{{n}_{t}}=GRSplai{{n}_{t-1}}-\Sigma _{j=1}^{{{j}_{tot}}}F{{P}_{GRSplain,j,t}}+R{{e}_{GRSplain,t}}$ (9)
where sw denotes surface water, gw groundwater, i user, t time, ts total number of time steps, n upstream flow paths, j downstream flow paths, and U total number of users.
2.2.2 Constraining method
The model was optimized under the constraining method for the major groundwater unit of the model, the plain area aquifer. Yearly allocations from the two minor mountainous groundwater aquifers were subject to hard constraints less than or equal to their yearly recharges. Abstractions from the mountainous aquifers were therefore constrained to sustainable levels, on a yearly basis, throughout all scenarios.
The constraining method applied to the plain aquifer was implemented by setting increasingly tight end conditions, GRSplain,tend, for the groundwater aquifer time-step carryover equality constraints in Equation (9). The plain aquifer groundwater storage of the last time step, GRSplain,tend, set to zero, expresses the sustainable abstraction scenario. Here the sum of all flow paths allocated from the groundwater aquifer equals the total recharge to the aquifer over the full optimization period.
The end condition of GRSplain,tend, were determined from a model run with an unconstrained plain area groundwater aquifer end storage allowing this groundwater source to cover all possible water user deficits. The groundwater aquifer end-storage from the unconstrained optimization represents the business-as-usual 100% overdraft, where deficits are covered by groundwater abstractions. From here on results are presented from the 11 scenarios (100%, 90%, 80%, 70%, 60%, 50%, 40%, 30%, 20%, 10%, 0%) ranging from the unlimited overdraft scenario, called 100% overdraft, to the sustainable abstraction scenario, called 0% overdraft.
2.2.3 Shadow prices
For each formulated constraint of the linear program an associated Lagrange multiplier to the optimal solution exists. Lagrange multipliers are often referred to as shadow prices. These shadow prices are the marginal change of the objective resulting from a marginal change in the constraint. These shadow prices therefore represent the change in total cost for the whole Haihe River basin from relaxing for example the constraint on available runoff or inter-basin transfer. From here on these Lagrange multipliers are referred to as shadow prices.

2.3 Economic input data

As the objective of the optimization model is to minimize total costs, the economic input data set is a key input for identifying optimal solutions, within the constraints of the model set-up. As explained in the section on the hydroeconomic model set-up, the vector of multipliers, f, consist of two categories of economic data; Costs of not fulfilling users’ water demands, referred to as curtailment costs, and costs of supplying groundwater. Surface water allocation is assumed to carry no costs. The curtailment costs can be determined by various means, and is an ongoing subject for discussion among resources economists. Methods such as residual imputation can be used for determining value of water in agriculture and industries. Residual imputation techniques determines the value added to the output from any production inputs per unit water use in the production process (Young, 2005). The input-output based methods Computational General Equilibrium Models (CGEM) is a more comprehensive method for determining values of water in a system of users with non-linear simultaneous equations (Young, 2005). An inductive method for estimating users’ willingness to pay (WTP) is to simply observe users’ current water prices. China has developed its own standard to determine economic water values, referred to as the benefit sharing coefficient method (Gan et al., 2008; Li et al., 2008).
2.3.1 Curtailment costs
Spatially distributed water prices of domestic uses and industries per 1st of January 2017 have been used as curtailment costs for any water deficit among the domestic and industrial users (H2O, 2017).
The agricultural curtailment costs are from a Chinese study estimating water values in Haihe River basin based on the benefit sharing coefficient method (Gan et al., 2008). The water values are estimated for the regions of Beijing, Handan, Tangshan, Anyang, Xinxiang, Shuozhou, Changzhi and Dezhou within Haihe River basin, and have been extrapolated to the nearest sub-basins in the model. All spatially distributed curtailment costs can be seen in Table 5. The environmental water value is set to 1.5 yuan/m3 in all sub-basins (WB, 2001).
Table 5 Curtailment costs of water demands for each of the 16 model sub-basins, seen in Figure 1
Sub-basin Curtailment cost 1 2 3 4 5 6 7 8 9 10 11 12 13 14 15 16
Low value crops1) 1.8 1 1.3 1.3 1.6 1.6 1.2 1.2 1.6 1.2 1 1.8 3.3 1.3 1 1.6
High value crops1) 13.6 7.4 12.3 12.3 24.7 24.7 39.2 39.2 14.95 39.2 7.4 13.6 14.2 12.3 7.4 24.7
Domestic2) 2 2.7 2.7 2.7 2.6 2.3 2.3 2.5 2.1 2.6 5 4 3.2 3.5 4.9 2.3
Industry2) 2.4 5.6 5.6 5.6 4.2 3.1 3.1 3.9 2.8 4.8 9.9 6.3 4.7 5.9 7.9 3.1
Ecological3) 1.5 1.5 1.5 1.5 1.5 1.5 1.5 1.5 1.5 1.5 1.5 1.5 1.5 1.5 1.5 1.5

Data sources: 1) Gan et al. (2008), 2) H2O (2017), 3) WB (2001)

2.3.2 The cost of groundwater
The cost of groundwater is fixed at a constant pumping cost, not dependent on water table height and other aquifer properties. This ensures linearity of the optimization problem, and is a valid assumption given that each individual groundwater aquifer of the model is represented as one single unit. The actual price is determined based on pumping costs given a certain pump efficiency, groundwater depth and electricity price. The groundwater pumping cost of this study is based on the pumping cost of 0.4 yuan/m3, applied in the study of water resources management in the Haihe River sub-basin, i.e., Ziyahe River basin by Davidsen et al. (2015b).

3 Results

3.1 Budyko modeling of catchment runoff

Results from the Budyko rainfall-runoff model calibration can be seen in Table 6.
Table 6 Budyko model calibration results and associated Nash-Sutcliffe efficiency
Calibration basin Budyko parameters Nash-Sutcliffe efficiency
α1 α2 d Smax K
Goutaizi 0.33 0.95 0.89 1012 29 0.11
Pingshan 0.52 0.85 0.0029 75 61 0.43
Kuangmenkou 0.37 0.56 0.99 995 22 0.66
Goutaizi and Kuangmenkou calibration parameters have been applied to Panjiakou and Yuecheng sub-basins, respectively. The model parameters of Pingshan calibration sub-basin performed best in the proxy- basin validation, and have been applied to the remaining sub-basin for runoff simulations. Simulations have been done for an eight year period using forcing data from 2007-2014. The resulting sub-basin surface water runoff can be seen in Figure 4.
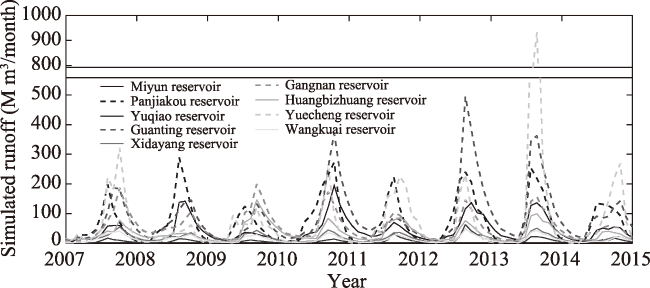
Figure 4 Runoff time series from all nine mountainous sub-basins in Haihe River basin upstream the nine model reservoirs, simulated with a calibrated Budyko rainfall-runoff model using meteorological forcing data from 2007 to 2014

3.2 Groundwater aquifer storage

The plain aquifer groundwater storage compartment of the model is subject to changing end-storage constraints under eleven different groundwater abstraction scenarios. The temporal changes in storage of the plain groundwater aquifer can be seen in Figure 5. The two blue lines represent the two extremes of unconstrained groundwater abstraction, i.e., 100% overdraft scenario (dotted blue line) and a scenario of groundwater abstraction limited to the total groundwater recharge, i.e., 0% overdraft scenario (solid blue line). A total groundwater overdraft over the full optimization period of 80.6 km3 is observed in the unconstrained scenario. The resulting overdraft is compared to a recent study by Feng et al. (2013) of groundwater depletion in North China Plain based on NASA’s Gravity Recovery and Climate Experiment (GRACE) satellite data. Assuming a yearly storage depletion of 5 cm/year, as can be estimated from Feng et al. (2013), this scales up to a total overdraft of 56.6 km3 during an eight year period of the plain area groundwater compartment, indicated by the blue triangle in Figure 5. Compared to GRACE observation estimates the business-as-usual overdraft from the optimization model is more severe. As the study by Feng et al. (2013) is based on an averaged five year overdraft rate over the much greater area of NCP, the unconstrained groundwater overdraft of the plain area from the optimization model, covering a smaller and generally more intensively cultivated area, is judged to be realistic.
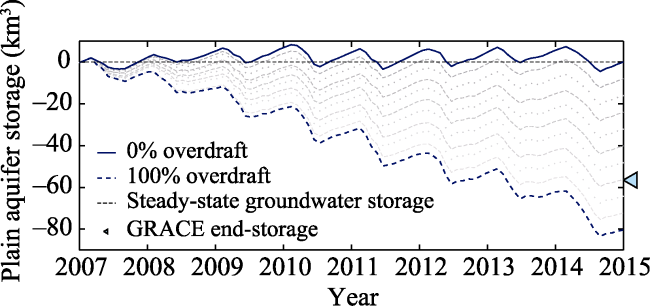
Figure 5 Temporal groundwater storage of the plain area groundwater aquifer during the eight-year optimization period for the 11 model scenarios, from unlimited overdraft to sustainable groundwater abstractions

3.3 Average shadow prices of surface water sources

The solution of the LP includes shadow prices of all water sources within Haihe River basin. The effect of constraining groundwater abstraction from the plain area aquifer can be witnessed in the temporal averages of shadow prices of the surface water sources in the Haihe River sub-basins, as shown in Figure 6. The higher the average shadow price of a water source is, the more an additional unit of available water from this source could reduce the total cost associated with water use in Haihe River basin. A high shadow price therefore reflects the possibility to relieve water demand deficits of high-valued users.
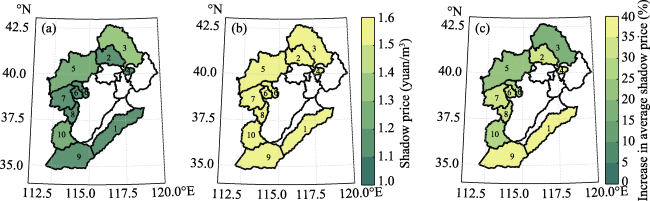
Figure 6 Average shadow prices (yuan/m3) of surface water sources from the sub-basins in Haihe River basin (a. the unconstrained; b. the sustainable groundwater abstraction scenario; c. percentage increase in average shadow prices from constraining groundwater abstraction to a sustainable level)
Average shadow prices under the unlimited groundwater abstraction scenario can be seen in Figure 6a. Spatial variations are seen among the sub-basins, revealing that the surface water resources in Panjiakou (No. 3) sub-basin are relatively most valuable. The surface water sources upstream Panjiakou reservoir serves the upstream users and the downstream Plain north (No. 14) and Tianjin sub-basins (No. 15). It can also be noticed that the incoming water sources from the inter-basin transfers have relative low shadow prices. The SNWTP and Yellow River inter-basin transfers are represented by the shadow prices found in the two most southern sub-basins (Nos. 1 and 9). Gradually constraining the groundwater abstraction, as illustrated in Figure 5, has an effect on the shadow prices. Reaching a sustainable level of groundwater abstraction, and thereby limiting available water resources, increases shadow prices of all surface water sources to 1.6 yuan/m3 (Figure 6b). Under an optimally managed scenario, a sustainable level of groundwater use would cause curtailment of all users groups with a curtailment cost up to 1.6 yuan/m3 if the most cost efficient use of water would be applied. The water resource deficit occurring from limiting groundwater abstractions to sustainable levels could potentially be recovered solely from curtailing these low-valued agricultural users and the ecological water demands around the Haihe River sub-basins. The sub-basins experiencing the biggest effect from constraining groundwater abstractions to a sustainable level can be identified from Figure 6c. This figure shows the percentage increase in average shadow prices of surface water sources from reaching a sustainable level of groundwater abstraction. The most significant impact of constraining groundwater overdraft can be seen in the sub-basins upstream Yuqiao reservoir (No. 4), as well as on the southern border of the Haihe River basin, reflecting the inter-basins transfers from the SNWTP and the Yellow River with increases in average shadow prices of 37.5%. This reflects a greater need for surface water transfers from Yellow River and SNWTP. The interactions between high-valued downstream users, their water demands, limited groundwater access and water infrastructure makes these water sources especially affected by a more sustainable plain area groundwater abstraction. The sub-basin of Panjiakou reservoir does not experience a significant increase since it was already experiencing high-value downstream deficits under the unconstrained groundwater abstraction scenario (Figure 6a).

3.4 Temporal variation of surface water availability shadow prices

The temporal variations in surface water shadow prices reflect where and when additional water sources could reduce total costs. The examples of temporal shadow prices are from the sub-basins highlighted in Figure 7c. From Figure 7a the temporal dynamics of surface water shadow prices in the sub-basin upstream Wangkuai reservoir (No. 6) for three groundwater overdraft scenarios 0%, 50% and 100%, can be found (blue). For comparison, the shadow prices of west mountainous groundwater resources are also shown for the three overdraft scenarios (grey). As can be seen, the groundwater shadow prices are constant in time.
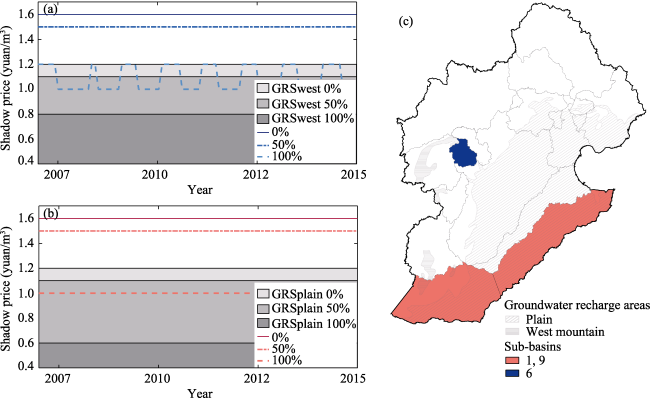
Figure 7 Temporal shadow prices of (a) surface water sources upstream Wangkuai reservoir and the West mountainous groundwater aquifer; (b) the inter-basin transfers from SNWTP and Yellow River and the plain area groundwater aquifer; (c) the geographic location of the sub-basins and groundwater aquifers
As the overdraft decreases to 0% both surface water and groundwater shadow prices increases. From the 100% overdraft scenario (dotted line), it can be seen how the Wangkuai surface water sources varies in time. In the months with highest agricultural water demands, the shadow price increases. These periods reflects increased deficit of water resources under the given constraints, even under optimally managed scenario with unlimited groundwater abstraction of the plain aquifer. In these periods of increased deficit, an additional unit of surface water upstream Wangkuai reservoir could avoid a cost of 1.2 yuan in any of the sub-basins sharing the same water resources. The solid line in Figure 7a represents a scenario with sustainable groundwater abstractions, which results in constant deficit among the higher low-value crop agricultural users. In any case the shadow price of surface water exceeds the shadow price of groundwater, since it is assumed to carry no cost. If the cost of pumping groundwater is disregarded, the Wangkuai surface water shadow price drops below the groundwater aquifer shadow price in the 100% overdraft scenario. This shows that an additional unit of available yearly recharge to the West mountainous groundwater resources would generate more value in another of the connected sub-basins during these periods.
The shadow prices of inter-basin transfers represent the cost reduction per unit of additional water transferred to Haihe River basin. This however, does not consider any economic effects it might have on the neighboring sub-basins from which it is abstracted. As can be seen in Figure 7b the shadow price of the inter-basin transfers also increases from constraining groundwater overdraft. The constant temporal shadow prices express a constant down- stream deficit. Compared to the West mountainous aquifer, the plain area groundwater resources have lower shadow prices under the 100% overdraft scenario. This reflects the relatively higher value of mountainous groundwater sources, if unlimited overdraft from the plain area aquifer is allowed. Both Wangkuai surface water sources and the sub-basins 1 and 9 inter-basin transfers have a constant shadow price of 1.5 yuan/m3 in the 50% overdraft scenario. In this overdraft scenario, the highest valued curtailed user in Haihe River basin is the ecological water demand. Until this stage, half-way to sustainable groundwater abstractions, the low valued agricultural users are curtailed before the ecological demands. The most cost efficient water demand curtailments, as a consequence of reaching sustainable groundwater abstraction, can be seen in all temporal plots of surface water shadow prices.

3.5 Shadow prices of water infrastructure constraints

The shadow prices of surface water reservoir storage capacity constraints of the model have also been examined. They are zero at any time during all groundwater abstraction scenarios. Haihe River basin will therefore not be able to save any costs from expanding the existing reservoir storages of these nine major reservoirs, given that the water resources are managed in the most optimal way.
Surface water shadow prices upstream Wangkuai reservoir (dotted blue line in upper Figure 7a) under the 100% overdraft scenario varies in time. The peaks occur during spring, where agricultural water demands are peaking. From these temporal peaks of increased surface water marginal values it is seen how users could benefit from having additional upstream surface water storage. This trend can be observed in all mountainous sub-basins with groundwater abstraction from the two smaller mountainous groundwater aquifer units. As Haihe River basin has an extensive network of surface water storage reservoirs (Ding et al., 2015) minor surface water storages do exist in all of the sub-basins. Under optimally managed conditions, these shadow prices therefore reflect an upper limit to surface water shadow prices, as fewer deficits are expected as a result of these smaller upstream surface water storages which are not simulated in the present model setup.

3.6 Economic costs associated with achieving sustainable groundwater abstraction

There is a significant increase in the surface water sources’ shadow prices throughout Haihe River basin going from unlimited groundwater overdraft to sustainable groundwater abstractions. This reveals a substantial economic cost associated with achieving sustainable groundwater abstractions. The total economic cost from water demand deficits under unlimited groundwater abstractions sums up to an average of 14.5 billion yuan/year over an eight-year planning horizon. Reaching a sustainable level of groundwater abstraction increases the economic costs associated with water demands deficits to an average of 22.7 billion yuan/year. The cost of achieving sustainable groundwater abstraction is therefore 8.2 billion yuan/year. The economic trade-off per m3 of limited groundwater overdraft is the difference in total cost estimates relative to the relieved groundwater overdraft. This trade-off represents the economic costs that could have been avoided from every saved unit of groundwater overdraft, assuming water is allocated in the most economical way. In Haihe River basin, the low-value agricultural users have the highest total water demand and the lowest economic value of their water use. The most cost-efficient way of reaching sustainable groundwater abstractions would therefore be to achieve water savings among these users. In Figure 8, the pareto front of the minimum possible costs associated by any groundwater overdraft scenario can be seen. The bends on the pareto front shows how the economic trade-off from saving and additional unit of groundwater increases under more and more sustainable groundwater abstraction scenarios (dotted lines). The economic trade-offs are represented by the slopes (dotted lines) going from one overdraft scenario to the next and more sustainable. These range from 0.6 yuan/m3 between the 100% and 90% overdraft scenario to 1.2 yuan/m3 between the 10% and 0% overdraft scenario. Limiting an additional unit of groundwater overdraft becomes more and more costly approaching a sustainable scenario.
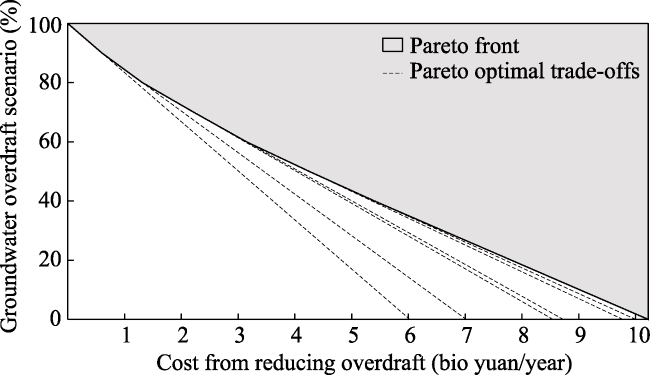
Figure 8 Pareto front of all eleven groundwater overdraft scenarios from 100% to 0% overdraft

3.7 Allocation patterns

The flow path formulation of the model decision variables gives an insight to every single water allocation for any optimal solution. Based on the flow path decision variables each water delivery from source to sink can be tracked. Changes in optimal water allocation schemes can be seen from Figure 9. A comparison of water allocations from SNWTP mid line (left) and composition of water sources for Beijing (right) in the sustainable groundwater abstraction scenario versus the unlimited overdraft scenario is illustrated. Figure 9a shows each receiving sub-basin of SNWTP mid line water allocations, and the sub-basins fraction of the total SNWTP water resources under the 0% overdraft scenario (upper fraction) and under 100% overdraft scenario (lower fraction). These spatial fractions of SNWTP mid line allocations represent optimal allocations, only considering end users’ value of water and not considering the SNWTP water price. The optimal allocation is seen to change between the scenarios. The same change in optimal water allocations is seen in Figure 9b, where new compositions of different water sources are allocated to Beijing. This kind of insight into optimal allocations of different water sources can be used for further exploration of various water management scenarios and the effect of different pricing schemes of individual water sources.
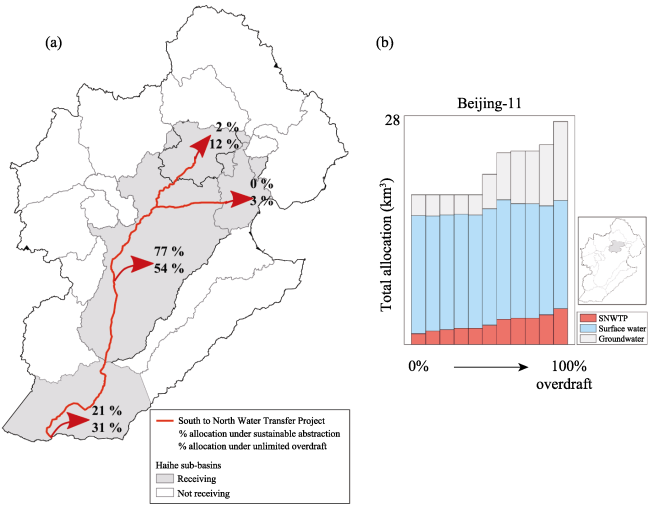
Figure 9 Fractions of SNWTP mid line water resources allocations (a), and source specific absolute water allocations to Beijing (No.11) (b)

3.8 Model sensitivity

It is challenging to validate results from hydroeconomic optimization modeling. Therefore,the model results have been subject to a sensitivity analysis, expressing the uncertainty based on the most sensitive input data. Four model outputs have been subject to sensitivity analysis:
1. Average shadow prices of surface water sources in the 0% overdraft scenario
2. Average shadow prices of surface water sources in the 100% overdraft scenario
3. Total cost
4. Plain aquifer end storage in the 100% overdraft scenario
The resulting impact on model results from ±10% variations of various model input data can be seen in Figure 10.
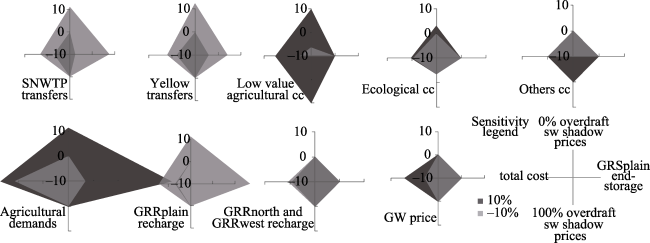
Figure 10 Sensitivity analysis of four model output responses to a ±10% variation of various model input data
From the sensitivity analysis relative impacts on model results from various input parameters can be seen. The most sensitive parameters can be seen to be the SNWTP inter- basin transfers, the low valued agricultural curtailment costs and demands, as well as the plain area aquifer recharge, GRRplain. The SNWTP transfers especially affect GRSplain end storage and the surface water shadow prices in the 0% overdraft scenario, as it affects total water availability in the basin. The sensitivity of curtailment costs towards the shadow prices shows which user groups are on the verge of being curtailed or not with the available water resources. As the agricultural users curtailment costs are generally the lowest, the surface water shadow prices are sensitive towards their relative changes. Compared to the higher-value users’ curtailment costs, the only effect is seen on the 100% overdraft surface water shadow prices, when curtailment costs of the rest of the users are decreased 10%.

4 Discussion

4.1 Choice of hydroeconomic modelling framework

The model is formulated as one big linear multi-temporal deterministic optimization problem. In contrast to methods as SDP and SDDP which can be developed for reservoir operation, this model-setup assumes perfect foresight similar to recent historical climate; this limits its application to planning applications. In contrast, the model formulation is very flexible, allowing numerous flow paths as decision variables, and a high level of spatial resolution for multi-reservoir system planning. The curse of dimensionality of state variables, which limits model complexity in methods such as SDP and SDDP is not a limiting factor for the linear multi-temporal deterministic optimization problem. As an initial planning tool the model framework presented in the paper is a promising basis for developing even more model complexity.
Results of source to sink allocations in different groundwater abstraction scenarios show one of the benefits of applying the flow path formulation to the model set-up. Even though the model is not fit for operational optimization, given the deterministic nature of the model set-up, the flow paths show changes in optimal allocation schemes under different scenarios. The model results represent optimal allocation, and not simulation of present water allocations. Differences between actual allocations and the optimal allocations schemes from the model optimizations indicates that new and more cost-efficient water source allocations can be identified within the system constraints.

4.2 Uncertainty of available water resource

The optimization model planning period of eight years is based on historical meteorological data and runoff from 2007-2014. The model average values of shadow prices and total costs captures meteorological variations seen in this specific historical input data period. If a longer historical dataset had been available the planning period could have been extended and an even broader range of climate variability could be represented in the model results. Considering the insignificant computation time of the ~140,000 decision variable LP problem, extending the planning period will not be a computational challenge. As Haihe River basin is experiencing climatic changes input forcing data could have been modified to future climate predictions.
Extending the model application to operational decision support would make it necessary to represent inflow uncertainties. Operational control methods have long been an alternative for considering stochastic inflow (Bras et al., 1983). An operation control methodology can be wrapped around an optimization model framework to ensure adaptive system operation (Labadie, 2004). Extending the multi-temporal deterministic LP problem with such an operational control methodology could enable both spatially detailed and flexible model set-up, also adaptable to inflow uncertainties.
Operational control methods would result in near-optimal solutions of water allocations. The results presented in this study only deals with one optimal model solution. The problem is not sufficiently confined to provide a single unique optimal solution. In addition to multiple optimal solutions a range of near-optimal solutions also exists as discussed by Liu et al. (2011) and Rosenberg (2015). This wide spectrum of equally optimal or near-optimal solutions becomes important under operational optimization. Under the scope of this study, of exploring the groundwater abstraction scenarios, model uniqueness is no longer as important. All optimal solutions will result in the same total costs, shadow prices and economic trade-offs. The methodology applied in this study is therefore appropriate for evaluating the economic trade-offs and relative cost in-between scenarios.

4.3 Demand for input data

The high spatial resolution of the model has led to a need for high level of input data resolution. In the methods section, this data is estimated from available statistics, remote sensing products as well as field verifications. Most data used for the model has been publicly available. In the hands of relevant decision maker, with the right access to necessary data, the model results can become even more realistic, reliable and useful for the relevant water resource planning. Improved knowledge on water infrastructure capacities, such as various channel systems, could help identify any infrastructure bottlenecks.
The sensitivity analysis shows from which input data the greatest uncertainty to the model results origin. The uncertainty of the model results can be evaluated based on the uncertainty of the most sensitive input data. As seen in the results of the sensitivity analysis the parameters of economic values and water demands of the agricultural users are the most influential input data on the model sensitivity. The economic data set of the agricultural users in this study comes from a Chinese study on water values using the benefit coefficient sharing method in Haihe River basin (Gan et al., 2008). The economic values give an estimate of the total cost related to water resources. Economic value always depends on the assumptions made, what is considered exogenously and endogenously given. The value of displacements or re-schooling of farmers, not being allocated water for irrigation is for example not considered. Economic costs and curtailment costs of this study should therefore merely be viewed as relative indicators. As to say, how much more cost will there occur from achieving sustainable groundwater abstractions. What is the economic trade-off, and where in the system are the relatively high values of water occurring when groundwater is abstracted to a sustainable degree. Applying a more area specific and spatially higher resolved economic data set would enable even more exact measures of economic costs from water curtailment.

4.4 Implications of models results

The water sources of Haihe River basin cannot satisfy the massive and increasing water user demands within the region. If demands cannot be lowered, water managers are faced with a dilemma: Demands must be curtailed, inter-basin transfer must be increased or the groundwater resources of the region must be further depleted. As none of these scenarios are desirable, the fourth, and less dramatic alternative, is to identify the most optimal water management strategy in order to reach more sustainable water use. When water is a scarce resource this is a trade-off between environmental, social and economic objectives. The model results of this study help quantify and identify relative trade-off between two of these objectives, the economic and the environmental consequences of groundwater overdraft. The difference in economic cost of any of the scenarios provides a relative measure of the water associated economic impacts of implementing constrained groundwater abstraction.
The model results show the economic trade-off from achieving sustainable groundwater abstraction. How to actually reach the sustainable level of groundwater abstraction is a question of institutional design. Should it be reached by curtailing water demands among the users with the lowest curtailment cost through permits? Should investments be made in strategic water saving techniques? Or should it be achieved through market mechanisms as increased water prices? Any choice of institutional design can further be explored by this kind of model framework, and economic trade-offs from different policies can be identified. A model set-up as in this study is a basis for further decision making. As can be seen from the results, no costs can be saved from expanding the capacity of existing surface water reservoirs represented in the model.
The model results show the shadow prices of water sources under the most cost-efficient water management. For water managers, cost-efficiency is not the sole objective of the management strategies. Social stability, environmental concerns and other political agendas must also be considered. One thing that becomes clear from the model results of this study is though that water managers cannot meet the goal of sustainable groundwater abstractions with present water user demands and available water resources. The major demands exist among the low value crop agricultural users, and since the whole of China is dependent on the agricultural output of this region it is not realistic to simply curtail the agricultural users. Scenarios with local storage solutions or efficient water saving techniques among these low value users is likely to be the way forward to avoid substantial loss of agricultural yield under more sustainable groundwater abstractions, and can be further explored in the model set-up.

4.5 Further model development

This study shows how important managing the agricultural users’ water demand is for the water resources of the whole Haihe River basin. Attention on a detailed representation of these users is therefore essential in order to improve model results for decision support in this region. As this model does not consider sunk-costs of water allocations in agriculture and yield-dependent curtailment costs, this is an obvious next step for model development, and will pursued in future studies. The study revels economic trade-offs and spatio-temporal aspects of optimal water management for planning aspects. In order to move into operational management on month-to-month decisions, the model framework must be developed and adapted to consider the uncertainty of available water resources.

5 Conclusions

5.1 Model framework

The multi-temporal, multi-reservoir deterministic LP hydroeconomic optimization model is a computationally efficient and flexible tool for scenario analysis of water resources management problems and decision support. The model developed in this study is a valuable starting point for further scenario analysis, and can serve as a basis for use in an operational modeling framework or flow path based decision support. The higher spatial resolution of the model, compared to what is possible with a DP model framework, has enabled valuable insight in the spatio-temporal shadow prices of the Haihe River basin water sources.

5.2 Economic efficient and sustainable water resource allocations

Expanding surface water reservoir capacities cannot limit costs occurring from reaching sustainable groundwater abstractions. The solutions must therefore be found in lowering demands or increasing available water resources. In the sustainable groundwater abstraction scenario all surface water inflow shadow prices increase to 1.6 yuan/m3. The groundwater overdraft can therefore be ended by solely curtailing the low valued agricultural users and the environmental water demands. As this is not a feasible option, water savings in these demand categories should be encouraged, and water saving scenarios could be further explored using the model framework. From the eight-year planning period the cost of ending groundwater overdraft is 8.2 billion yuan/year. This estimate is a lower limit, assuming that costs would occur from curtailing the low-value crop agricultural users, such as winter wheat. Reaching sustainable groundwater abstractions will inevitable be more costly, but probably not less. Decreasing groundwater abstraction will result in new optimal allocation schemes. Insight into new optimal water resource allocations can be beneficial for adaptive water resource management. Economic trade-offs going from unlimited overdraft to a sustainable groundwater abstraction scenario, gradually increase from 0.6 to 1.2 yuan per cubic meter limited groundwater overdraft. The model result also shows how the average shadow prices of SNWTP and Yellow River sources increase by 37.5% when limiting groundwater abstractions to sustainable levels. Haihe River basin will therefore be even more dependent on inter-basin transfers as SNWTP and Yellow River if sustainable groundwater abstractions should be achieved.

5.3 Future model improvements

As already mentioned during the discussion of the data a lot of insight could be gained from further development of the model framework. A more detailed and spatially resolved data set for water demands and economic values among the agricultural users could give a better insight of the costs and curtailments in the agricultural sector from sustainable groundwater abstraction. Moving into a modeling framework representing inflow uncertainties would enable decision support under stochastic future inflow and agricultural water demand.

The authors have declared that no competing interests exist.

[1]
Allen R G, Pereira L S, Raes Det al., 1998. Crop Evapotranspiration: Guidelines for Computing Crop Requirements. Irrigation and Drainage Paper No.56, FAO, (56): 300.

[2]
Bras R L, Buchanan R, Curry K C, 1983. Real time adaptive closed loop control of reservoirs with the High Aswan Dam as a case study.Water Resources Research, 19(1): 33-52.

DOI

[3]
Bright E A, Rose A N, Urban M L et al., 2017. lspop2016. Landscan 2016. Oak Ridge, TN: Oak Ridge National Laboratory SE - July 1, 2017. .

[4]
Cai J B, Liu Y, Xu Det al., 2009. Simulation of the soil water balance of wheat using daily weather forecast messages to estimate the reference evapotranspiration.Hydrology and Earth System Sciences, 13(7): 1045-1059.

DOI

[5]
Cai X, McKinney D C, Lasdon L S, 2001. Solving Nonlinear Water Management Models Using a Combined Genetic Algorithm and Linear Programming Approach.Advances in Water Resources, 24(6): 667-876.

DOI

[6]
Central Committee of the Communist Party of China (CPC), 2016. The 13th Five-Year Plan for Economic and Social Development of the People’s Republic of China, viewed 13/02/2018. .

[7]
Chen M, Tomás R, Li Zet al., 2016. Imaging land subsidence induced by groundwater extraction in Beijing (China) using satellite radar interferometry.Remote Sensing, 8(6): 468-488.

DOI

[8]
Cheng W-C, Hsu N-S, Cheng W-Met al., 2009. A flow path model for regional water distribution optimization. Water Resources Research, 45(9). doi: 10.1029/2009WR007826.

[9]
China Meteorological Administration (CMA), 2017. Dataset of daily climate data from Chinese surface stations for global exchange (V3.0), viewed 03/02/2017. .

[10]
China Statistical Yearbook (CSY), 2011. China Statistical Yearbook - Water supply and water use, viewed 17/02/2016. .

[11]
China Statistical Yearbook, 2015a. China Statistical Yearbook - Table of Sown Area of Farm Crops, viewed 17/02/2016.

[12]
China Statistical Yearbook, 2015b. China Statistical Yearbook - Main indicators of state-owned and state-holding industrial enterprises by region, viewed 17/02/2016.

[13]
China Statistical Yearbook, 2015c. China Statistical Yearbook - Main indicators of private industrial enterprises by region, viewed 17/02/2016.

[14]
China Statistical Yearbook, 2015d. China Statistical Yearbook - Water supply and water use, viewed 17/02/2016.

[15]
Davidsen C, Liu S, Mo Xet al., 2015a. Hydroeconomic optimization of reservoir management under downstream water quality constraints.Journal of Hydrology, 529: 1679-1689.

DOI

[16]
Davidsen C, Liu S, Mo Xet al., 2016. The cost of ending groundwater overdraft on the North China Plain.Hydrology and Earth System Sciences, 20(2):771-785.

DOI

[17]
Davidsen C, Pereira-Cardenal S J, Liu Set al., 2015b. Using stochastic dynamic programming to support water resources management in the Ziya River Basin, China. Journal of Water Resources Planning and Management, 141(7). doi: 10.1061/(ASCE)WR.1943-5452.0000482.

[18]
Ding Y, Shan B, Zhao Y, 2015. Assessment of river habitat quality in the Hai River Basin, northern China.International Journal of Environmental Research and Public Health, 12(9): 11699-11717.

DOI

[19]
Feng W, Min Z, Lemoine J-Met al., 2013. Evaluation of groundwater depletion in North China using the Gravity Recovery and Climate Experiment (GRACE) data and ground-based measurements.Water Resources Research, 49: 2110-2118.

DOI

[20]
Fu Q, Zhao K, Liu Det al., 2016. The application of a water rights trading model based on two-stage interval-parameter stochastic programming.Water Resources Management, 30(7): 2227-2243.

DOI

[21]
Gan H, Wang L, Ni H-Zet al., 2008. Assessment on methods for calculating economic value of Water.Journal of Hydraulic Engineering, 39(11): 1160-1166. (in Chinese)

[22]
Gao Y, Duan A, Sun Jet al., 2009. Crop coefficient and water-use efficiency of winter wheat/spring maize strip intercropping.Field Crops Research, 111(1/2): 65-73.

DOI

[23]
Government of the People’s Republic of China (GOV PRC), 2015. Water Ten Plan, viewed 31/10/2017. Water Ten Plan, viewed 31/10/2017. . (in Chinese)

[24]
Guan D, Hubacek K, 2008. A new and integrated hydro-economic accounting and analytical framework for water resources: A case study for North China.Journal of Environmental Management, 88: 1300-1313.

[25]
H2O China, 2017. H2O China Water Prices, viewed 31/10/2017. . (in Chinese)

[26]
Harou J J, Pulido-Velazque M, Rosenberg D Eet al., 2009. Hydro-economic models: Concepts, design, applications and future prospects.Journal of Hydrology, 375: 627-643.

DOI

[27]
Hong S, Jun X, Junxu Cet al., 2017. Multi-object approach and its application to adaptive water management under climate change.Journal of Geographical Sciences, 27(3): 259-274.

DOI

[28]
Labadie J W, 2004. Optimal operation of multireservoir systems: State-of-the-art review.Journal of Water Resources Planning and Management, 130(2): 93-111.

DOI

[29]
Lehner B, Liermann, C R, Revenga Cet al., 2011. High resolution mapping of the world’s reservoirs and dams for sustainable river flow management. Frontiers in Ecology and the Environment, 9(9). doi: 10.1890/100125.

[30]
Li L X, Gan H, Wang Let al., 2008. Calculation and analysis of the economic value of water resource.Journal of Natural Resources, 23(3): 494-499. (in Chinese)

[31]
Li X Y, Li F F, Qiu J, 2017. A new evaluation for water transfer optimal schemes with the consideration of reliability, stability, and severity.Water Resources Management, 31: 2823-2836.

DOI

[32]
Liu J, Zheng C, Zheng Let al., 2008. Ground water sustainability: Methodology and application to the North China Plain.Ground Water, 46(6):897-909.

[33]
Liu P, Cai X, Guo S, 2011. Deriving multiple near-optimal solutions to deterministic reservoir operation problems. Water Resources Research, 47(8). doi: 10.1029/2011WR010998.

[34]
Liu S, Mo X, Lin Zet al., 2010. Crop yield responses to climate change in the Huang-Huai-Hai Plain of China.Agricultural Water Management, 97(8): 1195-1209.

DOI

[35]
Liu Y, Teixeira J L, Zhang H Jet al., 1998. Model validation and crop coefficients for irrigation scheduling in the North China Plain.Agricultural Water Management, 36: 233-246.

DOI

[36]
Liu Y, Yi L, 2010. A consolidated evaluation of the FAO-56 dual crop coefficient approach using the lysimeter data in the North China Plain.Agricultural Water Management, 97: 31-40.

DOI

[37]
Loucks D P, van Beek E, Stedinger J Ret al., 2005. Water Resources Systems Planning and Management: An Introduction to Methods, Models and Applications. UNESCO Publishing.

[38]
Martinsen G, 2019. Hydroeconomic evaluation of projects and policies in the water-scarce and polluted Haihe River Basin, China [D]. Kgs. Lyngby, Denmark: Technical University of Denmark.

[39]
Ministry of Agriculture (MA), 2010. No. 1 Central Document for 2011, viewed 31/10/2017. .

[40]
Ministry of Water Resources (MWR), 2016. Hydrological data of Haihe River basin, data books with daily discharge data. Annual Hydrological Report, 1971-2014, Beijing, China.

[41]
Mo X, Chen X, Hu S et al..Hu S .2017. Attributing regional trends of evapotranspiration and gross primary productivity with remote sensing: A case study in the North China Plain.Hydrology and Earth System Sciences, 21: 295-310.

DOI

[42]
Pittman K, Hansen M C, Becker-Reshef Iet al., 2010. Estimating global cropland extent with multi-year MODIS data.Remote Sensing, 2(7): 1844-1863.

DOI

[43]
Qin C B, Jia Y W, Su Zet al., 2014. An analysis of water consumption and pollution with the input-output model in the Haihe River Basin, China. Advanced Materials Research, 864-867: 1059-1069.

[44]
Rosenberg D E, 2015. Blended near-optimal alternative generation, visualization, and interaction for water resources decision making.Water Resources Research, 51: 2047-2063.

DOI

[45]
Shu Y, Villholth K G, Jensen K Het al., 2012. Integrated hydrological modeling of the North China Plain: Options for sustainable groundwater use in the alluvial plain of Mt. Taihang.Journal of Hydrology, 464/465: 79-93.

DOI

[46]
Steinshouer D W, Qiang J, McCabe P Jet al., 1990. Maps showing geology, oil and gas fields, and geologic provinces of the Asia Pacific Region. United States Geological Survey. Open File Report 97-470F: pp16.

[47]
Sun H, Shao L, Liu Xet al., 2012. Determination of water consumption and the water-saving potential of three mulching methods in a Jujube Orchard.European Journal of Agronomy, 43(87): 87-95.

DOI

[48]
Thenkabail P S, Knox J W, Ozdogan Met al., 2012. Assessing future risks to agricultural productivity, water resources and food security: How can remote sensing help? Photogrammetric Engineering and Remote Sensing, (Special Issue on Global Croplands: Highlight Article), 78(8): 773-782.

[49]
Tilmant A, Pinte D, Goor Q, 2008. Assessing marginal water values in multipurpose multireservoir systems via stochastic programming. Water Resources Research, 44(12). doi: 10.1029/2008WR007024.

[50]
United Nations, 1992. The Dublin statement on water and sustainable development. From the International conference on water and the environment, viewed 10/01/2016..

[51]
United States Geological Survey, 2017. Shuttle radar topography mission data. downloaded from earth explorer with courtesy of the U.S. Geological Survey, viewed 15/04/2017. .

[52]
Wang X, Cui Q, Li S, 2012. An optimal water allocation model based on water resources security assessment and its application in Zhangjiakou region, northern China.Resources, Conservation and Recycling, 69: 57-65.

[53]
Wang X, Sun Y, Song Let al., 2009. An eco-environmental water demand based model for optimizing water resources using hybrid genetic simulated annealing algorithms. Part II. Model application and results.Journal of Environmental Management, 90(8): 2612-2619.

[54]
Wang X, Zhang J, Yang Z et al.Yang Z , 2015. Historic water consumptions and future management strategies for Haihe River Basin of northern China.Mitigation and Adaptation Strategies for Global Change, 20(3): 371-387.

DOI

[55]
Wang Z M, Zhang B, Li X Yet al., 2006. Using CropSyst to simulate spring wheat growth in black soil zone of Northeast China.Pedosphere, 16(3): 354-361.

DOI

[56]
Weng S Q, Huang G H, Li Y P, 2010. An integrated scenario-based multi-criteria decision support system for water resources management and planning: A case study in the Haihe River Basin.Expert Systems with Applications, 37(12): 8242-8254.

DOI

[57]
World Bank, 2001. Agenda for water sector strategy for North China - Volume 2: Main report. Report no. 22040-CHA.

[58]
Yang Y, Yang T, Moiwo J Pet al., 2010. Agricultural water management estimation of irrigation requirement for sustainable water resources reallocation in North China.Agricultural Water Management, 97: 1711-1721.

DOI

[59]
Young R A, 2005. Determining the Economic Value of Water: Concepts and Methods. Resources for the Future, Washington DC.

[60]
Zhang L, 2008. Water balance modeling over variable time scales based on the Budyko Framework: Model development and testing.Journal of Hydrology, 360: 117-131.

DOI

[61]
Zhang X, Chen S, Sun Het al., 2011. Changes in evapotranspiration over irrigated winter wheat and maize in North China Plain over three decades.Agricultural Water Management, 98(6): 1097-1104.

DOI

[62]
Zhang Y, Li G, 2013. Long-term evolution of cones of depression in shallow aquifers in the North China Plain.Water, 5: 677-697.

DOI

[63]
Zhu Y, Drake S, Het al., 2010. Analysis of temporal and spatial differences in eco-environmental carrying capacity related to water in the Haihe River Basin, China.Water Resources Management, 24: 1089-1105.

DOI

Outlines

/