
Journal of Geographical Sciences >
Effects of different land use types on potential evapotranspiration in the Beijing-Tianjin-Hebei region, North China
Author: Han Jingyan (1984-), PhD, specialized in hydrology and water resource. E-mail: hanjy16@mails.tsinghua.edu.cn
Received date: 2018-05-12
Accepted date: 2018-11-15
Online published: 2019-06-25
Supported by
National Key Research and Development Program of China, No.2016YFC0401407
National Natural Science Foundation of China, No.51379216
National Science Foundation for Distinguished Young Scholars, No.51625904
International Science & Technology Cooperation Program of China, No.2016YFE0102400
Copyright
Potential evapotranspiration (ET0) is vital for hydrologic cycle and water resource assessments as well as crop water requirement and irrigation demand assessments. The Beijing-Tianjin-Hebei region (Jing-Jin-Ji)-an important, large, regional, economic community in China has experienced tremendous land use and land cover changes because of urbanisation and ecological restoration, affecting the hydrologic cycle and water resources of this region. Therefore, we analysed ET0 in this region using climate data from 22 meteorological stations for the period 1991-2015 to understand this effect. Our findings show that ET0 increased significantly at a rate of 7.40 mm per decade for the region. Based on the major land use type surrounding them, the meteorological stations were classified as urban, farmland, and natural stations using the 2015 land use dataset. The natural stations in the northern mountainous area showed a significant increase in ET0, whereas most urban and farmland stations in the plain area showed a decrease in ET0, with only a few of the stations showing an increase. Based on the different ET0 trends for different land use types, these stations can be ranked as follows: urban stations (trend value: -4.663 to -1.439) > natural stations (trend value: 2.58 to 3.373) > farmland stations (trend value: -2.927 to -0.248). Our results indicate that land use changes affect meteorological parameters, such as wind speed and sunshine duration, which then lead to changes in ET0. We noted that wind speed was the dominant parameter affecting ET0 at all the natural stations, and wind speed and sunshine duration were the dominant parameters affecting ET0 at most of the urban stations. However, the main controlling parameters affecting ET0 at the farmland stations varied. These results present a scope for understanding land use impact on ET0, which can then be applied to studies on sustainable land use planning and water resource management.
HAN Jingyan , ZHAO Yong , WANG Jianhua , ZHANG Bing , ZHU Yongnan , JIANG Shan , WANG Lizhen . Effects of different land use types on potential evapotranspiration in the Beijing-Tianjin-Hebei region, North China[J]. Journal of Geographical Sciences, 2019 , 29(6) : 922 -934 . DOI: 10.1007/s11442-019-1637-7
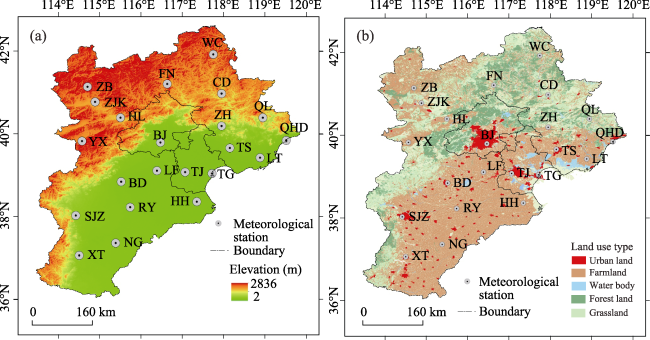
Figure 1 Location of the meteorological stations (a) and land use patterns in 2015 (b) for the Jing-Jin-Ji region |
Table 1 Location of 22 national meteorological stations in the Jing-Jin-Ji region |
| Station No. | Station | Latitude (°N) | Longitude (°E) | Elevation (m) | Dominant land use type |
|---|---|---|---|---|---|
| 53399 | Zhangbei (ZB) | 41.15 | 114.70 | 1393.3 | Farmland |
| 53593 | Yuxian (YX) | 39.83 | 114.57 | 909.5 | Farmland |
| 53698 | Shijiazhuang (SJZ) | 38.03 | 114.42 | 81.0 | Urban |
| 53798 | Xingtai (XT) | 37.07 | 114.50 | 77.3 | Urban |
| 54308 | Fengning (FN) | 41.22 | 116.63 | 661.2 | Natural |
| 54311 | Weichang (WC) | 41.93 | 117.75 | 842.8 | Natural |
| 54401 | Zhangjiakou (ZJK) | 40.78 | 114.88 | 724.2 | Urban |
| 54405 | Huailai (HL) | 40.40 | 115.50 | 536.8 | Farmland |
| 54423 | Chengde (CD) | 40.98 | 117.95 | 385.9 | Natural |
| 54429 | Zunhua (ZH) | 40.20 | 117.95 | 54.9 | Urban |
| 54436 | Qinglong (QL) | 40.40 | 118.95 | 227.5 | Natural |
| 54449 | Qinhuangdao (QHD) | 39.85 | 119.52 | 2.4 | Urban |
| 54511 | Beijing (BJ) | 39.80 | 116.47 | 31.3 | Urban |
| 54518 | Langfang (LF) | 39.12 | 116.38 | 9.0 | Farmland |
| 54527 | Tianjin (TJ) | 39.08 | 117.07 | 2.5 | Urban |
| 54534 | Tangshan (TS) | 39.67 | 118.15 | 27.8 | Urban |
| 54539 | Laoting (LT) | 39.43 | 118.88 | 10.5 | Farmland |
| 54602 | Baoding (BD) | 38.85 | 115.52 | 17.2 | Urban |
| 54606 | Raoyang (RY) | 38.23 | 115.73 | 19.0 | Farmland |
| 54623 | Tanggu (TG) | 39.05 | 117.72 | 4.8 | Urban |
| 54624 | Huanghua (HH) | 38.37 | 117.35 | 6.6 | Farmland |
| 54705 | Nangong (NG) | 37.37 | 115.38 | 27.4 | Farmland |
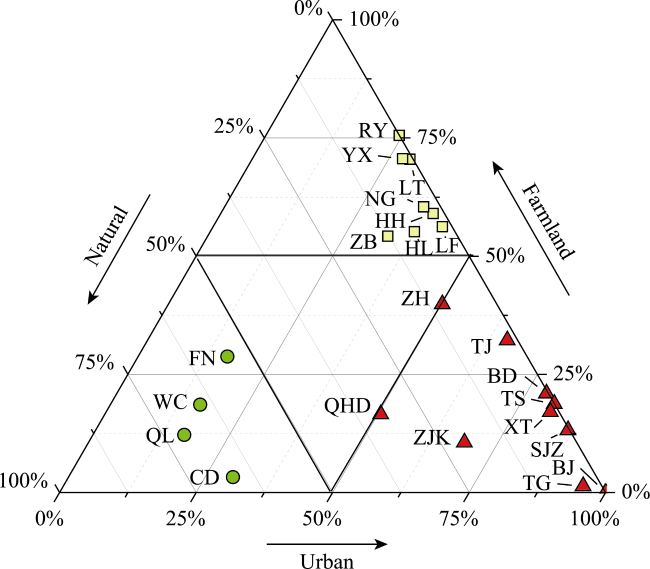
 (1)
(1)Figure 2 Urban, farmland and natural stations classified using 2015 land use dataset for the Jing-Jin-Ji region |
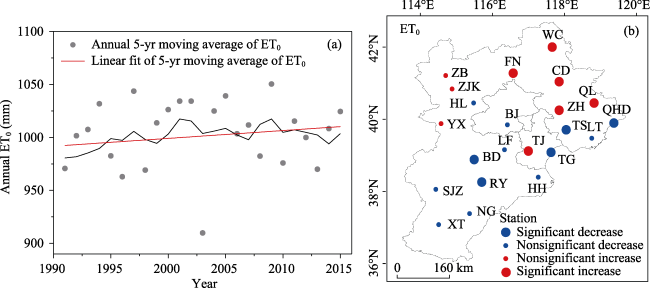
Figure 3 Annual change (a) and spatial change (b) in ET0 in the Jing-Jin-Ji region from 1991 to 2015 |
Figure 4 Relationship between ET0 changes and land use patterns in 2015 |
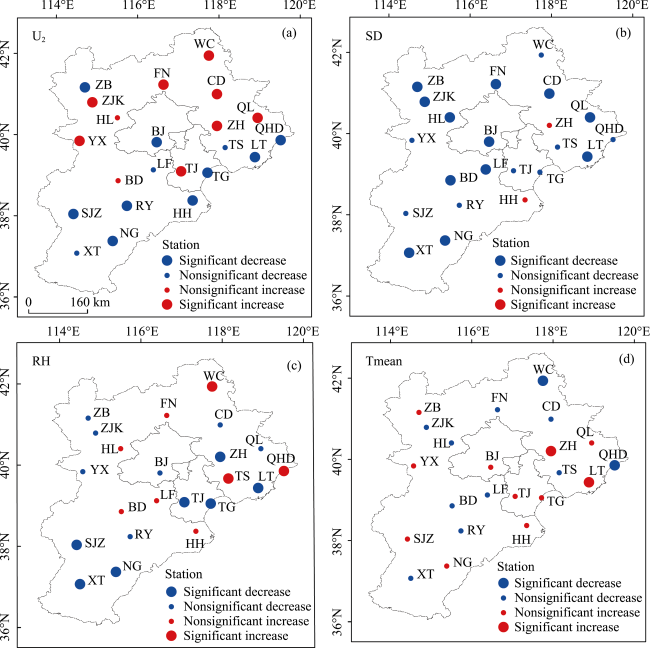
Figure 5 Changes of meteorological parameters at 22 stations: (a) wind speed, (b) sunshine duration, (c) relative humidity and (d) average air temperature |
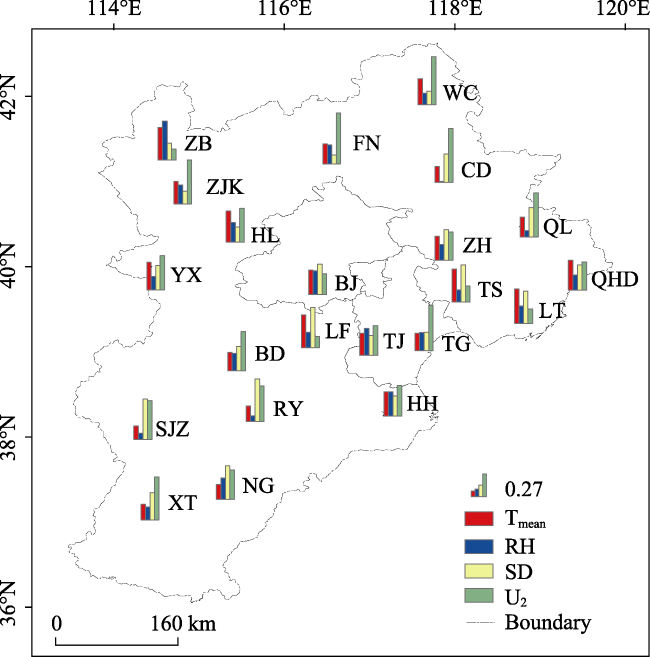
Figure 6 Relative contributions of meteorological parameters to ET0 of different land use types in the study area |
The authors have declared that no competing interests exist.
| [1] |
|
| [2] |
|
| [3] |
|
| [4] |
|
| [5] |
|
| [6] |
|
| [7] |
|
| [8] |
|
| [9] |
|
| [10] |
|
| [11] |
|
| [12] |
|
| [13] |
|
| [14] |
|
| [15] |
|
| [16] |
|
| [17] |
|
| [18] |
|
| [19] |
|
| [20] |
|
| [21] |
|
| [22] |
|
| [23] |
|
| [24] |
|
| [25] |
|
| [26] |
|
| [27] |
|
| [28] |
|
| [29] |
|
| [30] |
|
| [31] |
|
/
| 〈 |
|
〉 |
