Special Issue: Water Resources in Beijing-Tianjin-Hebei Region

Mapping the agricultural land use of the North China Plain in 2002 and 2012

  • ZHANG Yucui ,
  • QI Yongqing , * ,
  • SHEN Yanjun ,
  • WANG Hongying ,
  • PAN Xuepeng
Expand
  • Key Laboratory of Agricultural Water Resources, Hebei Key Laboratory of Water-Saving Agriculture, Center for Agricultural Resources Research, Institute of Genetics and Developmental Biology, CAS, Shijiazhuang 050021, China

Author: Zhang Yucui (1984-), Assistant Professor, specialized in eco-hydrology and isotope hydrology.E-mail:

Received date: 2018-05-12

  Accepted date: 2018-11-23

  Online published: 2019-06-25

Supported by

National Key Research and Development Plan, No.2016YFC0401403

National Natural Science Foundation of China, No.41471027, No.31870422

The Youth Innovation Promotion Association CAS, No.2017138

Copyright

Journal of Geographical Sciences, All Rights Reserved

Abstract

Based on the MODIS NDVI data and Landsat TM/ETM data of 2002 and 2012, this paper extracts the planting area of winter wheat-summer maize, single spring maize, cotton and forest/fruit trees, vegetable and paddy, and made the agricultural land use map of the North China Plain (NCP). Agricultural land use area accounted for 63.32% compared to the total area of the NCP in 2002. And it increased to 65.66% in 2012, which mainly caused by the vegetables and forest/fruit trees increasing. Planting areas of winter wheat-summer maize, cotton, single spring maize, forest/fruit trees, vegetables and paddy were 5031.21×103, 865.90×10³, 1226.10×103, 1271.17×103, 648.02×10³, 216.51×10³ ha in 2012. Rank of changes was: vegetables (+45%) > forest/fruit trees (+27.4%) > paddy (-23.7%) > cotton (-20.4%) > single spring maize (+17.3%) > winter wheat-summer maize (-0.6%). In developed region like Beijing and Tianjin, planting area of crops with high economic benefit (such as fruit trees and vegetables) increased significantly. Government policies for groundwater protection caused obvious decline of winter wheat cultivation in Hebei Province. Cotton planting in Shandong Province decreased more than 200,000 ha during 2002-2012. The data products will be published in the website: http://hydro.sjziam.ac.cn/Default.aspx. To clarify the agricultural land use in the NCP will be very helpful for the regional agricultural water consumption research, which is the serious problem in the NCP.

Cite this article

ZHANG Yucui , QI Yongqing , SHEN Yanjun , WANG Hongying , PAN Xuepeng . Mapping the agricultural land use of the North China Plain in 2002 and 2012[J]. Journal of Geographical Sciences, 2019 , 29(6) : 909 -921 . DOI: 10.1007/s11442-019-1636-8

1 Introduction

The North China Plain (NCP) produced ~20% of national grain food while ~80% of the cropland was irrigated by groundwater (Yuan and Shen, 2013). Therefore, water shortage and ecological problems caused by decreased groundwater table become more and more serious in the NCP. Cropping system adjustment and agricultural production estimation are the key to ensure both food security and water saving. Remote sensing monitoring of agriculture provides the information support which included the crop spatial pattern. Crop spatial pattern can help to clear the regional crop planting structure (crop types and planting areas), systems (multiple cropping or fallow) and patterns (continuous, rotation or interplanting) (Tang et al., 2010). In order to reduce the inputs and maximize the profit, crops and agricultural production strategies have changed dramatically in the NCP over the past decade. Crops spatial pattern is very important for reasonable cropping system adjustment and optimization, effects of climate change on agriculture and model building in this region.
Remote sensing applied in the crop monitoring started in the mid-20th century. In the 1960s, the Purdue University firstly used the remote sensing data to monitoring the single maize growth. In 1974, in order to identify and measure the areal extent of major crop types and to estimate their yields, the Large Area Crop Inventory Experiment (LACIE) was undertaken jointly by the USDA (United States Department of Agriculture), NOAA (the National Oceanic and Atmospheric Administration) and NASA (the National Aeronautics and Space Administration) (MacDonald et al., 1975). In 1980, the AgRISTARS Project (Agriculture and Resources Inventory Surveys through Aerospace Remote Sensing) was implemented by ESS (Economics and Statistics Service). This project completed the growth and yields estimation of many kinds of crops, e.g. wheat, maize and soybean (Kleweno and Miller, 1981; Wilson and Sebaugh, 1981). During the 1990s, more and more countries developed the crop spatial patterns research by the remote sensing method. The MARS Project (Monitoring Agriculture with Remote Sensing) of the European Union developed large scale operational tools to establish the crop yields estimation systems (Gallego, 1999). Accurate mapping of agricultural land use in semi-arid Africa has proven to be difficult, because the size of cropped fields is small with high similarity between the cropped and uncropped surfaces. However, multi-temporal imagery data of SPOT-XS were used to recognize and map the rice fields on a West African floodplain and 71% of ploughed-field reference sites were classified correctly (Turner and Congalton, 1998). From 1997, the NASS (National Agricultural Statistics Service) of USDA produces the annual Cropland Data Layer product (Boryan et al., 2011). Multiple crops types (e.g. cotton, sugar beet, and alfalfa) were identified by the remote sensing method (Clevers, 1997; Conrad et al., 2016; Marshall and Thenkabail, 2015). The research also extends from the single growth area observation to multiple cropping systems and patterns distribution (Murakami et al., 2001; Serra et al., 2016).
Remote sensing monitoring of crop acreage in small scale area usually used the full-coverage remote sensing image with multi-sensor, multi-time and spatial resolution. High spatial resolution of QuickBird and Landsat TM data were widely used in crop acreage, spatial distribution and dynamic change extraction (Cohen and Shoshany, 2002; Frolking et al., 2002; Kingra et al., 2016). Liu et al. (2003, 2005, 2010) used the Landsat TM digital images to learn the spatial patterns of land use change in China during different periods and also analyzed some driving forces. However, medium and low spatial resolution MODIS data play an important role in crop acreage spatial distribution monitoring in large areas (Wardlow and Egbert, 2008; Xiao et al., 2005). Methods of mapping crop distribution by remote sensing can be divided into three categories: crop identification method based on the spectral characteristics (Wu and Li, 2012), crop phenology characteristics (Zhong et al., 2016), or multi-source data (Zhao et al., 2016).
Significant progress has also been made in the study of crop cropping patterns based on remote sensing technology. The vegetation index based on remote sensing data can reflect the growth status of vegetation. At the same time, the seasonal variation of vegetation index corresponds to the seasonal activity process of vegetation growth and decline. Therefore, the time series vegetation index is used to obtain the crop growth curve by various smoothing methods, which can effectively monitor the crop multiple cropping pattern. Based on the time-series EOS-MODIS NDVI data, crop planting patterns in the North China Plain were studied by the Fourier analysis method (Zhang et al., 2008). Maximum likelihood classifier is also used in estimating the crop rotation research by the NDVI and EVI data (Oguro et al., 2001; Panigrahy and Sharma, 1997).
However, planting patterns and cropping systems are various in China. Characteristics of Chinese crop distribution are fragmentized and scattered. Previous studies on the spatial and temporal pattern of crops in successive years usually used the visual interpretation method or based on the mathematical analysis of statistical data (de Oliveira et al., 2017; Li et al., 2017; Liu et al., 2014). All these methods consumed lots of laboral, material and financial resources. At the same time, crop distribution map of the NCP will be useful to clarify and optimize the planting pattern and agricultural disaster alleviation. Therefore, time and labor-saving methods for crop planting area extraction for the NCP in successive years are very necessary. Objectives of this study are: 1) Based on the time series NDVI data and phenological characteristics, the main crops of the NCP were classified, and the crops with small planting area such as vegetables and rice were extracted based on TM/ETM data; 2) modification and accuracy test were carried out according to the investigative and statistical data; 3) agricultural land use change was observed in the NCP during 2002-2012. This article only classified agricultural land and analyzed its changes. Construction land, water bodies, and wetlands, etc. are not included in this article.

2 Data sources

2.1 Site description

The North China Plain, covering an area of about 141,000 km2 (Figure 1), which is located in the east of the Taihang Mountains, west of the Bohai Sea, south of the Yanshan Mountains, north of the Yellow River. This area is flat with deep soil layer and the attitude of the NCP is lower than 100 m. The NCP includes municipalities of Beijing and Tianjin, provinces of Hebei, northern Henan, and western Shandong. It belongs to the temperate continental monsoon climate with the annual mean temperature of 10.0-14.2oC. Annual radiation is enough for the growth of winter wheat-summer maize rotation. Main grain crops are wheat, maize and rice while main economic crops are cotton, fruit trees and vegetables. Yields of these crops account for about 8%-50% (Fang et al., 2010; Pei et al., 2015; Zhang et al., 2013). Annual mean precipitation in the area is 400-500 mm, with about 70% occurring in summer. Agricultural irrigation consumed more than 80% of the total groundwater.
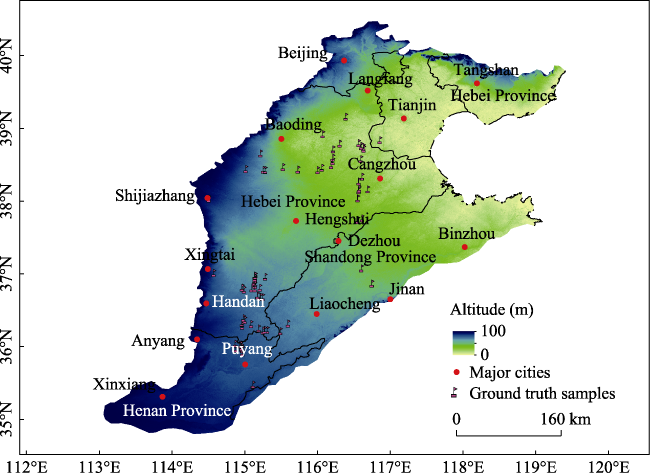
Figure 1 Elevation map of North China Plain with the positions of ground truth samples

2.2 Data sources

The remote sensing data included 250 m NDVI (MOD13Q1) data, 1000 m land-cover type data (MOD12Q1) of Terra/MODIS (Moderate-Resolution Imaging Spectroradiometer), and 30 m Landsat/TM images (Thematic Mapper). MODIS NDVI data were 16-day compo-sited time series data (2002 and 2012, H26V04, H26V05, H27V04, H27V05), used for building crop growth stages curve and crop recognition. Land-cover type MODIS data were from NASA (http://reverb.echo.nasa.gov, 2002 and 2012), which were applied for masking NDVI data and non-cropland & non-forest land area removing. Landsat TM images came from the Global Land Cover Facility belonging to University of Maryland (http://www.landcover.org/), which were used to extract crops, vegetables and rice with small area.
Verification data included the meteorological data from the CMDC (China Meteorological Data Service Center, http://data.cma.cn/en), observation data of crop growth stages from the agricultural meteorological stations (22 points, mainly distributed in Beijing, Tianjin, and Hebei Province), crop sown area data from the provincial and municipal statistical data (2002-2012, provinces and municipalities located in the NCP) and field survey data (89 points located in the NCP).

3 Data processing methods

3.1 Crop NDVI time series curve reconstruction

According to the field survey, statistical data and phenological material from the agricultural meteorological stations, winter wheat-summer maize, single maize, cotton and fruit orchard were the main agricultural land use types while their phenological characteristics were quite different from each other. So, it was easy to extract the planting area according to these differences (Figure 2).
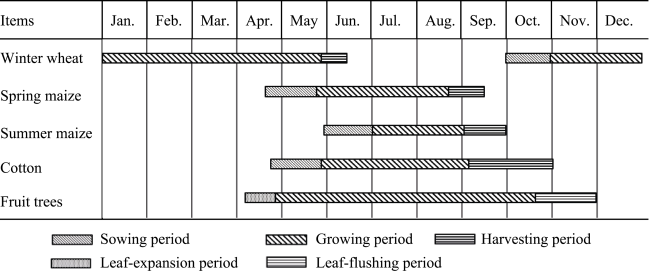
Figure 2 The main crops growth periods in the North China Plain
At the same time, the time series curve of annual MODIS NDVI data was reconstructed. In order to avoid effects from clouds, fog and water vapor, HANTS algorithms (Harmonic Analysis of Time Series), available from the Geospatial Data Service Centre (GDSC), Netherland was used to eliminate noise and retrieve the previous metrics. HANTS is an improved algorithm based on Fourier transform, which is commonly used in remote sensing image processing to reduce periodic fluctuation noise (Roerink et al., 2000). This algorithm is suitable for processing time series to retrieve vegetation metrics as considering the seasonality of vegetation (White et al., 2009). According to the planting characteristics, survey and MODIS NDVI data, values of 5 major control parameters of HANTS were: 1) valid data range: -3000 to 10000; 2) length of period: 23; 3) frequencies selected: 2; 4) fit Error Tolerance: 1000; 5) maximum number of points thrown away: 8. The crop NDVI time series data after reconstruction were shown in Figure 3.
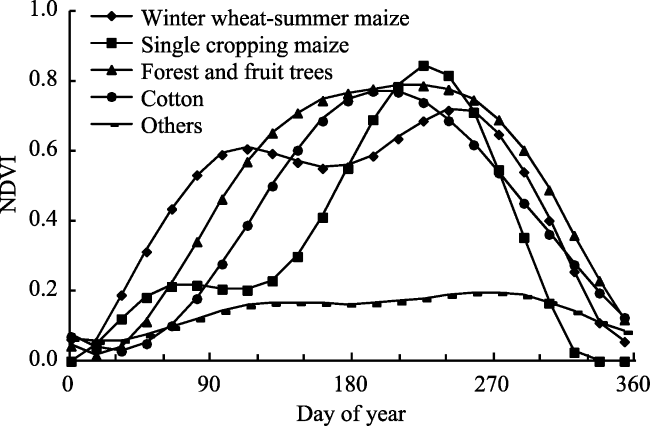
Figure 3 NDVI time series curves of different crops in the North China Plain

3.2 Multiple Cropping Index (MCI) calculation

The number of peaks of curves in the NDVI time series represents the Multiple Cropping Index (MCI) (Zhang et al., 2017). However, NDVI time series data were still discrete points, not showing continuous function after the reconstruction. The number of peaks can be obtained by searching for local maxima in the reconstructed NDVI time series with the aid of the improved difference method (Fan and Wu, 2004; Liang et al., 2017), which avoided the micro peaks caused by the sparse vegetation coverage by the NDVI threshold value according to many experimental results including the study area (Eq. 1). The method of controlling the time series length (see Figure 2) was used to shield the peaks outside the growing season and the winter peaks.
$MCI=\left\{ \begin{align} & 0\ \ \ \ \ \ \ \ \ \ \ \ \ \ \ \ \ \ \ \ \ \ \ \ \ \ \ \ \ \ \ \ \ \ NDVI<85 \\ & \text{numbers}\ \text{of}\ \text{maximum}\ \ \ \ NDVI\ge 85 \\ \end{align} \right.$ (1)

3.3 Classification and Regression Tree method (CART)

Classification and Regression Tree method (CART) was a generic supervisory classification method (Breiman et al., 1984), which used the training sample to construct binary trees for classification. The original CART code decision tree software contained two parts: the Classifier and Numerical modules. The first module was used to construct the decision trees and produce the classification results while the second was used in numerical modelling, for large regional or long time series remote sensing classification. In this classification research, the target variables were winter wheat-summer maize, single spring maize, cotton and forest/fruit trees. And the test variables were characteristics of NDVI time series data for different crop types. Firstly, the classification training samples are selected to generate the rule table, based on the MCI and the NDVI curve of each type, and then the regular rule table is trimmed. Finally, the rule table is used for classification.

3.4 TM/ETM data processing

Based on TM/ETM data, the maximum likelihood method was used to classify the images by selecting the training samples, and the planting area of vegetables and rice in the NCP was extracted. Because the available Landsat TM/ETM data are not continuous in time, this research chooses the images of the early April around 2002 and 2012. And vegetables and rice area of these two years in the NCP were extracted. The total area of these two crop types is still very small, accounted for less than 7% of the total NCP area. And planting area change during continuous years was even smaller and had little effect on the other crop area changes in the NCP. Therefore, the extraction results were considered as the mapping of vegetables and rice area in 2002 and 2012.

3.5 Calibration and verification of classification results and mapping for agricultural land use

According to the statistical data and investigation, single spring maize was planted in most northern Hebei, while cotton was planted in the northwest of Shandong. However, classification results of remote sensing showed that the area of cotton planting in northern Hebei and single spring maize in northwestern Shandong were too large. This phenomenon appeared probably due to the close growth period of cotton and single spring maize and similar filtered NDVI time series curve. Therefore, classification results of the cotton in northern Hebei and the single spring maize in the northwest of Shandong were adjusted to single spring maize and cotton respectively, for grids of continuous pixels number larger than one.
The results of winter wheat-summer maize, single cropping maize, cotton, forest and fruit trees based on MODIS data were added to the vegetables and rice results based on TM/ETM data in 2002 and 2012, which were cut according to the boundaries of the NCP. Finally, we got the agricultural land use as shown in Figure 4. The classification results of the counties and the statistical yearbooks were compared for accuracy verification. The correlation coefficient between area and agricultural statistical area is higher than 0.77 for all the cropland use types (confidence interval: 95%, Figure 5), and the slope was similar to 1:1 line. This method has high classification accuracy in crop extraction in the NCP, and can reflect the spatial and temporal changes of agricultural land use.
The distributions of different agricultural land use types of the NCP in 2002 and 2012 (Figure 4) shows winter wheat and summer maize are widely cultivated in the south of Beijing and Tianjin, which are the main planting pattern in the NCP. Single maize is widely distributed in northern Hebei, especially in Langfang. Cotton is mainly distributed in southern Hebei and the main cotton producing areas of northwestern Shandong, such as Xingtai, Hengshui, Dezhou and Liaocheng. Fruit was concentrated in the fruit tree planting bases of Shijiazhuang, Cangzhou, and Binzhou. The agricultural land use in northern Hebei, Beijing and Tianjin is much complicated with various crops and economic crops such as the widely distributed vegetables and forest/fruit trees.
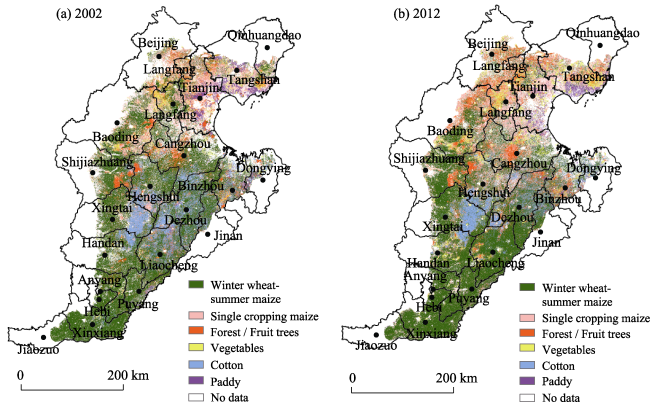
Figure 4 Agricultural land uses of the North China Plain in 2002 (a) and 2012 (b)
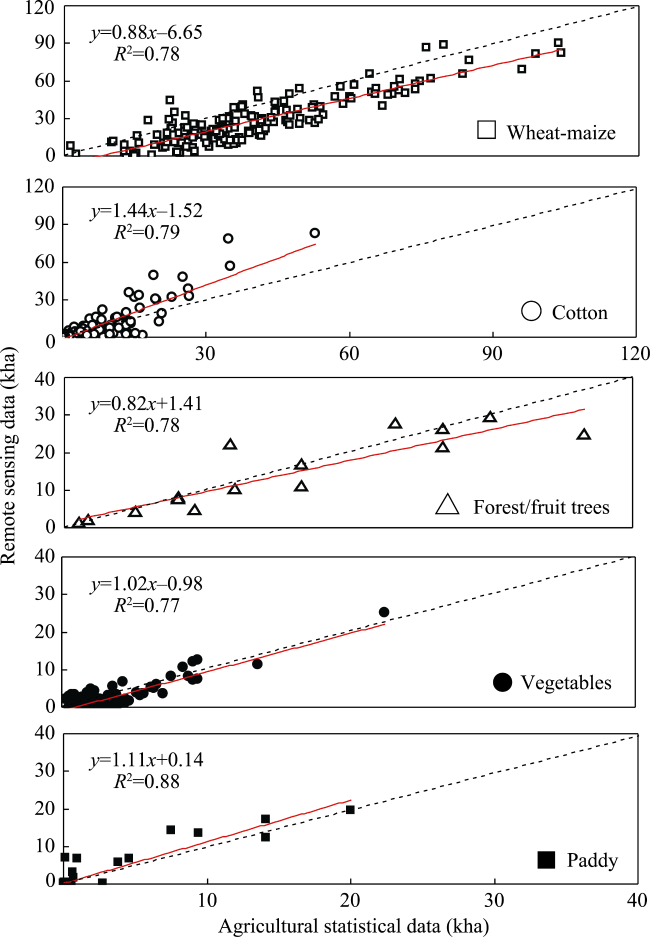
Figure 5 Comparison of classified land use area for different crops with statistical data (data points in the figures show area for year 2002 and 2012 at county level)

4 Results and discussion

4.1 Agricultural land use area changes of different planting patterns in the North China Plain

Agricultural land use area accounted for 63.32% compared to the total area of the NCP in 2002 (Table 1). And it increased to 65.66% in 2012, which was mainly caused by the vegetables and forest/fruit trees increasing. Winter wheat-summer maize rotation was the main planting pattern in the NCP. The planting area of this rotation accounted for about 55% of the total crop planting areas, which decreased by 34,200 ha from 2002 to 2012. Proportions of single spring maize, forest/fruit trees and cotton, compared with the total planting area, were around 12%. Planting area of cotton was decreasing by 221,400 ha while planting areas of single maize and forest/fruit trees increased by 17.3% and 27.4% from 2002 to 2012. Vegetables cultivation accounted for only 6% of the total planting area, which increased from 447,600 ha in 2002 to 648,000 ha in 2012. As the lowest proportion is about 2.7%, the rice cultivation acreage declined. In brief, the rank of crops planting areas in the NCP for 2012 was: Winter wheat-summer maize > forest/fruit trees > single spring maize > cotton > vegetables > paddy; the rank of changes was: vegetables (+45%) > forest/fruit trees (+27.4%) > paddy (-23.7%) > cotton (-20.4%) > single spring maize (+17.3%) > winter wheat-summer maize (-0.6%).
Table 1 Area and proportion of crops in the North China Plain
Year Items Winter wheat-summer maize Cotton Single spring maize Forest/ fruit trees Vegetables Paddy Summation
2002 Area (103 ha) 5065.40 1087.37 1045.88 997.60 447.62 283.88 8927.75
Proportion (%) 56.74 12.18 11.72 11.17 5.01 3.18 100.00
2012 Area (103 ha) 5031.21 865.90 1226.10 1271.17 648.02 216.51 9258.91
Proportion (%) 54.34 9.35 13.24 13.73 7.00 2.34 100.00
Based on remote sensing classification analysis, the total planting area increased from 8927.75×103 ha in 2002 to 9258.91 ×103 ha in 2012, with 3.7% increase within ten years. Official statistical data show the same trend that the planting area also increased by 500.00×10³ ha from 2002 to 2012. This result was probably caused by the following reasons: 1) Grain production in the NCP decreased from 1999 to 2003, while continued to grow from 2004 to 2013. The decline in grain production from 1999-2003 could be explained by the national policies (Zhao and Lv, 2015), which refers to “returning farmland to forests” program and is regarded as the major contributor to the decrease of cultivated land. Accordingly, farmers have less willingness to plant grain. Since 2004, the government has increased the subsidies and started to improve policies to boost agriculture and benefit farmers, with various documents on the theme of “agriculture, rural areas and farmers”. The increased grain sown area, agricultural input and water use efficiency have directly promoted the continuous increase in grain production during the last decade (Lu et al., 2016). 2) The available MODIS data are limited by spatial and temporal resolution (Chaudhuri et al., 2018), which influences the accuracy of classification. Different crops co-existence in the NCP, thus, the occurrence of mixed pixels provides a substantial challenge in classifying imagery. 3) A large amount of wastelands or saline-alkali lands have been restored or developed into productive agricultural land, such as areas around the Bohai Sea and in Henan Province (An, 2018), which can possibly explain the increase in agriculture land.

4.2 Agricultural land use area changes of different planting patterns in different cities

In order to clarify the differences of agricultural land use changes among cities and areas, the planting areas changes from 2002 to 2012 were compared as shown in Table 2. The NCP was divided into four parts according to the administrative boundary: Beijing and Tianjin, Hebei Province, Shandong Province and Henan Province.
Grain crops planting area of Beijing, Tianjin and eastern Hebei (Qinhuangdao and Tangshan) declined obviously, while forest/fruit trees and vegetable planting areas increased. The increase of forest/fruit trees in Beijing is likely to be affected by a significant increase in urban greening, rather than simply due to increased tourist picking around the city and suburbs. Because of the serious water shortage and governmental reducing groundwater exploration policies, winter wheat-summer maize planting areas in Langfang, Cangzhou, and Hengshui decreased obviously and the average proportion reached 31.7%, and the total area reduced by 280,000 ha. However, planting area of single spring maize increased about 160,000 ha, about 66.7%, compared with the previous planting area. Forest/fruit trees planting area also increased for about 40% in these three prefectures. Meanwhile, planting area of vegetables double increased in Cangzhou and Hengshui. Cotton planted in Hengshui decreased to 22,740 ha. These results were not any good for saving groundwater, which probably caused by the economic force. Grain crops planted in Baoding also decreased while fruit trees increased, especially for several counties near Beijing. Winter wheat-summer maize planting area in the south of Hebei (including Shijiazhuang, Xingtai and Handan) appeared a little increase, because some farmers no longer grew multigrain and switch to winter wheat and summer maize, which sowing and harvest were more conveniently. As the continuous low price, planting area of cotton decreased for about 10,000 ha in Shijiazhuang and Handan, while vegetable planting double increased in Handan.
Table 2 Agricultural land use area change of municipalities or prefectures in the North China Plain from 2002 to 2012 (103 ha)
Cotton Single spring maize Forest/ fruit trees Winter wheat Vegetables Paddy
Beijing (BJ) 0.13 -21.09 69.96 -8.57 7.13 0.93
Tianjin (TJ) 0.24 -5.09 -31.64 -19.91 48.92 -28.78
Hebei Province Qinhuangdao (QHD) 0.72 13.78 14.63 -24.89 0.49 -2.36
Tangshan (TS) 0.16 -31.07 35.38 -24.91 45.04 -25.12
Langfang (LF) 8.78 56.61 33.18 -81.30 13.69 1.19
Cangzhou (CZ) 9.61 63.08 34.28 -120.33 33.10 9.72
Hengshui (HS) -22.74 41.22 28.14 -78.82 23.27 0.56
Baoding (BD) 8.06 -17.40 95.50 -38.88 -1.67 1.61
Shijiazhuang (SJZ) -10.62 -7.24 0.78 57.33 -1.72 0.01
Xingtai (XT) 15.27 -29.04 -4.64 54.21 -0.51 0.00
Handan (HD) -9.36 10.71 -2.76 24.06 28.19 0.05
Shandong Province Dongying (DY) 8.50 2.09 -7.61 10.46 -6.08 -10.58
Binzhou (BZ) -6.43 5.85 8.44 -23.92 -2.85 -4.35
Jinan (JN) 10.26 2.99 0.73 -10.56 -0.07 1.80
Dezhou (DZ) -85.27 21.83 47.79 16.09 6.59 5.01
Liaocheng (LC) -139.00 12.08 -28.95 177.93 11.39 -7.18
Henan Province Hebi (HB) 0.13 3.43 -0.28 7.53 -0.10 0.00
Xinxiang (XX) -7.24 17.90 0.65 12.56 -0.80 -4.07
Jiaozuo (JZ) 0.29 5.49 1.32 -10.96 0.03 0.31
Puyang (PY) -0.52 21.79 -8.66 33.22 -0.81 -6.79
Anyang (AY) -2.34 12.38 -12.78 14.85 -2.11 0.01
Total -221.38 180.28 273.44 -34.82 201.15 -68.03
Water resources in Shandong are more abundant than in Hebei. Prefectures in Shandong were near the Yellow River, which supplied enough irrigated water. Therefore, winter wheat cultivation did not decline significantly. Winter wheat cultivation in Liaocheng increased 177,930 ha during 2002-2012. At the same time, because of the cumbersome planting approach and low price, there was some reduction of paddy and cotton planting in Liaocheng and Dezhou. More and more economic crops, such as watermelon, jujube pear and various vegetables, were planted in these prefectures. Take Dezhou as an example, cotton planting area decreased for 85,270 ha while forest/fruit trees increased 47,790 ha. Land use changed not obviously in Dongying, Binzhou and Jinan. Because of the wasteland renovation in flooded area and land reclamation of northern Henan, the planting area increased except in Jiaozuo with more mountainous regions. For the same reason as Shandong, the paddy and cotton planting area also decreased.
In general, agricultural land use change in Beijing, Tianjin and Henan was not significant, compared with Shandong and Hebei. Increased land use types in Beijing and Tianjin were crops with high economic benefit (fruit trees and vegetables, totally 94,368 ha). However, planting area of grain crops (wheat and single maize) increased obviously in Henan with a total of 118,181 ha. Winter wheat and cotton cultivation significantly changed in Hebei and Shandong, a decrease of more than 275,000 ha during 2002-2012. Meanwhile, forest/fruit trees and vegetables planting area increased around 403,000 ha in both of the two provinces.

5 Conclusions

The North China Plain is the second largest plain in China, which is one of the major grain-producing bases. Reasonable agricultural land use is related to the local and even food safety in China. The long-term irrigation has resulted in the rapid decline of the groundwater level in the NCP, forming the world’s largest ‘compound funnel’ area. Therefore, the research of agricultural land use serves as the important basis for crop distribution, agricultural disaster reduction and adjustment of agricultural planting pattern.
Based on the MODIS NDVI timing data and crop phenological characteristics, this study extracted the winter wheat-summer maize, single spring maize, cotton and forest/fruit planting area in the NCP from 2002 to 2012. Based on Landsat TM/ETM data, the vegetable and rice planting area in the NCP in 2002 and 2012 was extracted. Agricultural land use area accounted for 63.32% and increased to 65.66% in 2012 because of the increasing of vegetables and forest/fruit trees. Planting areas of winter wheat-summer maize, cotton, single spring maize, forest/fruit trees, vegetables and paddy were 5031.21×103, 865.90×10³, 1226.10×103, 1271.17×103, 648.02×10³ and 216.51×10³ ha, respectively in 2012. Rank of changes was: vegetables (+45%) > forest/fruit trees (+27.4%) > paddy (-23.7%) > cotton (-20.4%) > single spring maize (+17.3%) > winter wheat-summer maize (-0.6%). In developed region in the NCP, like Beijing and Tianjin, planting area of crops with high economic benefit (such as fruit trees and vegetables) increased significantly. Government policies for groundwater protection caused obvious decline of winter wheat cultivation in Hebei Province. However, the increase of fruit trees and vegetables planting seems no good for groundwater recover. Cotton planting in Shandong decreased more than 200,000 ha during 2002-2012 because of the low price and cumbersome harvest approach.
This research will provide basic data for regional agricultural water management, crop planting structure adjustment and groundwater protection. Further research still should be developed, such as the mixed pixels decomposition. The results will be uploaded to http://hydro.sjziam.ac.cn/Default.aspx. as products of agricultural hydrology and water resources group.

The authors have declared that no competing interests exist.

[1]
An G, 2018. Study on spatio-temporal change of ecological land in Yellow River Delta based on RS&GIS. E3S Web of Conferences. EDP Sciences, 38: 01008. .

[2]
Boryan C, Yang Z, Mueller Ret al., 2011. Monitoring US agriculture: The US Department of Agriculture, National Agricultural Statistics Service, Cropland Data Layer Program.Geocarto International, 26(5): 341-358.

DOI

[3]
Breiman L, Friedam J H, Olshen R Aet al., 1984. Classification and Regression Trees. Belmont: Wadsworth International Group, 1-358.

[4]
Chaudhuri A S, Singh P, Rai S C, 2018. Modelling LULC change dynamics and its impact on environment and water security: geospatial technology based assessment.Ecology, Environment and Conservation, 24(Suppl.): S292-S298.

[5]
Clevers J G P W, 1997. A simplified approach for yield prediction of sugar beet based on optical remote sensing data.Remote Sensing of Environment, 61(2): 221-228.

DOI

[6]
Cohen Y, Shoshany M, 2002. A national knowledge-based crop recognition in Mediterranean environment.International Journal of Applied Earth Observation and Geoinformation, 4(1): 75-87.

DOI

[7]
Conrad C, Lamers J P A, Ibragimov Net al., 2016. Analysing irrigated crop rotation patterns in arid Uzbekistan by the means of remote sensing: A case study on post-Soviet agricultural land use.Journal of Arid Environments, 124: 150-159.

DOI

[8]
de Oliveira S N, de Carvalho Júnior O A, Gomes R A Tet al., 2017. Landscape-fragmentation change due to recent agricultural expansion in the Brazilian Savanna, Western Bahia, Brazil.Regional Environmental Change, 17(2): 411-423.

DOI

[9]
Fan J, Wu B, 2004. A methodology for retrieving cropping index from NDVI profile.Journal of Remote Sensing, 8(6): 628-636. (in Chinese).

[10]
Fang Q, Ma L, Green Tet al., 2010. Water resources and water use efficiency in the North China Plain: Current status and agronomic management options.Agricultural Water Management, 97(8): 1102-1116.

DOI

[11]
Frolking S, Qiu J, Boles Set al., 2002. Combining remote sensing and ground census data to develop new maps of the distribution of rice agriculture in China. Global Biogeochemical Cycles, 16(4): 38-1-38-10.

[12]
Gallego F, 1999. Crop area estimation in the MARS Project. Conference on ten years of the MARS Project.

[13]
Kingra P, Majumder D, Singh S P, 2016. Application of remote sensing and GIS in agriculture and natural resource management under changing climatic conditions.Agricultural Research Journal, 53(3): 295-302.

DOI

[14]
Kleweno D D, Miller C E, 1981. 1980 AgRISTARS DC/LC Project Summary Crop Area Estimates for Kansas and Iowa. U.S. Department of Agriculture Economics and Statistics Service Statistical Research Division. ESS Staff Report, No.AGESS-810414.

[15]
Li X, Tong L, Niu Jet al., 2017. Spatio-temporal distribution of irrigation water productivity and its driving factors for cereal crops in Hexi Corridor, Northwest China.Agricultural Water Management, 179: 55-63.

DOI

[16]
Liang S, Ma W, Sui Xet al., 2017. Extracting the spatiotemporal pattern of cropping systems from NDVI time series using a combination of the spline and HANTS algorithms: A case study for Shandong Province.Canadian Journal of Remote Sensing, 43(1): 1-15.

DOI

[17]
Liu J, Kuang W, Zhang Zet al., 2014. Spatiotemporal characteristics, patterns, and causes of land-use changes in China since the late 1980s.Journal of Geographical Sciences, 24(2): 195-210.

DOI

[18]
Liu J, Liu M, Tian Het al., 2005. Spatial and temporal patterns of China's cropland during 1990-2000: An analysis based on Landsat TM data.Remote Sensing of Environment, 98(4): 442-456.

DOI

[19]
Liu J, Liu M, Zhuang Det al., 2003. Study on spatial pattern of land-use change in China during 1995-2000.Science in China Series D: Earth Sciences, 46(4): 373-384.

[20]
Liu J, Zhang Z, Xu Xet al., 2010. Spatial patterns and driving forces of land use change in China during the early 21st century.Journal of Geographical Sciences, 20(4): 483-494.

DOI

[21]
Lu Y, Zhang X, Chen S et al.Chen S , 2016. Changes in water use efficiency and water footprint in grain production over the past 35 years: A case study in the North China Plain.Journal of Cleaner Production, 116: 71-79.

DOI

[22]
MacDonald R, Hall F G, Erb R, 1975. The use of Landsat data in a large area crop inventory experiment (LACIE).

[23]
Marshall M, Thenkabail P, 2015. Developing in situ non-destructive estimates of crop biomass to address issues of scale in remote sensing.Remote Sensing, 7(1): 808.

DOI

[24]
Murakami T, Ogawa S, Ishitsuka Net al., 2001. Crop discrimination with multitemporal SPOT/HRV data in the Saga Plains, Japan.International Journal of Remote Sensing, 22(7): 1335-1348.

DOI

[25]
Oguro Y, Suga Y, Takeuchi Set al., 2001. Comparison of SAR and optical sensor data for monitoring of rice plant around Hiroshima.Advances in Space Research, 28(1): 195-200.

DOI

[26]
Panigrahy S, Sharma S A, 1997. Mapping of crop rotation using multidate Indian remote sensing satellite digital data.ISPRS Journal of Photogrammetry and Remote Sensing, 52(2): 85-91.

DOI

[27]
Pei H, Scanlon B R, Shen Yet al., 2015. Impacts of varying agricultural intensification on crop yield and groundwater resources: Comparison of the North China Plain and US High Plains.Environmental Research Letters, 10(4): 044013.

DOI

[28]
Roerink G, Menenti M, Verhoef W, 2000. Reconstructing cloudfree NDVI composites using Fourier analysis of time series.International Journal of Remote Sensing, 21(9): 1911-1917.

DOI

[29]
Serra P, Salvati L, Queralt Eet al., 2016. Estimating water consumption and irrigation requirements in a long-established mediterranean rural community by remote sensing and field data.Irrigation and Drainage, 65(5): 578-588.

DOI

[30]
Tang H, Wu W, Yang Pet al., 2010. Recent progresses in monitoring crop spatial patterns by using remote sensing technologies.Scientia Agricultura Sinica, 43(14): 2879-2888.

[31]
Turner M D, Congalton R G, 1998. Classification of multi-temporal SPOT-XS satellite data for mapping rice fields on a West African floodplain.International Journal of Remote Sensing, 19(1): 21-41.

DOI

[32]
Wardlow B D, Egbert S L, 2008. Large-area crop mapping using time-series MODIS 250 m NDVI data: An assessment for the U.S. Central Great Plains.Remote Sensing of Environment, 112(3): 1096-1116.

DOI

[33]
White M A, BEURS D, Kirsten Met al., 2009. Intercomparison, interpretation, and assessment of spring phenology in North America estimated from remote sensing for 1982-2006.Global Change Biology, 15(10): 2335-2359.

DOI

[34]
Wilson W W, Sebaugh J L, 1981. Established criteria and selected methods for evaluating crop yield models in the AgRISTARS Program. Proceedings of the American Statistical Association, American Statistical Association, Washington, DC: 24-34.

[35]
Wu B, Li Q, 2012. Crop planting and type proportion method for crop acreage estimation of complex agricultural landscapes.International Journal of Applied Earth Observation and Geoinformation, 16: 101-112.

DOI

[36]
Xiao X, Boles S, Liu Jet al., 2005. Mapping paddy rice agriculture in southern China using multi-temporal MODIS images.Remote Sensing of Environment, 95(4): 480-492.

DOI

[37]
Yuan Z, Shen Y, 2013. Estimation of agricultural water consumption from meteorological and yield data: A case study of Hebei, North China.PloS One, 8(3): e58685.

DOI

[38]
Zhang J, Manske G, Zhou Pet al., 2017. Factors influencing farmers’ decisions on nitrogen fertilizer application in the Liangzihu Lake basin, Central China.Environment, Development and Sustainability, 19(3): 791-805.

DOI

[39]
Zhang M, Zhou Q, Chen Zet al., 2008. Crop discrimination in northern China with double cropping systems using Fourier analysis of time-series MODIS data. International Journal of Applied Earth Observation and Geoinformation, 10(4): 476-485.

DOI

[40]
Zhang Y, Shen Y, Xu Xet al., 2013. Characteristics of the water-energy-carbon fluxes of irrigated pear (Pyrus bretschneideri Rehd) orchards in the North China Plain.Agricultural Water Management, 128: 140-148.

DOI

[41]
Zhao Y, Feng D, Yu Let al., 2016. Detailed dynamic land cover mapping of Chile: Accuracy improvement by integrating multi-temporal data.Remote Sensing of Environment, 183: 170-185.

DOI

[42]
Zhao Y, Lv H, 2015. The challenges and path selection in the development of modern agriculture in the background of 10 years of continuous growth of grain production in China.Research of Agricultural Modernization, 36(4): 561-567. (in Chinese)

[43]
Zhong L, Hu L, Yu Let al., 2016. Automated mapping of soybean and corn using phenology.ISPRS Journal of Photogrammetry and Remote Sensing, 119: 151-164.

DOI

Outlines

/