Special Issue: Water Resources in Beijing-Tianjin-Hebei Region

Groundwater recharge under irrigated agro-ecosystems in the North China Plain: From a critical zone perspective

  • MIN Leilei 1 ,
  • QI Yongqing , 1* ,
  • SHEN Yanjun 1 ,
  • WANG Ping 2 ,
  • WANG Shiqin 1 ,
  • LIU Meiying 1, 3
Expand
  • 1. Key Laboratory of Agricultural Water Resources, Hebei Key Laboratory of Water-Saving Agriculture, Center for Agricultural Resources Research, Institute of Genetics and Developmental Biology, CAS, Shijiazhuang 050021, China
  • 2. Key Laboratory of Water Cycle and Related Land Surface Processes, Institute of Geographic Sciences and Natural Resources Research, CAS, Beijing 100101, China
  • 3. University of Chinese Academy of Sciences, Beijing 100049, China
*Corresponding author: Qi Yongqing (1977-), Associate Professor, E-mail:

Author: Min Leilei (1985-), PhD and Assistant Professor, specialized in soil hydrology. E-mail:

Received date: 2018-05-12

  Accepted date: 2018-11-13

  Online published: 2019-06-25

Supported by

National Key Research and Development Plan, No.2016YFC0401403

National Natural Science Foundation of China, No.41877169

Copyright

Journal of Geographical Sciences, All Rights Reserved

Abstract

From a critical zone perspective, the present paper aims to present the magnitude of groundwater recharge under different agricultural land-use types, reveal the process of water and solute transport in thick vadose zone, evaluate the “time lag” effect of recharge, and underscore the role of thickening vadose zone in recharge. The results indicated that different agricultural land-use types need to be further considered in recharge rate estimate. Under the typical irrigation condition in the piedmont plain, the recharge rate under flood irrigated winter wheat and summer maize (W/M_F), maize (M), non-cultivation (NC), native vegetation (NV), vegetables (V), and orchards (O) is 206.4, 149.7, 194.1, 46.4, 320.0, and 48.6 mm/yr, respectively. In the central plain, the value under W/M_F, M, NC, V, and cotton (C) is 92.8, 50.8, 85.0, 255.5, and 26.5 mm/yr, respectively. Soil water residence time (several years) and groundwater level response time (several months) should be distinguished to further understand the processes of groundwater recharge, because the soil water displacement velocities range from 0.2 to 2.2 m/yr while the rate of wetting front propagation is approximately 47 m/yr in the piedmont plain. The thickening vadose zone would prolong residence time of soil water and contaminant, which could postpone the time of or alleviate groundwater pollution, but have no significant influence on the magnitude of recharge in a long time scale. Recharge coefficient based on shorter time span (e.g. 2 or 3 years) should be used with caution as a parameter for groundwater resources evaluation, because it varies with total water input and target soil depth. Uncertainties in evapotranspiration and other water balance components should be evaluated in recharge estimation and the impact of land-use types on recharge should be emphasized. The critical zone science would greatly improve the understanding of groundwater recharge processes. The results of the present study will be helpful in sustainable groundwater resources management.

Cite this article

MIN Leilei , QI Yongqing , SHEN Yanjun , WANG Ping , WANG Shiqin , LIU Meiying . Groundwater recharge under irrigated agro-ecosystems in the North China Plain: From a critical zone perspective[J]. Journal of Geographical Sciences, 2019 , 29(6) : 877 -890 . DOI: 10.1007/s11442-019-1634-x

1 Introduction

The earth’s Critical Zone (CZ) refers to the thin layer of the earth’s surface and near-surface terrestrial environment from the top of the vegetation canopy to the bottom of active groundwater (or the bottom of the weathering zone) (NRC, 2001). It involves in vegetation, unsaturated zone and saturated zone. As the linkage among physical, chemical and biological processes has been increasingly underscored to resolve practical problems (e.g. soil and groundwater pollution) and the relationship between surface vegetation and subsurface processes is emphasized, the integrated study of the CZ has been recognized as one of the most compelling research fields in earth and environmental sciences in the 21st century (Guo and Lin, 2016).
Groundwater recharge, the prerequisite for groundwater exploitation, is one of the most important hydrological variables and it is very difficult to be quantified. In the irrigated cropland, if the total water input (precipitation and irrigation) exceeds evapotranspiration, the redundant water will percolate from root zone into the deeper layer, named as deep drainage or groundwater potential recharge, and eventually recharge the underlying aquifer. Therefore, surface vegetation (determining how much water would be consumed) and soil hydraulic properties (affecting soil water flow velocity) are the two main factors controlling groundwater recharge amount and processes. Recharge processes (wetting front propagation and soil water displacement) are closely related to groundwater level response and water quality evolution, and have attracted more and more scientific interest. Thus, investigation of groundwater recharge under different croplands (vegetation types) could be very helpful for groundwater resources management.
The North China Plain (NCP) is one of the most serious regions in the world that suffers severe groundwater overexploitation, mostly from agriculture irrigation. The maximum water table depth exceeds 65 m, and the area where the hydraulic head is lower than the sea level covers more than 50% of the entire plain; groundwater depletion in the region has caused rivers drying up, land subsidence and sea water intrusion (Zheng et al., 2010). It has been reported that the net groundwater consumption in Hebei Plain (one part of the NCP) for grain production is 113 km3 during the past 25 years (Yuan and Shen, 2013). The present groundwater-fed agricultural land-use types in the NCP include: winter wheat and summer maize (W/M), summer maize (M), orchards (O), vegetables (V) and cotton (C) (Wang et al., 2015), as shown in Figure 1. Based on vadose zone data, groundwater recharge under W/M has been extensively reported (Lei et al., 1992; Wang et al., 2008; Lu et al., 2011; Lin et al., 2013; Tan et al., 2014; Min et al., 2015; Li et al., 2017). However, the study of recharge under the other land-use types associated with different soil properties is very limited. Moreover, the recharge processes, wetting front propagation and soil water displacement in unsaturated zone, are still less understood.
The objectives of the present study are: 1) to investigate the recharge rates under different agricultural land-use types; 2) to analyse the recharge processes in the vadose zone; 3) to promote some suggestions for improving the accuracy of recharge estimation.

2 Study area and data collection

2.1 Study area

The North China Plain (NCP) is one of the most important granaries of China, spanning a territory from 34.8°N to 40.4°N south-north and from 112.5°E to 119.5°E east-west (Figure 1). The area of the NCP is about 140,000 km2, and is bordered by the Yanshan Mountains in the north, the Bohai Sea on the east, the Yellow River in the south, and the Taihang Mountains on the west (Figure 1). According to previous studies, the NCP could be divided into three sub-plains: piedmont plain, central plain, and coastal plain, based on the geomorphology of palaeochannels, sedimentary character and relative geographic positions (Wu et al., 1996; Cao et al., 2016).
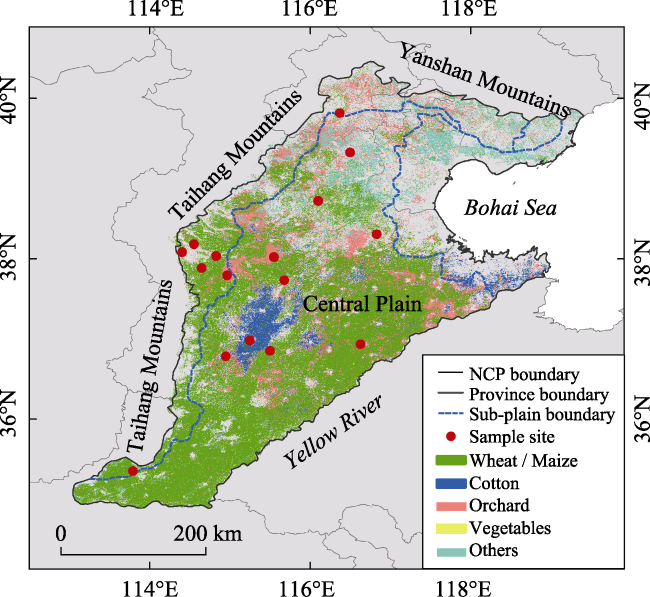
Figure 1 Agricultural land-use types in the North China Plain. The division of three sub-plains is modified from Cao et al. (2016).
The climate in the NCP is continental semiarid, with mean annual temperature of 12- 13℃, and mean annual precipitation is 560 mm (1951-2008), decreasing from 600 mm in the 1950s to 500 mm in the 2000s (Cao et al., 2013). The wheat-maize double cropping system dominates in the NCP with annual total grain yields of 12000-15000 kg/ha (Fang et al., 2010; Sun et al., 2010). Under a semiarid climate condition, the natural precipitation does not meet the crop water demand (Sun et al., 2010). In recent years, groundwater has provided 70% of the total water supply to support grain production (Cao et al., 2013); 70%-80% of groundwater exploitation is used for irrigation (Zhang et al., 2009b). The Quaternary aquifer of the NCP is traditionally divided into two aquifer zones referred as “shallow” and “deep” (Fei, 1988). Both two zones have been exploited. The hydrodynamic and hydro-geochemical systems in these two zones have been profoundly impacted by extensive groundwater exploitation. Long term excessive exploitation of groundwater had already caused the groundwater table decline (Figure 2), which had an important influence on the ecological systems, environment and the social and economic developments (Yuan and Shen, 2013). The spatially distributed rate of vadose zone thickening (water level decline) is shown in Figure 2. During the period from 1993 to 2010, the water level in the piedmont plain declined dramatically, at an average rate of 0.76 m/yr (Guo and Shen, 2015).
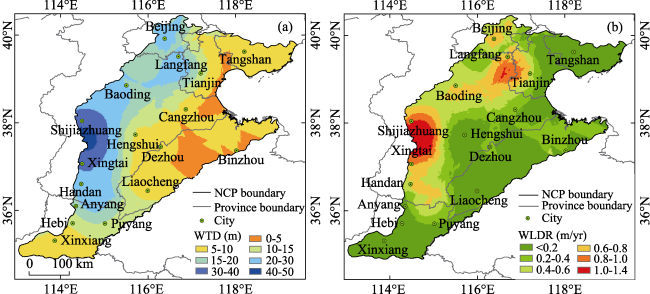
Figure 2 Water table depth (WTD) in 2010 (a) and the water level decline rate (WLDR) from 1993 to 2010 (b) in the North China Plain

2.2 Data collection and processing

2.2.1 Data collection
A lot of results concerning recharge rates under W/M could be found, based on various methods (tracer techniques, soil water budget and Darcy’s law). Therefore, the data on groundwater recharge was mainly collected from literature. Some published results are based on soil water budget, which may be impacted by the accuracy of evapotranspiration (ET) measurements. The Darcy’s law needs the unsaturated hydraulic conductivity, which is very difficult to be measured and has great uncertainty, and the accuracy of this method would be greatly impaired by this uncertainty (Healy and Scanlon, 2010). To exclude the uncertainties caused by ET and unsaturated hydraulic conductivity, these recharge rates used in the present study were all based on tracer techniques (Br- and 3H tracing experiments or the chloride mass balance method). The information on recharge estimation sites are listed in Table 1.
Table 1 Descriptions and summary of collected sites
Location Land-use type Irrigation type Number of profiles Reference
Piedmont plain W/M Flood 19 Lin et al., 2013; Tan et al., 2013; Wang et al., 2008
W/M Non 6 Tan et al., 2013
W/M Sprinkling 2 Wang et al., 2008
M Flood 1 Wang et al., 2008
O Flood 1 Min et al., 2018
V Flood 1 Min et al., 2018
NC Non 3 Wang et al., 2008
NV Non 2 Liu et al., 2009; Yuan et al., 2011
Central plain W/M Flood 13 Wang et al., 2008; Tan et al., 2013
W/M Non 4 Tan et al., 2013
M Flood (2); Non (1) 3 Wang et al., 2008; Tan et al., 2013
V Flood 1 Wang et al., 2008
NC Non 7 Wang et al., 2008; Tan et al., 2013
C Flood 3 Min et al., 2018

Note: W/M, M, NC, NV, V, O, and C represent winter wheat and summer maize, maize, non-cultivation, native vegetation, vegetable, orchard, and cotton, respectively.

2.2.2 Calculation of the velocity of soil water displacement and the rate of wetting front propagation
Based on the piston flow assumption, the velocity of conservative solute transport (soil water displacement) was calculated using Eq. (1) (Scanlon et al., 2007):
${{v}_{s}}=q/{{\theta }_{f}}$ (1)
where vs and q are the velocities of soil water displacement (m/yr) and groundwater recharge (m/yr), respectively. θf is the average volumetric water content (cm3/cm3).
Therefore, at a given water table depth (L, m), the soil water residence time (tr, yr) could be estimated by the following equation:
${{t}_{r}}=L/{{v}_{s}}$ (2)
Based on some assumptions (uniform texture, sufficient water supply and no ponding, long time enough and infinite soil column), the rate of wetting front propagation was calculatedusing Eq. (3) (Philip, 1957), which was later quoted by Warrick (2003) and Jury and Horton (2004) in their famous textbook and other scholars (Jolly et al., 1989; Scanlon et al., 2007):
${{v}_{wf}}=q/\Delta \theta $ (3)
where and q are the rates of wetting front propagation (m/yr) and groundwater recharge (m/yr), respectively. Δθ is the change in volumetric water content (cm3/cm3), i.e., the average soil water content (θf, cm3/cm3) behind the solute front (also refers to final water content) minus the initial soil water content (θi, cm3/cm3) ahead of the wetting front.
Similarly, groundwater level response time (t, yr) could be estimated by Eq. (4):
$t=L/{{v}_{wf}}$ (4)

3 Results and discussion

3.1 Groundwater recharge in piedmont plain and central plain

Groundwater recharge is controlled by vegetation type, soil texture, climate, and irrigation amount (Scanlon et al., 2010). We can easily assume that the variation in recharge caused by climate is less than vegetation type and soil texture heterogeneity, because the variation in climate is undoubtedly less than soil texture and land-use types in the NCP. Therefore, the impacts of soil texture factor (represented by the division of the NCP) and vegetation type on recharge are considered in this study.
3.1.1 Magnitude of recharge
As shown in Figure 3, it is obvious that the magnitude of recharge (the recharge rate) varies with land-use types associated with management practices (e.g. irrigation). In the piedmont plain, the magnitude of recharge under W/M_F, W/M_NI, W/M_S, M, NC, NV, V, and O is 206.4, 68.7, 82.1, 149.7, 194.1, 46.4, 320.0, and 48.6 mm/yr, respectively. In the central plain, the value under W/M_F, W/M_NI, M, NC, V, and C is 92.8, 53.6, 50.8, 85.0, 255.5, and 26.5 mm/yr, respectively. Even under the same vegetation type, winter wheat and summer maize, a difference in management practice (irrigation method) will lead to a different recharge rate, because flood irrigation often applies more water into field than the sprinkler irrigation. The magnitude of recharge under vegetables is higher than the average recharge rate under the other types, which is attributed to more irrigation under vegetables. The results imply that a shift in vegetation type and associated management practices would significantly alter the magnitude of recharge.
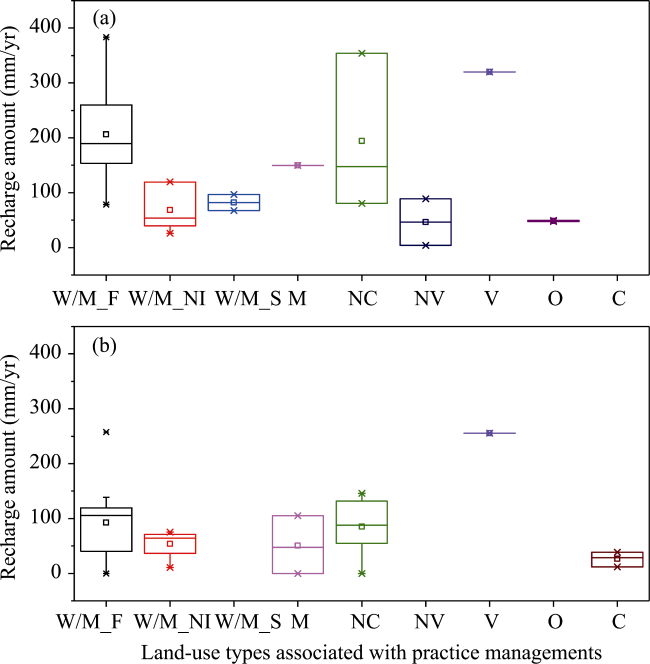
Figure 3 The magnitude of recharge under different land-use types associated with various management practices at piedmont plain (a) and central plain (b) in the North China Plain. Note that W/M_F, W/M_NI, W/M_S, M, NC, NV, V, O, and C represent winter wheat and summer maize under flood irrigation, winter wheat and summer maize under no irrigation, winter wheat and summer maize under sprinkling irrigation, maize, non-cultivation, native vegetation, vegetable, orchard, and cotton, respectively. Note that these are no data concerning C in the piedmont plain, W/M_S and O in the central plain.
3.1.2 Recharge coefficient
Recharge coefficient, the ratio of magnitude of recharge to total water input (precipitation and irrigation), is a useful parameter that could aid the groundwater resources assessment. As shown in Figure 4, in the piedmont plain, the values under W/M_F, W/M_NI, W/M_S, M, NC, NV, V, and O are 0.24, 0.14, 0.11, 0.19, 0.29, 0.08, 0.27, and 0.06, respectively. In contrast, in the central plain, the values under W/M_F, W/M_NI, M, NC, V, and C are 0.11, 0.11, 0.12, 0.13, 0.18, and 0.04, respectively. The recharge coefficients are greater in the piedmont plain than in the central plain, and the influence of agricultural land-use types on recharge in the piedmont plain is also greater than that in the central plain, which is in consistent with the results found by Zhang et al. (2009a). The soil texture in the central plain is finer than that in the piedmont plain. Even under the same water input amount, a finer textured soil would retain more water in soil profile for evapotranspiration and hence reduce recharge.
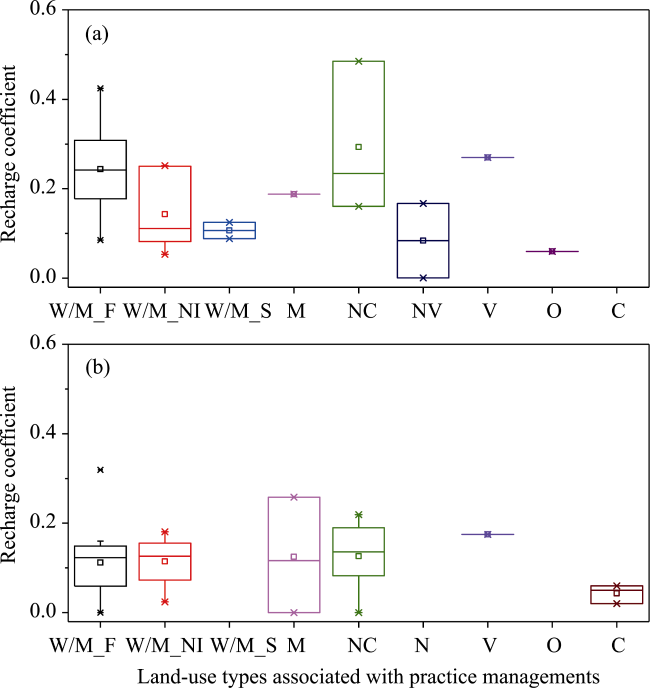
Figure 4 Recharge coefficients under different land use types associated with various management practices at piedmont plain (a) and central plain (b) in the North China Plain

3.2 The “recharge lag” effects

In the piedmont plain, as shown in Figure 5, the average velocities under various land-use types range from 0.2 to 0.7 m/yr, except vegetable land (2.2 m/yr). The average velocities under non-irrigated winter wheat and summer maize (W/M_NI) and sprinkling irrigated winter wheat and summer maize (W/M_S) are lower than those under other land-use types. In comparison, the velocities in the central plain show relatively less variation than those in the piedmont plain, with the values ranging from 0.1 to 0.8 m/yr. It is obvious that the velocity in the central plain is lower than that in the piedmont plain even under the same land-use type, which could be attributed to the lower recharge rate and finer soil texture in the central plain.
As described in section 2.2, there are two indexes referring to solute and water movement in groundwater recharge process, the velocity of soil water displacement (vs) and the rate of wetting front propagation (vwf). Therefore, the term “time lag” may be misleading if the investigating target, soil water displacement or wetting front propagation, is not specified. Some researchers use the term to refer to soil water residence time (Mcmahon et al., 2006; Scanlon et al., 2010; Fenton et al., 2011), whereas others use it to express the water level response time (Mattern and Vanclooster, 2010; Huo et al., 2014). However, the difference between soil water residence time and water level response time is obvious. Little attention has been paid to distinguish these two terms in the NCP, although some very important results concerning these factors have been reported throughout the world (Raats, 1984; Jolly et al., 1989; Scanlon et al., 2007; Dahan et al., 2009; Rossman et al., 2014).
Figure 5 Velocity of soil water displacement under different land use types associated with various management practices at piedmont plain (a) and central plain (b) in the North China Plain
The relationship between the velocity of soil water displacement (vs) and the rate of wetting front propagation (vwf), Eq. (5), could be deduced based on Eq. (1) and Eq. (3) (Raats, 1984; Jolly et al., 1989).
$\frac{{{v}_{s}}}{{{v}_{wf}}}=\frac{q/{{\theta }_{f}}}{q/\Delta \theta }=\frac{\Delta \theta }{{{\theta }_{f}}}=1-\frac{{{\theta }_{i}}}{{{\theta }_{f}}}$ (5)
According to the theoretical analysis, a higher ratio of initial soil water content to final soil water content will lead to a lower ratio of solute front velocity to wetting front velocity. Although Eq. (5) is based on some assumptions, such as ignoring hydrodynamic dispersion and preferential flow and other prerequisites in Eq. (3), the usefulness of the theoretical analysis has been tested by field observations and the observed values match well with the theoretical line (Figure 6). In the NCP, under a typical monitoring site, the solute front velocity is about 0.9 m/yr, and the wetting front velocity is about 47 m/yr. Eq. (5) could well explain the relationship between the ratios of velocities and soil water content. The example of the NCP is plotted in the lower right corner of the figure, which is influenced by the high initial soil water content under the influence of irrigation (Min et al., 2015). The initial water content is high before the infiltration event occurs and the difference between final soil water content (a little higher than field capacity) and initial soil water content is very slight (Min et al., 2015). According to the data on current water table depth (Figure 2), it will take several months for the wetting front to move to the water table, but several years for the solute front.
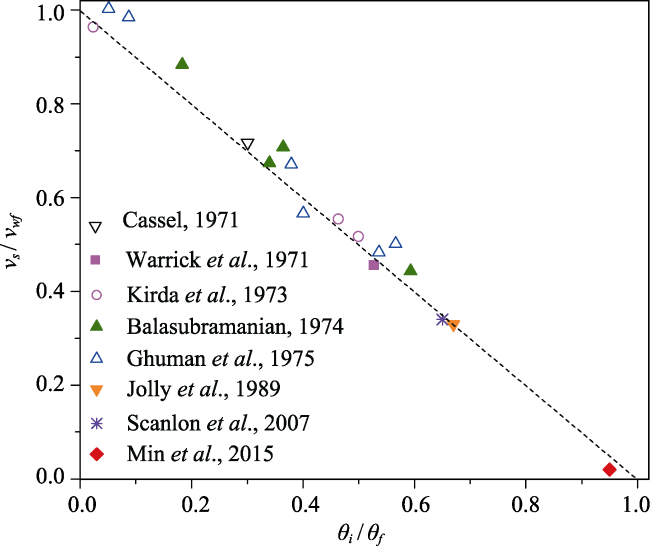
Figure 6 Relationship between solute front and wetting front under the impact of soil water content (modified from Raats, 1984, with new data added). Note the dashed line indicates the theoretical relationship between the two ratios.

3.3 The role of thickening vadose zone in groundwater recharge

Previous researches have revealed that vadose zone thickening may impact total recharge amount, and certainly affect the soil water residence time and water level response time. The influence of vadose zone thickening on recharge amount, however, is dependent on the time scale and water table depth. When the water table depth is shallow and evapotranspiration of groundwater could not be ignored, the magnitude of recharge decreases with the increase of unsaturated zone thickness (Zhang et al., 2007; Cao et al., 2016). When the water table depth is sufficiently deep (more than several meters), recharge will remain at a constant value in the long term despite an increase in the unsaturated zone thickness; however, it tends to decrease in a limited period (Zhang et al., 2007; Cao et al., 2016).
As the vadose zone thickens, the soil water residence time and water level response time are inevitably increased, because of longer path for soil water displacement and wetting front propagation (Eqs. (2) and (4)). According to the calculation, in the piedmont plain, the chemical fertilizer, extensively applied since 1978, has not massively reached to aquifer yet and still stored in the vadose zone, because of water table decline and vadose zone thickening (Min et al., 2018).

3.4 How to improve the accuracy of estimated recharge?

The methods for estimating recharge through vadose zone have been thoroughly reviewed by Scanlon et al. (2002). These methods could be classified into two categories: the first category is based on the soil water balance (e.g. lysimeter and soil water balance method), in which the evapotranspiration is indispensable in calculation; the second method is based on soil physics, such as numerical modeling, zero-flux plane, Darcy’s law and tracers.
The soil water balance based methods, as shown in Eq. (6), are directly related to the soil water storage, precipitation, irrigation, and evapotranspiration.
$q=P+I-ET-\Delta S$ (6)
where q is the recharge (mm); P is precipitation (mm); I is irrigation (mm) and is the change in soil water storage in a given time period (mm). No matter which method is used to estimate recharge, the soil water balance (Eq. (6)) must be followed. Consequently, Eq. (6) could be also used to test and evaluate the estimated results. To improve the accuracy of estimated recharge, the following three aspects should at least be taken into consideration.
3.4.1 Impacts of time scales and soil column depth
Because of variation in amount and intensity of water input (precipitation and irrigation), recharge rate is both time and depth dependent. This variation in recharge rate with soil depth and time scale is shown in Figure 7. The change in soil water storage during a single year in various soil depths is the reason for the variation in recharge rate with soil depth. Based on numerical modeling, a previous study also demonstrates that soil water flux showed more variation with depth at shorter time periods (Min et al., 2015). A calculated period longer than 5 years would lead to the variation in recharge rate less than 10%. Therefore, in the long term, the flux at the depth of 2 m beneath the ground surface could be used to indicate groundwater recharge rate (Min et al., 2015).
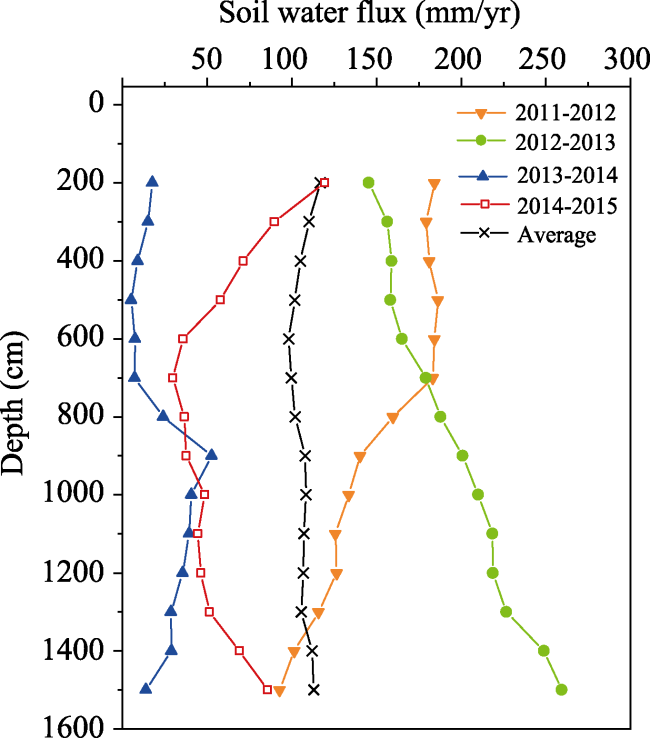
Figure 7 Influence of target soil depth (below the ground surface) on calculated soil water flux. The data (from 2011 to 2015) were observed in Luancheng Agro-Ecosystem Experiment Station, Chinese Academy of Sciences.
The length of calculated periods (time scales) also has impact on the recharge rate. For a more accurate representation, (for example, a maximum deviation of less than 20% from multi-year mean value), research should be conducted over a long period (>12 years) (Min et al., 2015). In fact, in most of the published materials, the long term observation is absent, and the time length of dataset used in such publications is about 2 or 3 years. Recharge coefficient also varies with water input, therefore, the obtained recharge coefficient based on shorter time span (e.g. 2 or 3 years) should not be used directly as the parameter for groundwater resources evaluation.
3.4.2 Uncertainties from water balances components
It could be seen that the uncertainties in precipitation, irrigation, change in soil water storage, and ET undoubtedly lead to uncertainty in recharge. Since annual precipitation varied with locations, its value at a specified ungauged site could be interpolated with a reliable accuracy in plain area. The uncertainty in water input mainly derives from irrigation, because irrigation is not usually measured in the field.
Evapotranspiration is usually measured by lysimeter or eddy covariance system. However, there are two factors resulting in uncertainty. The first one is the scale problem. The measured area of a lysimter is no more than several square meters, while the ET measured by eddy covariance system is at local scale (~200 m × 200 m). The water balance components in a lysimeter are very easily to be identified, while the information on irrigation and change in soil water storage at the local scale are usually absent, because of lacking monitoring on irrigation and soil water content. Spatial heterogeneities in soil properties and soil water content have been extensively verified in field (Warrick, 2003). Soil moisture is always measured at profile scale. Although cosmic-ray neutrons method could provide soil moisture data at local scale (Zreda et al., 2008), the maximum effective depth of cosmic-ray neutrons is no more than 1 m (within the root zone), which limits the utilization of this method in groundwater recharge estimation. The second factor is the accuracy of measured ET, especially using the eddy covariance systems, because of its well-known energy closure problem (Foken, 2008). However, it is still the prevailing method for measuring ET.
From another perspective, because recharge rates cannot be measured directly, and the accuracy is difficult to evaluate, the ET could be estimated using the water balance equation. The estimated ET could be compared with monitored ET using eddy covariance systems or lysimeter, which can help to assess the accuracy of the estimated recharge. Nevertheless, the current researches only use the magnitude or coefficient of recharge as indexes to evaluate the rationality of recharge, disregarding the evaluation of the reliability of ET. That is to say, even though the magnitude of recharge and recharge coefficient seem to be acceptable, their reliability shall still be questioned, if the evapotranspiration is proved to be problematic. Therefore, in estimating groundwater recharge, we strongly suggest that the ET also be evaluated, in combination with the magnitude of recharge and recharge coefficient.
3.4.3 Effects of agricultural land-use type and vegetation type
As discussed in section 3.1, agricultural land use type and vegetation type have significant influences on recharge. Different crop types under various management practices (irrigation, fertilization, and tillage) would result in the differences in evapotranspiration, deep drainage and solute leaching. In recent decades, groundwater recharge has been estimated under different land-use types in many countries (Allison and Hughes, 1983; Cook et al., 1989; Edmunds et al., 2002; McMahon et al., 2006; Scanlon et al., 2010; Huang et al., 2013; Lin et al., 2013; Silburn et al., 2013; Li et al., 2017). Recharge rates and their differences under irrigated agricultural land, rain-fed agricultural land and native ecosystems have been investigated and compared (McMahon et al., 2006; Scanlon et al., 2010; Lin et al., 2013; Silbrun et al., 2013). However, the impact of different irrigated croplands (with different crops) on groundwater recharge has attracted little scientific interest during recent years, and the types of agricultural land are still limited (Wang et al., 2008; Turkeltaub et al., 2015). As we summarized in Table 1 and Figure 1, although some studies begin to this topic, the investigated sites are still very sparse and the repetitions are very limited. Therefore, to obtain a reliable recharge coefficient that can be representative at a large scale, more sites with more types of vegetation should be considered.

4 Conclusions

The study has investigated groundwater recharge under different agro-ecosystems and hydrogeological conditions in the North China Plain. The results revealed that the agricultural land-use types associated with management practices have significant influences on recharge. Recharge amount under vegetables was the highest (320 mm/yr in the piedmont plain and 255.5 mm/yr in the central plain), followed by flood-irrigated winter wheat and summer maize (206.4 mm/yr in the piedmont plain and 92.8 mm/yr in the central plain), and non-cultivated farmland (194.1 mm/yr in the piedmont plain and 85 mm/yr in the central plain) in the NCP. However, the non-cultivated farmland has the highest recharge coefficient in the piedmont plain (0.29), in contrast to vegetable land in the central plain (0.18).
The recharge lag effects should be cognized in two aspects: the time lag of water level response (wetting front move to water table) and the time lag of water quality change (solute transport to water table). Water level change reflecting recharge was controlled by water table depth and rate of wetting front propagation, whereas the water quality change could be roughly evaluated by water table depth and soil water displacement velocity. The soil water displacement velocities range from 0.2 to 2.2 m/yr while the rate of wetting front propagation is approximately 47 m/yr. Therefore, the response time of water level was estimated to lag behind recharge by several months, and the mean travel time of solute transport to water table was about several years in the piedmont plain. Not surprisingly, the soil water displacement velocity also varied among different agricultural land-use types. According to the estimated soil water displacement velocity and water table depth, massive quantities of chemical fertilizers have not yet reached to the water table in the piedmont plain.
Uncertainty in recharge estimation is mainly from the uncertainties in water input, evapotranspiration, and soil moisture measurements. However, the importance of these three items has not been widely and thoroughly recognized, especially regarding ET. Thus, we strongly suggest that the ET be treated as an import item to be evaluated (compared with the measured ones by lysimeter or eddy covariance systems) to ensure the reliability of recharge when recharge is being estimated.
In brief, although some progresses have been achieved in recent years, the current investigation in recharge was only located at very sparse sites compared with the large area of NCP and its various land-use types and vegetation types. The synergistic approach across disciplines, including hydrology, soil physics, agriculture, and hydrogeology, in accordance with the merit of critical zone concept, has not aroused sufficient scientific concern. The lack of sufficient datasets with long time series is another obstacle to obtain more accurate results. The knowledge of soil water movement and solute transport in unsaturated zone (especially in deep vadose zone, far beneath ground surface) under different surface conditions is still limited. Therefore, some long term critical zone observatories, including canopy evapotranspiration, the water content, solute and contaminants concentration in the whole unsaturated zone (including both root zone and deep vadose zone), and groundwater level and solute concentration, need to be established to deepen the understanding of groundwater recharge processes.

The authors have declared that no competing interests exist.

[1]
Allison G B, Hughes M W, 1983. The use of natural tracers as indicators of soil-water movement in a temperate semi-arid region.Journal of Hydrology, 60(1-4): 157-173.

DOI

[2]
Balasubramanian V, 1974. Adsorption, denitrification, and movement of applied ammonium and nitrate in Hawaiian soils [D]. Manoa: University of Hawaii.

[3]
Cao G L, Scanlon B R, Han D Met al., 2016. Impacts of thickening unsaturated zone on groundwater recharge in the North China Plain.Journal of Hydrology, 537: 260-270.

DOI

[4]
Cao G L, Zheng C M, Scanlon B Ret al., 2013. Use of flow modeling to assess sustainability of groundwater resources in the North China Plain.Water Resources Research, 49(1): 159-175.

DOI

[5]
Cassel D K, 1971. Water and solute movement in Svea loam for two water management regimes.Soil Science Society of America Journal, 35(6): 859-866.

DOI

[6]
Cook P G, Walker G R, Jolly I D, 1989. Spatial variability of groundwater recharge in a semiarid region.Journal of Hydrology, 111(1-4): 195-212.

DOI

[7]
Dahan O, Talby R, Yechieli Yet al., 2009. In situ monitoring of water percolation and solute transport using a vadose zone monitoring system.Vadose Zone Journal, 8(4): 916-925.

DOI

[8]
Edmunds W M, Fellman E, Goni I Bet al., 2002. Spatial and temporal distribution of groundwater recharge in northern Nigeria.Hydrogeology Journal, 10(1): 205-215.

DOI

[9]
Fang Q X, Green T R, Ma L Wet al., 2010. Optimizing soil hydraulic parameters in RZWQM2 under fallow conditions.Soil Science Society of America Journal, 74(6): 1897-1913.

DOI

[10]
Fei J, 1988. Groundwater resources in the North China Plain.Environmental Geology and Water Sciences, 12(1): 63-67.

DOI

[11]
Fenton O, Schulte R P O, Jordan Pet al., 2011. Time lag: A methodology for the estimation of vertical and horizontal travel and flushing timescales to nitrate threshold concentrations in Irish aquifers.Environmental Science & Policy, 14(4): 419-431.

[12]
Foken T, 2008. The energy balance closure problem: An overview.Ecological Applications, 18(6): 1351-1367.

DOI

[13]
Ghuman B S, Verma S M, Prihar S S, 1975. Effect of application rate, initial soil wetness, and redistribution time on salt displacement by water.Soil Science Society of America Journal, 39(1): 7-10.

DOI

[14]
Guo L, Lin H, 2016. Critical zone research and observatories: Current status and future perspectives. Vadose Zone Journal, 15(9). doi: 10.2136/vzj2016.06.0050.

[15]
Guo Y, Shen Y J, 2015. Quantifying water and energy budgets and the impacts of climatic and human factors in the Haihe River Basin, China: 1. Model and validation.Journal of Hydrology, 528: 206-216.

DOI

[16]
Healy R W, Scanlon B R, 2010. Estimating Groundwater Recharge. Cambridge: Cambridge University Press.

[17]
Huang T M, Pang Z H, Edmunds W M, 2013. Soil profile evolution following land-use change: Implications for groundwater quantity and quality.Hydrological Processes, 27(8): 1238-1252.

DOI

[18]
Huo S Y, Jin M G, Liang Xet al., 2014. Changes of vertical groundwater recharge with increase in thickness of vadose zone simulated by one-dimensional variably saturated flow model.Journal of Earth Science, 25(6): 1043-1050.

DOI

[19]
Jolly I D, Cook P G, Allison G Bet al., 1989. Simultaneous water and solute movement through an unsaturated soil following an increase in recharge.Journal of Hydrology, 111(1-4): 391-396.

DOI

[20]
Jury W A, Horton R, 2004. Soil Physics. 6th ed. Hoboken: John Wiley & Sons.

[21]
Kirda C, Nielsen D R, Biggar J W, 1973. Simultaneous transport of chloride and water during infiltration.Soil Science Society of America Journal, 37(3): 339-345.

DOI

[22]
Lei Z D, Yang S C, Ni G Het al., 1992. Water continuum feature in response to the type of groundwater level.Journal of Hydraulic Engineering, 23(2): 1-6. (in Chinese)

[23]
Li X D, Zhao Y, Xiao W Het al., 2017. Soil moisture dynamics and implications for irrigation of farmland with a deep groundwater table.Agricultural Water Management, 192: 138-148.

DOI

[24]
Li Z, Chen X, Liu W Zet al., 2017. Determination of groundwater recharge mechanism in the deep loessial unsaturated zone by environmental tracers.Science of the Total Environment, 586: 827-835.

DOI

[25]
Lin D, Jin M G, Liang Xet al., 2013. Estimating groundwater recharge beneath irrigated farmland using environmental tracers fluoride, chloride and sulfate.Hydrogeology Journal, 21(7): 1469-1480.

DOI

[26]
Liu J, Chen Z Y, Zhang Z Jet al., 2009. Estimation of natural groundwater recharge in the Hutuo River alluvial-proluvial fan using environmental tracers.Geological Science and Technology Information, 28(6): 114-118. (in Chinese)

[27]
Lu X H, Jin M G, Van Genuchten M Tet al., 2011. Groundwater recharge at five representative sites in the Hebei Plain, China.Ground Water, 49(2): 286-294.

DOI

[28]
Mattern S, Vanclooster M, 2010. Estimating travel time of recharge water through a deep vadose zone using a transfer function model.Environmental Fluid Mechanics, 10(1/2): 121-135.

DOI

[29]
Mcmahon P B, Dennehy K F, Bruce B Wet al., 2006. Storage and transit time of chemicals in thick unsaturated zones under rangeland and irrigated cropland, High Plains, United States. Water Resources Research, 42(3): 10.1029/2005WR004417.

[30]
Min L L, Shen Y J, Pei H W, 2015. Estimating groundwater recharge using deep vadose zone data under typical irrigated cropland in the piedmont region of the North China Plain.Journal of Hydrology, 527: 305-315.

DOI

[31]
Min L L, Shen Y J, Pei H Wet al., 2018. Water movement and solute transport in deep vadose zone under four irrigated agricultural land-use types in the North China Plain.Journal of Hydrology, 559: 510-522.

DOI

[32]
National Research Council (NRC), 2001. Basic research opportunities in earth science. Washington, DC: National Academy Press.

[33]
Philip J R, 1957. The theory of infiltration: 2. The profile of infinity.Soil Science, 83(6): 435-448.

DOI

[34]
Raats P A C, 1984. Tracing parcels of water and solutes in unsaturated zones. In: Yaron B, Dagan G, Goldshmid J (eds.). The Unsaturated Zone between Soil Surface and Groundwater. Heidelberg: Springer-Verlag.

[35]
Rossman N R, Zlotnik V A, Rowe C Met al., 2014. Vadose zone lag time and potential 21st century climate change effects on spatially distributed groundwater recharge in the semi-arid Nebraska Sand Hills.Journal of Hydrology, 519: 656-669.

DOI

[36]
Scanlon B R, Healy R, Cook P, 2002. Choosing appropriate techniques for quantifying groundwater recharge.Hydrogeology Journal, 10(1): 18-39.

DOI

[37]
Scanlon B R, Reedy R C, Gates J B, 2010. Effects of irrigated agroecosystems: 1. Quantity of soil water and groundwater in the southern High Plains, Texas. Water Resources Research, 46(9). doi: 10.1029/2009WR008427.

[38]
Scanlon B R, Reedy R C, Tachovsky J A, 2007. Semiarid unsaturated zone chloride profiles: Archives of past land use change impacts on water resources in the southern High Plains, United States. Water Resources Research, 43(6). doi: 10.1029/2006WR005769.

[39]
Silburn D M, Foley J L, Biggs A J Wet al., 2013. The Australian cotton industry and four decades of deep drainage research: A review.Crop & Pasture Science, 64(11/12): 1049-1075.

[40]
Sun H Y, Shen Y J, Yu Qet al., 2010. Effect of precipitation change on water balance and WUE of the winter wheat-summer maize rotation in the North China Plain.Agricultural Water Management, 97: 1139-1145.

DOI

[41]
Tan X C, Wu J W, Cai S Yet al., 2014. Characteristics of groundwater recharge on the North China Plain.Groundwater, 52(5): 798-807.

DOI

[42]
Tan X C, Yang J Z, Song X H, 2013. Estimation of groundwater recharge in North China Plain.Advances in Water Science, 24(1): 73-81. (in Chinese)

[43]
Turkeltaub T, Kurtzman D, Russak E Eet al., 2015. Impact of switching crop type on water and solute fluxes in deep vadose zone.Water Resources Research, 51(12): 9828-9842.

DOI

[44]
Wang B G, Jin M G, Nimmo J Ret al., 2008. Estimating groundwater recharge in Hebei Plain, China under varying land use practices using tritium and bromide tracers.Journal of Hydrology, 356(1/2): 209-222.

DOI

[45]
Wang H Y, Pan X P, Luo Jet al., 2015. Using remote sensing to analyze spatiotemporal variations in crop planting in the North China Plain.Chinese Journal of Eco-Agriculture, 23(9): 1199-1209. (in Chinese)

[46]
Warrick A W, 2003. Soil Water Dynamics. New York: Oxford University Press.

[47]
Warrick A W, Biggar J W, Nielsen D R, 1971. Simultaneous solute and water transfer for an unsaturated soil.Water Resources Research, 7(5): 1216-1225.

DOI

[48]
Wu C, Xu Q H, Zhang X Qet al., 1996. Palaeochannels on the North China Plain: Types and distributions.Geomorphology, 18(1): 5-14.

DOI

[49]
Yuan R Q, Song X F, Han D Met al., 2011. Rate and historical change of direct recharge from precipitation constrained by unsaturated zone profiles of chloride and oxygen-18 in dry river bed of North China Plain.Hydrological Processes, 26(9): 1291-1301.

[50]
Yuan Z J, Shen Y J, 2013. Estimation of agricultural water consumption from meteorological and yield data: A case study of Hebei, North China. Plos One, 8(3). doi: 10.1371/journal.pone.0058685.

[51]
Zhang G H, Fei Y H, Shen J M, 2007. Influence of unsaturated zone thickness on precipitation infiltration for recharge of groundwater.Journal of Hydraulic Engineering, 38(5): 611-617. (in Chinese)

[52]
Zhang Z, Fei Y, Chen Z et al., 2009a. The Investigation and Evaluation of Sustainable Utilization of Groundwater Resources in North China Plain. Beijing: Geological Press. (in Chinese)

[53]
Zhang Z, Luo G, Wang Zet al., 2009b. Study on sustainable utilization of groundwater in North China Plain.Resources Science, 31(3): 355-360. (in Chinese)

[54]
Zheng C M, Liu J, Cao G Let al., 2010. Can China cope with its water crisis? Perspectives from the North China Plain.Ground Water, 48(3): 350-354.

DOI

[55]
Zreda M, Desilets D, Ferre T P Aet al., 2008. Measuring soil moisture content non-invasively at intermediate spatial scale using cosmic-ray neutrons.Geophysical Research Letters, 35(21): L21402.

DOI

Outlines

/