
Journal of Geographical Sciences >
Spatio-temporal patterns of drought evolution over the Beijing-Tianjin-Hebei region, China
Author: Zhang Jie, PhD, specialized in climate change and hydrological process. E-mail: zhangjie@igsnrr.ac.cn
Received date: 2018-05-12
Accepted date: 2018-11-23
Online published: 2019-06-25
Supported by
National Key Research and Development Program of China, No.2016YFC0401401, No.2016YFA0602402
Key Program of the Chinese Academy of Sciences, No.ZDRW-ZS-2017-3-1
The Chinese Academy of Sciences (CAS) Pioneer Hundred Talents Program
National Natural Science Foundation of China, No.41601035
Copyright
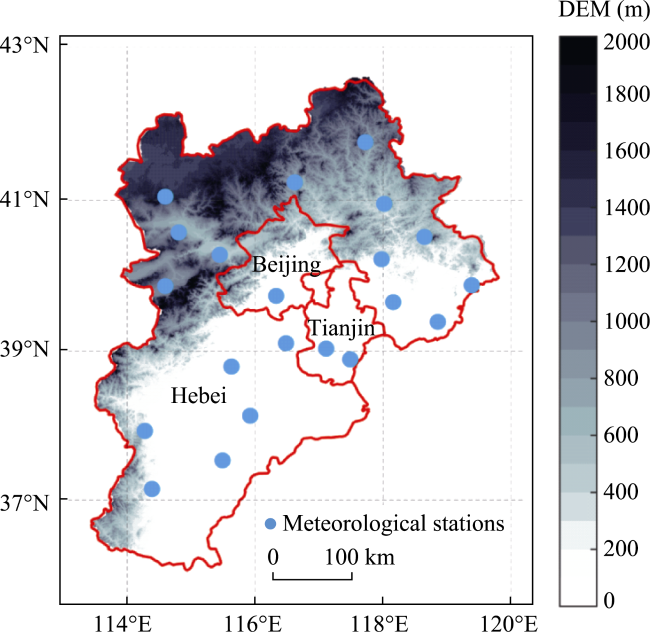
Spatio-temporal patterns of drought from 1961 to 2013 over the Beijing-Tianjin-Hebei (BTH) region of China were analyzed using the Palmer Drought Severity index (PDSI) based on 21 meteorological stations. Overall, changes in the mean-state of drought detected in recent decades were due to decreases in precipitation and potential evapotranspiration. The Empirical Orthogonal Functions (EOF) method was used to decompose drought into spatio-temporal patterns, and the first two EOF modes were analyzed. According to the first leading EOF mode (48.5%), the temporal variability (Principal Components, PC1) was highly positively correlated with annual series of PDSI (r=+0.99). The variance decomposition method was further applied to explain the inter-decadal temporal and spatial variations of drought relative to the total variation. We find that 90% of total variance was explained by time variance, and both total and time variance dramatically decreased from 1982 to 2013. The total variance was consistent with extreme climate events at the inter-decadal scale (r=0.71, p<0.01). Comparing the influence of climate change on the annual drought in two different long-term periods characterized by dramatic global warming (P1: 1961-1989 and P2: 1990-2013), we find that temperature sensitivity in the P2 was three times more than that in the P1.
Key words: PDSI; spatial and temporal patterns; sensitivity analysis; global warming
ZHANG Jie , SUN Fubao , LIU Wenbin , LIU Jiahong , WANG Hong . Spatio-temporal patterns of drought evolution over the Beijing-Tianjin-Hebei region, China[J]. Journal of Geographical Sciences, 2019 , 29(6) : 863 -876 . DOI: 10.1007/s11442-019-1633-y
Figure 1 Location of the study area and selected sites in the BTH region |
Table 1 Drought classifications using PDSI |
| Drought class | PDSI values | Drought class | PDSI values |
|---|---|---|---|
| Extreme wet | PDSI>4 | Extreme drought | PDSI<-4 |
| Severe wet | 3<PDSI≤4 | Severe drought | -4<PDSI≤-3 |
| Moderate wet | 2<PDSI≤3 | Moderate drought | -3<PDSI≤-2 |
| Mild wet | 1<PDSI≤2 | Mild drought | -2<PDSI≤-1 |
| Normal | -1<PDSI≤1 |
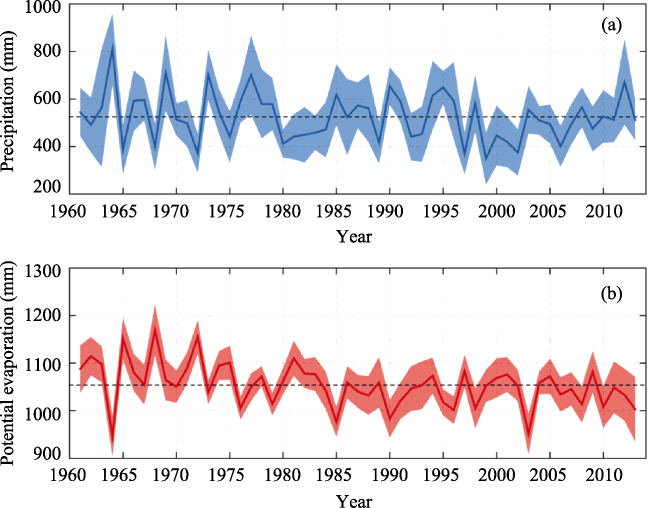
Figure 2 Changes in P and PET over the BTH region from 1961-2013 (the shaded range in both of subplots are estimated from$\sqrt{\sigma }/n$, where n is 21) |
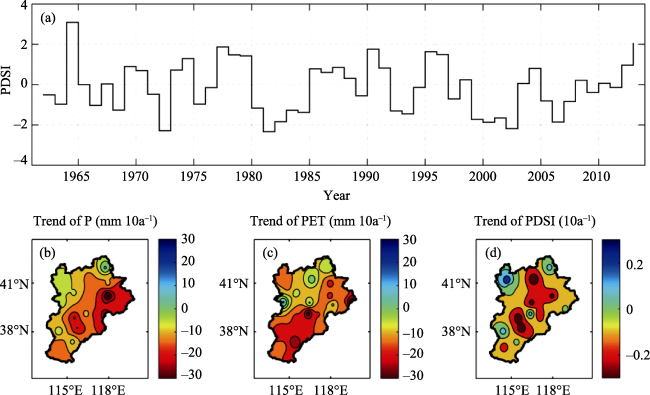
Figure 3 Drought analyses for 1960-2013, time series of annual PDSI (a) and spatial patterns for P trends (b), PET trends (c), and PDSI trends (d) |
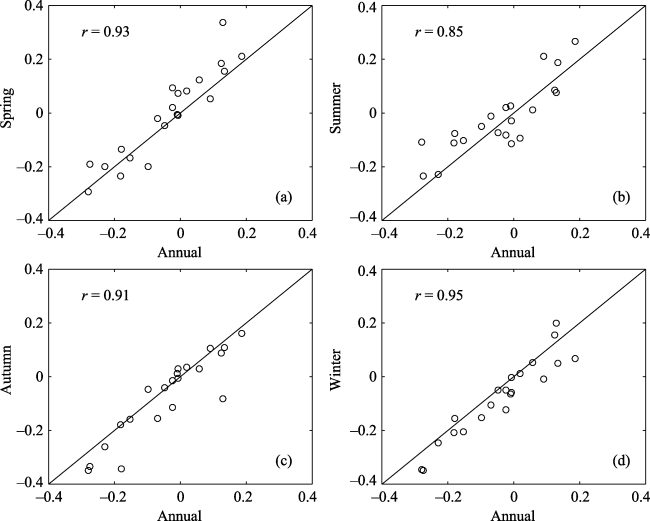
Figure 4 Correlation between PDSI trends on annual and seasonal scales (from spring to winter) |
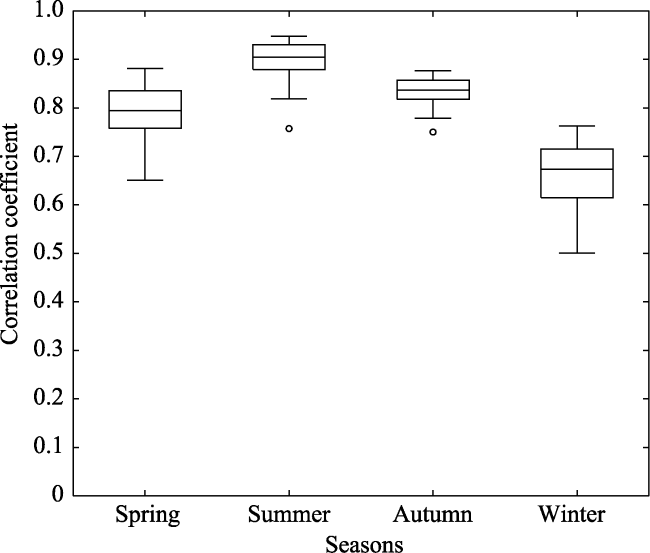
Figure 5 Boxplot of correlation coefficients between seasonal and annual PDSI series |
Table 2 Variance contribution (%) of annual PDSI from the first six leading EOFs modes |
| EOF1 | EOF2 | EOF3 | EOF4 | EOF5 | EOF6 | |
|---|---|---|---|---|---|---|
| Contribution (%) | 48.2 | 10.8 | 9.8 | 4.9 | 4.5 | 4.3 |
| Cumulation (%) | 48.2 | 59.0 | 68.8 | 73.7 | 78.2 | 82.5 |
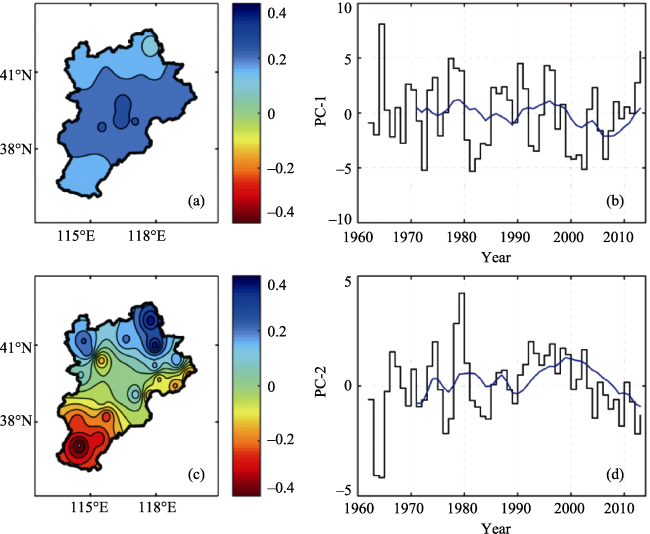
Figure 6 Spatial (left) and temporal (right) patterns of the first two leading EOFs for annual PDSI. The blue line indicates the 10-year moving average of PCs in (b) and (d). |
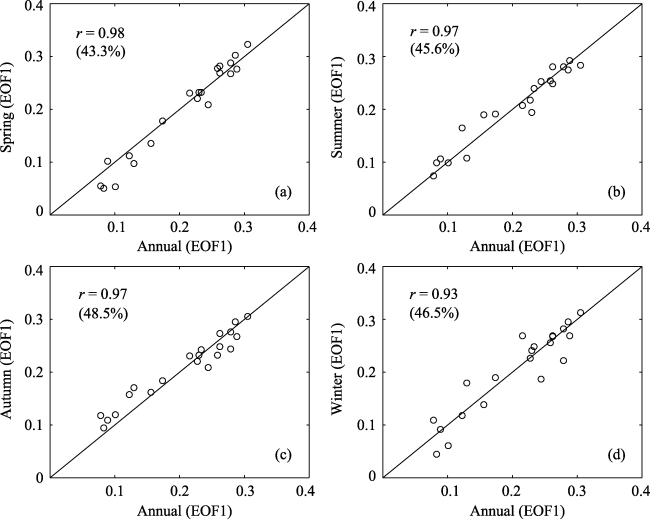
Figure 7 Correlation between annual and seasonal EOF for EOF1 |
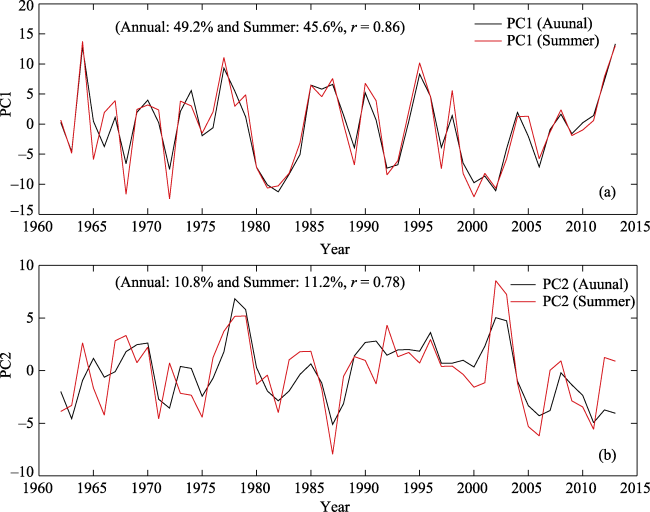
Figure 8 Correlation between annual PC and summer PC for EOF1 (a) and EOF2 (b) |
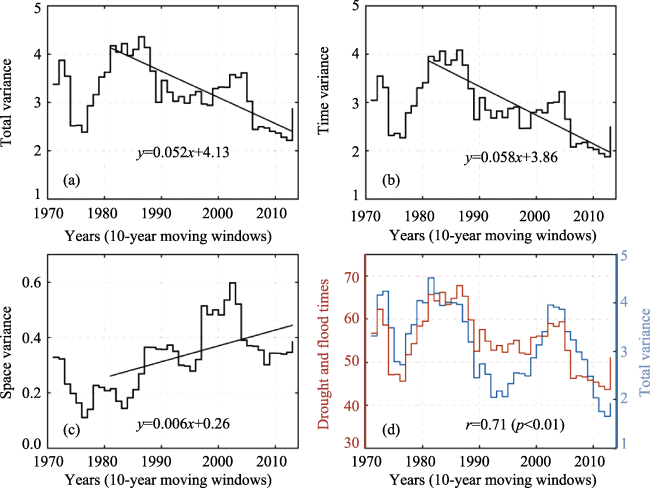
Figure 9 Variance decomposition for 10-year PDSI (10-year moving window) from 1982-2013. (a) Total variance, which decreases (-0.052·a-1). (b) Time variance, which decreases (-0.058·a-1). (c) Spatial variance, which increases (0.006·a-1). (d) Comparison between total variance and the frequency of extreme events (PDSI<-2 and PDSI>2). |
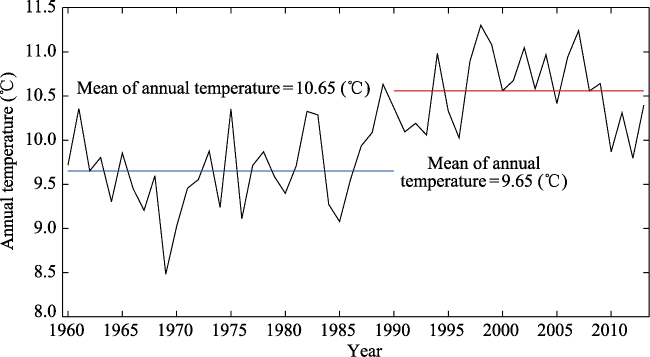
Figure 10 Mean annual temperature from 1961 to 2013 over the BTH region |
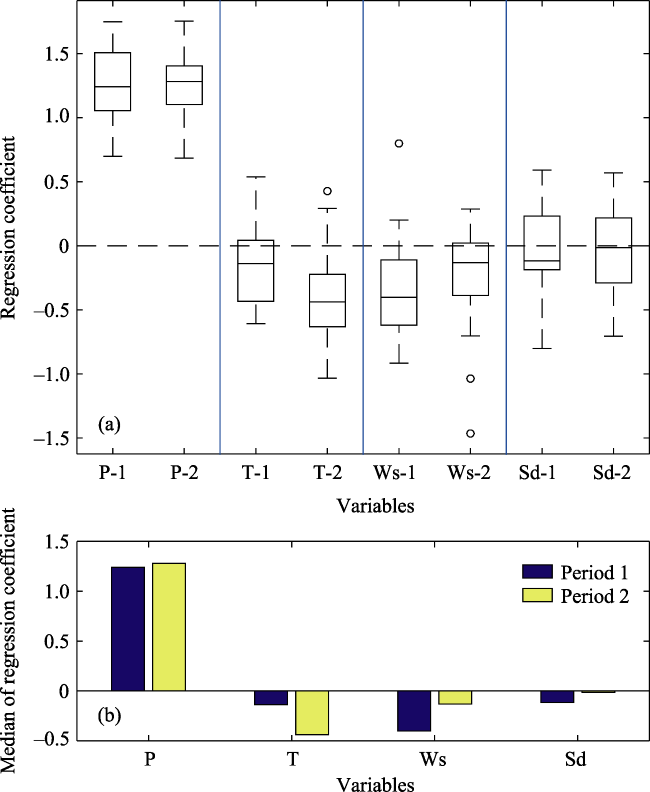
Figure 11 Drought sensitivity analysis using regression coefficients from multiple linear regression, (a) boxplot of regression coefficients and (b) regression coefficient median values |
The authors have declared that no competing interests exist.
| [1] |
|
| [2] |
|
| [3] |
|
| [4] |
|
| [5] |
|
| [6] |
|
| [7] |
|
| [8] |
|
| [9] |
|
| [10] |
|
| [11] |
|
| [12] |
|
| [13] |
|
| [14] |
|
| [15] |
|
| [16] |
|
| [17] |
|
| [18] |
|
| [19] |
|
| [20] |
|
| [21] |
|
| [22] |
|
| [23] |
|
| [24] |
|
| [25] |
|
| [26] |
|
| [27] |
|
| [28] |
|
| [29] |
|
| [30] |
|
| [31] |
|
| [32] |
|
| [33] |
|
| [34] |
|
| [35] |
|
| [36] |
|
| [37] |
|
| [38] |
|
| [39] |
|
| [40] |
|
/
| 〈 |
|
〉 |