Regular Articles

Sediment load change with erosion processes under simulated rainfall events

  • SUN Liying 1, 2 ,
  • FANG Haiyan 2 ,
  • CAI Qiangguo 2, 6 ,
  • YANG Xihua 3 ,
  • HE Jijun 4 ,
  • ZHOU John L. 5 ,
  • WANG Xunming 2
Expand
  • 1. State Key Laboratory of Soil Erosion and Dryland Farming on the Loess Plateau, Institute of Soil and Water Conservation, CAS&MWR, Yangling 712100, Shaanxi, China
  • 2. Key Laboratory of Water Cycle and Related Land Surface Processes, Institute of Geographic Sciences and Natural Resources Research, CAS, Beijing 100101, China
  • 3. New South Wales Office of Environment and Heritage, PO Box 644, Parramatta, NSW 2124, Australia
  • 4. Base of the State Laboratory of Urban Environmental Processes and Digital Modeling, Capital Normal University, Beijing 100048, China
  • 5. School of Civil and Environmental Engineering, University of Technology Sydney, 15 Broadway, NSW 2007, Australia
  • 6. College of Resources and Environment, University of Chinese Academy of Sciences, Beijing 100049, China

Author: Sun Liying (1978-), Associate Professor, specialized in soil erosion and risk analysis. E-mail:

Received date: 2018-06-19

  Accepted date: 2018-07-12

  Online published: 2019-06-25

Supported by

National Natural Science Foundation of China, No.41471229

The Open Project Fund from the State Key Laboratory of Soil Erosion and Dryland Farming on Loess Plateau, No.A314021402-1601

National Key Research and Development Program of China, No.2016YFA0601900

Copyright

Journal of Geographical Sciences, All Rights Reserved

Abstract

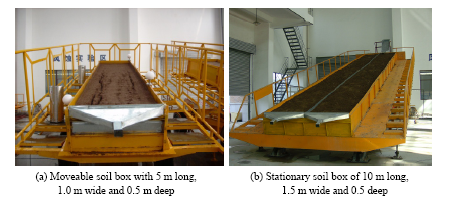
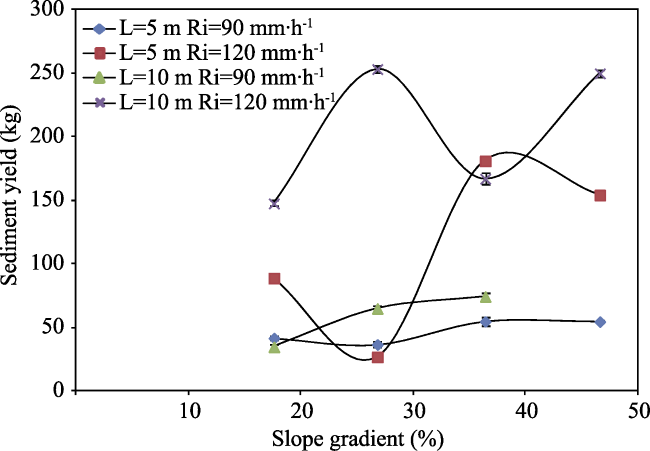
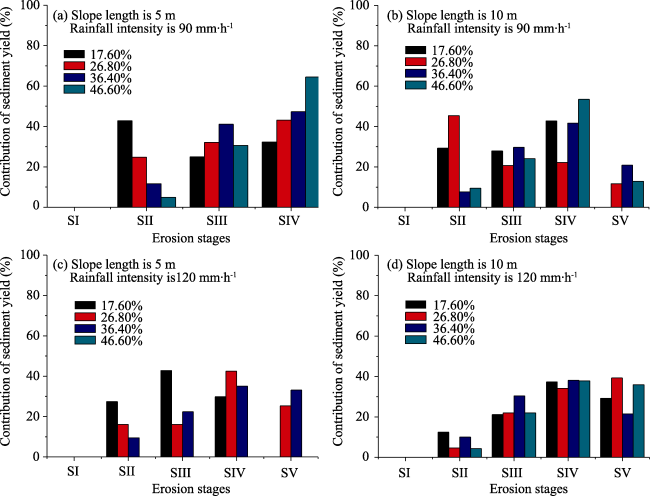
It is of great significance to quantify sediment load changing with erosion processes for improving the precision of soil loss prediction. Indoor rainfall experiments were conducted in 2 rainfall intensities (90 mm·h-1 and 120 mm·h-1), four slope gradients (17.60%, 26.80%, 36.40%, 46.60%) and 2 slope lengths (5 m, 10 m). Erosion processes are divided into five stages. Results show that sediment yield is mainly sourced from rill erosion, contributing from 54.60% to 95.70% and the duration of which is extended by slope gradients. Sediment load and sediment concentration are significantly different along erosion stages, with the highest values in rill development stage (SIV). Surface flow velocities (interrill and rill) demonstrate less significant differences along erosion stages. Rainfall intensity increases sediment load in all stages, with up to 12.0 times higher when changing from 90 to 120 mm·h-1. There is an increasing trend for sediment load and sediment concentration with the rising slope gradient, however, fluctuations existed with the lowest values on 26.80% and 36.40%, respectively, among different treatments. The slope gradient effects are enhanced by rainfall intensity and slope length. Results from this study are important for validating and improving hillslope erosion modelling at each erosion stage.

Cite this article

SUN Liying , FANG Haiyan , CAI Qiangguo , YANG Xihua , HE Jijun , ZHOU John L. , WANG Xunming . Sediment load change with erosion processes under simulated rainfall events[J]. Journal of Geographical Sciences, 2019 , 29(6) : 1001 -1020 . DOI: 10.1007/s11442-019-1641-y

1 Introduction

Soil erosion is defined as ‘a process of detachment and transport of soil materials by erosive agents’ (Ellison, 1947). Despite extensive research on soil and water conservation, soil erosion is still one of the major agricultural problems worldwide (He et al., 2014; Slimane et al., 2016). Generally, sediment transport processes include those on the surface of the hillslope and those in gullies or river beds, which are dominated by totally different hydraulic conditions (Bryan, 2000; Abderrezzak et al., 2014; Li et al., 2017; Song et al., 2017; Garzon-Garcia et al., 2018). Sediment load by hillslope erosion is specifically focused on in this study. Slope erosion develops from interrill erosion (splash and sheet erosion) to rill erosion (Auerswald et al., 2009; Fang et al., 2014). Sheet erosion is driven by splash detachment and overland flow (Merz and Bryan, 1993; Yang et al., 2006). Rills may occur and be dominated by concentrated flow when certain hydraulic conditions are reached (Yang et al., 2006).
Interrill and rill processes have considerable differences in their contribution to soil removal (Wirtz et al., 2012). The sediment detachment and transportation by interrill erosion is mainly determined by the hydraulic parameters under the disturbance of rainfall (Moss and Green, 1983; Beuselinck et al., 2002; Brodie and Rosewell, 2007). In contrast, rill erosion is dominated by the concentrated flow, and influenced by soil texture in addition, with less response to rain drop impacts (Bryan, 2000; Govers et al., 2007; Romero et al., 2007). Rill erosion is the most important process for soil loss on hill slopes, the contribution of which could be up to 90% (Fang et al., 2014; He et al., 2014). Hence, most experimental work both in the laboratory (Bennett, 1999; Polyakov and Nearing, 2003) and under field conditions (Torri et al., 2012; Wirtz et al., 2012) has been conducted to investigate rill erosion. The interests are concentrated on the threshold conditions for rills (Merz and Bryan, 1993), runoff and sediment transportation in rills (Polyakov and Nearing, 2003; Yan et al., 2008; Fang et al., 2014) and estimating the hydraulic parameters in rills (Foster et al., 1984; Govers, 1992; Lei et al., 2008).
In many process-based erosion models, the separation of rill and interrill erosion is of significance to improve the precision on sediment load prediction (Rose et al., 1983; Merritt, 1984; Nearing et al., 1989). Previous research made effort on the division of the erosion processes and quantified the flow hydraulic changes in different stages (Sun et al., 2013). For example, Ellison (1947) tried to divide the water erosion process on slope into four sub-processes: rainfall erosion process, runoff erosion process, raindrop transport process and runoff transport process. Merritt (1984) presented four stages identifying rill formation process: sheet flow, flow line development, micro-rills and micro-rills with head-cuts. However, the differences of sediment yields among erosion processes are not clearly understood and quantified (Zhang et al., 2010). Currently, the soil erosion models normally neglected the dynamic distribution of runoff between rill and interrill flow, with even less consideration for the initiation, development and temporal evolution of rill network (Berger et al., 2010).
Several factors e.g. rainfall, slope gradient, slope length, and soil type, may have significant impacts on erosion processes (Sun et al., 2013; Fang et al., 2014; Zhang et al., 2018). For example, Berger et al. (2010) indicated that rainfall intensity has greater effects than slope gradient on rill development and sediment load. Martinez-mena et al. (2002) suggested that rainfall intensity is the most significant factor impacting the erosion processes in the calcareous colluvial soil and marl soil, respectively. Additionally, the impacts of slope gradient on soil erosion would change when slope steepness reaches thresholds (Liu et al., 1994; Sun et al., 2013). These factors may have complex impacts on erosion process and sediment loads, which are still an issue of unclear description. Up to date, numerous experiments have been carried out on the Loess Plateau for different purposes under various conditions (Table 1). Yet, few of them are focused on the changing sediment load and flow velocity along erosion stages. The aims of this research were therefore to divide the erosion process on loess slopes by conducting laboratory simulation experiments, and to identify how the soil erosion characteristics changed with the erosion process under different experimental treatments. The results would improve our understanding of the variables changing during erosion processes with the evolution of rills, which will be critical for validating and improving erosion modelling on hillslope.
Table 1 Experimental investigations in the Loess Plateau
Experimental conditions Research purpose Research results Reference
Rainfall intensity (mm·h-1) Slope gradient (%) Slope length (m)
×slope width (m)
120 17.60 1.5×0.2 Soil crust impacts on erosion The spatial distribution of soil crust has significant impacts on sediment yield. Lu et al., 2017
90 8.80/17.60/ 26.80 4.0×1.0 Tillage practices and slope impacts on erosion Artificial digging, artificial hoeing and contour plow are efficient soil conservation measures, however, their capacity decreases with rising slope gradient. Wang et al., 2017
48/ 60/90, 120/138/
150
12.23/17.63/
26.80/36.40/
40.40/46.63
1.4×1.2 Sheet erosion modeling on steep slopes Sheet erosion rate increases with rainfall intensity and slope gradient as a power function. Wu et al., 2017
30/45/60/
90/120
8.80/17.60/ 26.80/36.40 1.2×0.8 Runoff features of pasture and crop slopes Vegetation has important impacts on runoff, as both delaying the time to runoff occurrence and reducing runoff coefficient. Zhao et al., 2014
120 26.80/36.40/
46.60
5.0×1.0 Zonal characteristics of sediment-bound organic carbon loss The transportation of sediment and its related organic carbon is non-selective and the soil organic carbon loss is linearly correlated with sediment loads. Li et al., 2017
120 26.80/36.40/
46.60
5.0×1.0 Size selectivity of eroded sediment on steep slopes Rills are prone to transport coarser particles due to the higher flow depth and runoff energy and clay-sized particles are transported as aggregates. Wang and Shi, 2015
50/75/100 17.63/26.80/
36.40
10.0×1.5 Rainfall intensity and slope gradient impacts on erosion Rainfall intensity has greater impact on rill erosion than slope gradient. Shen et al., 2016
90/120 17.60/26.80/
36.40/46.60
5.0×1.0 Rainfall and slope gradient impacts on erosion The rising of rainfall intensity reduces runoff but increases sediment yield. Fang et al., 2014
90 17.60/26.80/
36.40/46.60
5.0×1.0 Slope gradient impacts on rill erosion Rill erosion is enhanced by steeper slopes. He et al., 2016
Table 1 Continued (To be continued on the next page)
Experimental conditions Research purpose Research results Reference
Rainfall intensity (mm·h-1) Slope gradient (%) Slope length (m)
×slope width (m)
90/120 17.60 5.0×1.0 Rill erosion on two soils Soil texture has a major impact on the formation of rills. He et al., 2014
50/100 17.60 8.0×1.5 Rainfall intensity and inflow rate effects on erosion Rainfall intensity has greater impact on both the rates and the fluctuations of soil loss on hillslope than inflow rate. Wen et al., 2015
50/100 26.80 10.0×3.0 Rill erosion and morphology Rainfall intensity has significant impacts on rill development rate and rill morphology variations. Shen et al., 2015
50/100 8.80/17.60 8.0×1.5 Raindrop impact and runoff detachment effects on erosion Raindrop impact results in higher amounts of soil loss than runoff detachment. Lu et al., 2016
48/120 12.23/17.63/
26.80/36.40/40.40/46.63
1.4×1.2 Discrimination of transport-limited and detachment- limited processes Slope gradient and rainfall intensity have impacts on the relationships between interrill erosion rate and splash detachment rate Wu et al., 2018
48/62/102/149/170 17.60/26.80/
36.40/46.60/57.70
Slope length:
0.4/0.8/1.2/1.6/2
Interrill soil erosion processes on steep slopes Rainfall intensity has significant impacts on both soil detachment and sediment transportation. Zhang and Wang, 2017
25/50/75/100 10.00 1.2×1.2 Micro-relief impacts on erosion Crusts increase runoff and sediment yield regardless of the impacts of tillage treatments. Zhao
et al., 2016
40/60/80 17.60 2.0×1.0 Structural and depositional crusts on soil erosion Both mounds and depressions delay the time to runoff, but have different impacts on sediment transportation. Sediment delivery is increased by mounds, whilst is decreased by depressions. Wu et al., 2016
40/90 26.80 2.0×1.0 Soil surface roughness effects on erosion Sheet erosion is dominated by soil surface roughness for all treatments Zheng et al., 2014
80 17.60 4.0×1.0 Soil crust and crop effects on erosion Crusts increase runoff and decrease soil loss, and crops enhance such effects Ma et al., 2014
90 26.80 2.0×1.0 Rainfall kinetic energy impacts on erosion Sediments are prone to be transported as primary particles at higher rainfall kinetic energy Wang et al., 2014b
90 7.60/26.80/
36.40/46.60
5.0×1.0 Sediment sorting associated with erosion on steep slopes Suspension-saltation transportation of the finer particle (<0.054 mm) is dominated by interrill erosion, whilst bed-load transportation of medium to large-sized sediment particles (>0.152 mm) become more important in rills. Shi et al., 2012
50/75/100 26.80 8.0×2.0 Slope length effects on erosion Runoff discharge increases with rising of slope length and slope gradient, whilst sediment yield fluctuated with slope length. Wang and Zheng, 2008
Table 1 Continued (To be continued on the next page)
Experimental conditions Research purpose Research results Reference
Rainfall intensity (mm·h‒1) Slope gradient (%) Slope length (m)
×slope width (m)
70/90 36.40 3.0×1.5
2.0×1.5
Up-slope runoff and sediment concentration effects on erosion Up-slope runoff and sediment concentration have significant impacts on soil loss and rill development in the down-slope. Zheng and Gao, 2004
60/90/120 17.60/26.80/
36.40/46.60
5.0×1.0
10.0×1.5
Hydrodynamic characteristics in rills Resistance coefficients in rills are mainly dependent on Reynolds number, which is closely related to flow velocity. Wang
et al., 2014a
90/120 17.60/26.80/
36.40/46.60
5.0×1.0 Comparison of hydrodynamic parameters between rill and inter-rill flows Mean flow velocity in rills is larger than that in interrill areas. Wang
et al., 2013
90 17.60/46.60 10.0×1.5 Rill morphology impacts on erosion Rill morphology changes when erosion patterns developed from headward erosion to bank landslip. Sheng
et al., 2017

2 Materials and methods

2.1 Artificial rainfall experiments

Simulated rainfall experiments were conducted in the State Key Laboratory of Soil Erosion and Dryland Farming on the Loess Plateau, Yangling, China in 2011. According to the previous study (Zhou and Wang, 1987), the erosive storm rainfall standard (Is) in the Loess Plateau is 1.52 mm·min‒1. Hence, the artificial rainfall intensities were set at 90 mm·h‒1 (Is) and 120 mm·h‒1 (1.3 Is), with durations of 60 min and 45 min, respectively. The runoff and sediment yield were comparable at the cumulative rainfall of 90 mm. Slope gradients were set at 17.60%, 26.80%, 36.40% and 46.60%. The experimental slope lengths were set at 5.0 m and 10.0 m.

2.2 Laboratory equipment

A down-flow multiple-intensity rainfall simulation system was used for all experiments with an electronic central controller. The artificial rainfall simulator covers an area of 27 m × 18 m, with the height of 18 m to reach the final velocities of raindrops. Deionized water (4.81 μS·cm‒1) was used for all treatments to eliminate the impacts of water quality on infiltration and soil erosion (Shainberg et al., 1992; Kim and Miller, 1996).
Two types of steel boxes were used for experiments (Figure 1). The movable steel box (Figrue 1a) is 5 m long, 1 m wide and 0.50 m deep, with adjustable slope gradients of 0-57.80%. The stationary steel box (Figure 1b) is tiltable but not movable, 10 m long, 1.5 m wide and 0.5 m deep, with the adjustable slope gradients of 0-57.80%. Aluminum funnel was set at the end of each box to collect the runoff and sediment samples.
Figure 1 Runoff plots in the laboratory experiments

2.3 Soil material

Experimental Anthrosol soil (locally known as Lou soil), typical soil in southern Loess Plateau of China, was sampled from barren farmland in the suburbs of Yangling National Agricultural High-tech Industry Demonstration Zone, Shaanxi Province, China (Figure 2). The Demonstration Zone was constructed in 1997 by the State Council of China. After 20 years of development, it has become a modern agricultural scientific and technological innovation center in arid and semi-arid areas. Anthrosol soil covers approximately 80% of the total area in Yangling, hence was chosen as representative soils for this research.
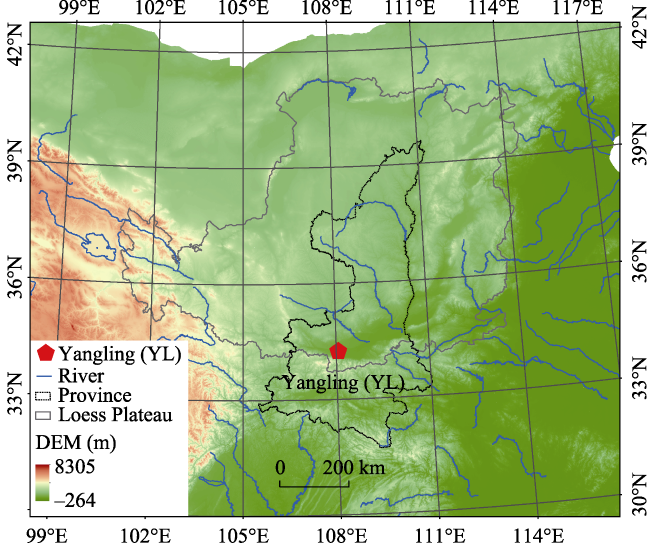
Figure 2 Location of the soil sampling site
Yangling is located at the southern tip of the Loess Plateau, with its topography being dominated by the Weihe River alluvial plain. The elevation ranges from 431 to 563 m above sea level, high in the northwest and low in the southeast, forming three terraces due to terrain drop. The investigation of erosion processes on Anhthrosol soil and its influencing factors has significant references for the sustainable development of agriculture in arid and semi-arid areas of Northwest China. Anthrosol soil is rich with clay particles (approximately 26%; Table 2) in comparison with soils in other regions of the Loess Plateau. Before the experiments, the prepared anthrosol soil was weighed to ensure the soil bulk density at 1.13 g·cm-3, which is the same as the bulk density of the farmland soil on natural slopes.
Table 2 Properties of the experimental anthrosol soil
Soil
type
Particle size distribution (%) Water stable aggregate CaCO3
(g·kg‒1)
TOC (%)
Clay
(< 2 µm)
Fine silt
(2-20 µm)
Coarse silt
(20-50 µm)
Fine sand
(50-250 µm)
Coarse sand (> 250 µm)
Anthrosol 26.06 36.55 27.92 4.25 5.22 6.40 9.30 0.60

2.4 Experimental setup and procedures

Calibrations were made to ensure the homogeneity of the artificial rainfall distribution with the equitability at 90% and the deviation less than 5%. The two kinds of steel boxes were filled from bottom to top. Firstly, a 10-cm layer of silver sand was put into the bottom of the steel box to keep the test soil drainage conditions being close to the natural slope. Permeable fine gauze was then laid above silver sand to separate the sand material from soil material. Afterwards the test soil was added to the steel box six times, with a 5-cm thickness each time.

2.5 Collection and measurement of runoff and sediment

The maximum surface flow velocity was measured by recording the flow time over 0.5 m using potassium permanganate (KMnO4) as a tracer. For the 5-m box, flow velocities were cyclically measured for sites that are 1 m, 2 m, 3 m and 4 m from the top of the slope. For the 10-m steel box, flow velocities were measured for sites that are 1 m, 3 m, 5 m, 7 m and 9 m from the top of the slope. Water temperature was measured using a thermometer. Runoff samples were collected at 1 min intervals with 1.5 L cylinders. Sediment concentrations were measured using the oven-drying method after the deposition of the runoff samples.

2.6 Data analyses

All statistical analyses were conducted using SPSS software (version 14.0). Analysis of variance (ANOVA) was conducted to examine significant differences of sediment load, sediment concentration and surface flow velocity (rill/interrill) in different erosion stages. The method of the least significant difference (LSD) procedure was used for the multiple comparisons at 95% confidence level, and the Paired-samples Test was used for the two-group comparison. The correlation analysis was conducted using the Pearson correlation method.

3 Results

3.1 Division of soil erosion processes

According to previous research on rill erosion processes (Merz and Bryan, 1993; Li et al., 2006) and experimental observation, five stages are divided for erosion processes on slopes: 1) infiltration excess runoff stage (SI); 2) sheet erosion stage (SII), occurring after the stable runoff and before the initiation of knickpoint; 3) rill embryonic stage (SIII), occurring after the initiation of knickpoint and before the initiation of rill network; 4) rill development stage (SIV) when the rills rapidly developed; 5) rill adjustment stage (SV), in which the lengths of the rills did not change. The initial runoff time ranges between 0.97 and 1.87 min under all treatments (Table 3). The duration of sheet erosion (SII) decreases with rising slope gradient. Accordingly, the duration of the rill process increases with rising slope gradient, however, the distributions of duration time in different rill stages (SIII, SIV, SV) vary under various treatments. In general, SIV is longer than SIII on 5 m slopes in two rainfall intensities (except 17.60% slope in 120 mm∙h‒1). For 10 m slopes, SIV is only observed longer than SIII and SV in 90 mm∙h‒1.
Figure 3 Total sediment yield under different experimental conditions (L is slope length; Ri is rainfall intensity)
Table 3 Initial time and duration time for soil erosion stages
Soil erosion stages Slope length (m) Slope gradient (%) Initial time (min) Duration time (min)
Rainfall intensity
(90 mm∙h-1)
Rainfall intensity (120 mm∙h-1) Rainfall intensity (90 mm∙h-1) Rainfall intensity (120 mm∙h-1)
SI 5 17.60 1.80 1.13
26.80 1.87 0.97
36.40 1.83 1.18
46.60 1.30 -
10 17.60 1.53 1.15
26.80 1.53 1.42
36.40 1.20 1.05
46.60 1.38 1.02
SII 5 17.60 1.80 1.13 25.00 12.00
26.80 1.87 0.97 13.00 5.00
36.40 1.83 1.18 8.00 4.00
46.60 1.30 - 4.00 *
10 17.60 1.53 1.15 19.00 8.00
26.80 1.53 1.42 15.00 2.00
36.40 1.20 1.05 5.00 5.00
46.60 1.38 1.02 3.00 2.00
SIII 5 17.60 26.80 13.13 14.00 21.00
26.80 14.87 5.97 21.00 8.00
36.40 9.83 5.18 26.00 9.00
46.60 5.30 - 21.00 -
10 17.60 20.53 9.15 18.00 11.00
26.80 16.53 3.42 13.00 9.00
36.40 6.20 6.05 17.00 14.00
46.60 4.38 3.02 12.00 10.00
SIV 5 17.60 40.80 34.13 21.00 13.00
26.80 35.87 13.97 25.00 19.00
36.40 35.83 14.18 25.97 15.00
46.60 26.30 - 35.50 -
10 17.60 38.53 20.15 23.27 16.00
26.80 29.53 12.42 23.00 13.00
36.40 23.20 20.05 21.00 15.00
46.60 16.38 13.02 25.00 16.00
SV 5 17.60 - - - -
26.80 - 32.97 - 14.00
36.40 - 29.18 - 17.95
46.60 - - - -
10 17.60 - 36.15 - 10.98
26.80 52.53 25.42 9.82 21.07
36.40 44.20 35.05 17.40 12.08
46.60 41.38 29.02 20.42 18.11

Note: - means no data recorded

3.2 Sediment yield in different stages

The total sediment yield shows increasing trend with slope length, ranging from 36.74-74.55 kg on 5 m slope to 26.90-253.41 kg on 10 m slope (Figure 3). Sediment yield contribution in sheet erosion (SII) ranges from 4.30% to 45.40% in all treatments, averaging at 17.40% (Figure 4). Slope gradient has impacts on the sediment yield contribution in SII, resulting in the sharp reduction of sheet erosion contribution from the gentler slope (17.60% slope and 26.80% slope) to the steeper slope (36.40% slope and 46.60% slope). The average decreasing rate ranges at approximately 56.30% to 75.60% on 5 m slope and 15.90% to 77.00% on 10 m slope, respectively.
Figure 4 Contribution of sediment yield in different erosion stages
Besides, the results suggest that sediment yield primarily sources from rill erosion (more than 54.60% and up to 95.70%). This result is consistent with previous findings on the Loess Plateau (Cai, 1998; He et al., 2014; He et al., 2016). Specifically, in this study, sediment yield is dominated by SIV, contributing from 22.20% to 64.50% with average value at 40.10%. The contribution of sediment yield in SIV in 46.60% slope is the highest, ranging from 37.80% to 64.50%, averaging at 51.9%. As shown in Figure 5, sediment loads are the highest in SIV among most of the treatments, ranging at 0.03-0.49 kg∙min‒1∙m‒2.
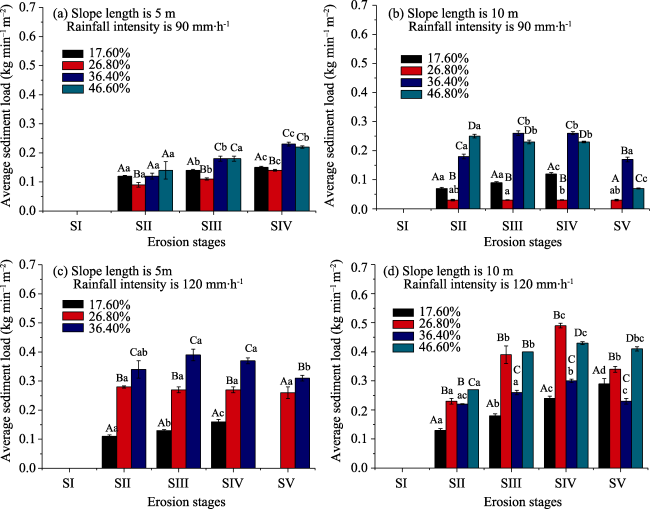
Figure 5 Sediment load in different erosion stages. Different capital letters (A-D) indicate significant difference (P < 0.05) in sediment load between different slopes in the same erosion stage. Different lower cases (a-d) indicate significant difference (P < 0.05) in sediment load among different erosion stages on the same slope.

3.3 Variation of sediment concentration in runoff plot

The instant sediment concentration is very high when runoff stars, which could reach 620-640 kg∙m‒3, due to the large amount of isolated soil particles on the slope under experimental conditions (Figure 6). After that, the average sediment concentration decreases sharply in the sheet flow stage (SII), and increases gently in the following stages with rill development. The average sediment concentration in SII ranges from 30-143 kg∙m‒3 in 90 mm∙h-1 rainfall to 63-211 kg∙m‒3 in 120 mm∙h‒1 rainfall, respectively. The average sediment concentration in SII continues to increase with rising slope gradient in 120 mm∙h‒1 rainfall. The average sediment concentration also changes in different stages of the rill processes, with higher values (ranging at 21-290 kg∙m‒3) in SIV in comparison with other 2 stages of rill processes (SIII and SV) among all treatments. Generally, the highest value of the average sediment concentration in SII is approximately 28.20% lower than that in SIV.
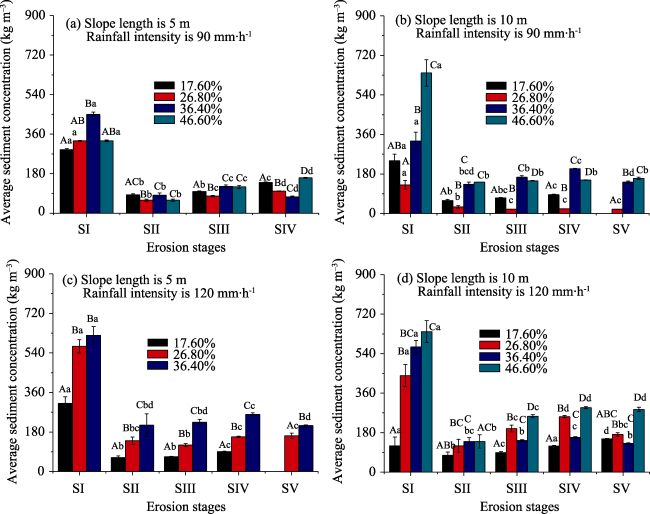
Figure 6 Sediment concentration in different erosion stages. Different capital letters (A-D) indicate significant difference (P < 0.05) in sediment concentration between different slopes in the same erosion stage. Different lower cases (a-d) indicate significant difference (P < 0.05) in sediment concentration among different erosion stages on the same slope

3.4 Flow velocity in runoff plot

As shown in Table 4, the average surface interrill flow velocity in SII, SIII, SIV, and SV ranges between 0.18- 0.45 m∙s‒1, 0.22-0.38 m∙s‒1, 0.18-0.31 m∙s‒1 and 0.19-0.34 m∙s‒1, respectively. The average surface rill flow velocity in SIII, SIV and SV ranges at 0.18-0.35 m∙s‒1, 0.18-0.33 m∙s‒1 and 0.23-0.43 m∙s‒1, respectively.

4 Discussion

4.1 Statistical differences of variables along erosion stages

In this article, sediment load and flow velocity changing with erosion stages are specifically focused on.
4.1.1 Sediment load difference
As shown in Figure 5, there are significant differences for sediment loads among erosion stages for most treatments. Sediment load has significant (P < 0.05) difference in SII and SIII, SII and SIV under 13 treatments, in SIII and SIV under 11 out of 15 treatments, and in SIV and SV under 6 out of 9 treatments. The differences among sediment concentrations are less than those of sediment loads (Figure 6), with 8 treatments being significantly different in SII and SIII, 11 treatments being significantly different in SII and SIV, 12 treatments in SIII and SIV out of 15 total treatments, and 5 treatments in SIV and SV out of 9 total treatments.
Table 4 Surface flow velocity in different erosion stages
Rainfall
intensity
(mm.h-1)
Slope length
(m)
Slope gradient (%) Average surface flow velocity (m∙s-1)
SI SII SIII SIV Sv
90 5
(interrill)
17.60 0.27±0.01Aa 0.22±0.01Ab# 0.22±0.01Ab#
26.80 0.32±0.02Ba 0.22±0.01Ab# 0.19±0.01Ab#
36.40 0.27±0.02Aa 0.27±0.01Ba# 0.29±0.02Ba#
46.60 0.33±0.02Ba 0.30±0.01Ba# 0.31±0.01Ba#
5
(rill)
17.60 0.18±0.01Aa$ 0.25±0.01ACb#
26.80 0.18±0.01ABa$ 0.18±0.01Ba#
36.40 0.20±0.03Ba$ 0.28±0.01Ab#
46.60 0.23±0.02Ca$ 0.23±0.01Ca$
10 (interrill) 17.60 0.33±0.02Aa 0.31±0.02Aa# 0.31±0.01Aa#
26.80 0.33±0.02Aa 0.38±0.01Bb# 0.31±0.01Aa# 0.34±0.01Aab#
36.40 0.25±0.03ABab 0.31±0.04Aa# 0.24±0.01Bab# 0.19±0.01Bb#
46.60 0.18±0.02Ba 0.33±0.01ABb# 0.31±0.01Ab# 0.34±0.01Ab#
10
(rill)
17.60 0.33±0.05Aa# 0.20±0.02Ab$
26.80 0.26±0.01Ba$ 0.27±0.01Ba$ 0.38±0.01Ab$
36.40 0.29±0.01Ca# 0.26±0.02BCab# 0.24±0.01Bb$
46.60 0.27±0.01BCa$ 0.22±0.01ACb$ 0.23±0.01Bb$
120 5
(interrill)
17.60 0.26±0.01ACa 024±0.01Aa# 0.18±0.01Ab#
26.80 0.31±0.01Ba 0.23±0.01Ab# 0.25±0.01Abc# 0.27±0.01Ac#
36.40 0.29±0.03BCa 0.22±0.01Aa# 0.24±0.09Aa# 0.22±0.05Aa#
46.60
5 (rill) 17.60 0.23±0.02Aa# 0.20±0.02Ab#
26.80 0.23±0.01Aa# 0.29±0.02Ba# 0.26±0.02Aa#
36.40 0.18±0.01Ba$ 0.31±0.02Bb# 0.26±0.01Ac#
46.60
10 (interrill) 17.60 0.34±0.02Aa 0.29±0.02Aab# 0.27±0.02Ab# 0.31±0.04Aab#
26.80 0.39±0.03ABa 0.35±0.01ABa# 0.27±0.02Ab# 0.22±0.01Bb#
36.40 0.45±0.02Ba 0.37±0.02Bb# 0.28±0.03Ac# 0.25±0.03ABbc#
46.60 0.40±0.04ABa 0.35±0.01ABa# 0.19±0.01Ab# 0.19±0.01Bb#
10 (rill) 17.60 0.35±0.01Aa# 0.33±0.01Aa$ 0.30±0.03Aa#
26.80 0.18±0.004Ba$ 0.22±0.01Ba# 0.43±0.02Bb$
36.40 0.19±0.02Ba$ 0.29±0.01Cb# 0.26±0.02Ab#
46.60 0.19±0.02Ba$ 0.30±0.02ACb# 0.23±0.01Aa$

Note: Values for the same treatment in different erosion stages followed by the same lowercase, values for different slope gradients under the same slope length and rainfall intensity followed by the same capital letter and values with the same styles of other symbles (# or $) for interrill and rill flows are not significantly different at P < 0.05.

Sediment load has a gentle increasing trend with erosion process until SIV, and then shows a slight decreasing trend in Sv, concentrating in SIII and SIV. Sediment load in SIV is 0.93-2.30, 0.95-1.33 and 1.00-3.90 times of that in SII, SIII and Sv stages, respectively. In SII, both sediment load and sediment concentration are low due to the limited transport capacity of shallow interrill flow (Kinnell, 2005). The increase of sediment loads in SIII, SIV and SV is mainly due to the transportation of particles eroded from both interrill and rills during these stages (Wirtz et al., 2012). Sediment concentration has a significant linear correlation with flow discharge rate in SIII and SIV (Table 5). In SIII, sediment load increases when the thin sheet flow become concentrated flow and knickpoints occur (He et al., 2014). In SIV, sediment load increases with the rill downward cutting and headcut incisions and rising in rill width, depth and length (He et al., 2016; Sheng et al., 2017). These results are consistent with previous investigations (Slattery and Bryan, 1992; Berger et al., 2010; Wirtz et al., 2012). Bryan and Poesen (1989) indicated that the increase of percolation in rills may reduce the discharge in the downward channels and result in the increase of sediment concentration in rills. Thus, both sediment load and sediment concentration decrease slightly due to the detachment-limiting and transport-limiting regimes in SV (Polyakov and Nearing, 2003; Yan et al., 2008). Bruno et al. (2008) also indicated that flow in the terminal part of the rill could only transport the upstream sediment particles without detaching additional material. In SV, the numbers and morphology (length, width and density) of rills become stable (Wang et al., 2014a), which means fewer particles are eroded from the wetted perimeters of rills. Non-significant linear relationship between sediment concentration and flow discharge rate in SV (Table 5) also suggests that fewer particles are detached by concentrated flow in this stage. In addition, the increasing roughness in the rill bed may result in deposition and increasing Darcy-Weisbach friction coefficient (Wang et al., 2014a), which may decrease the sediment transportation energy in SV or even result in sediment deposition.
Table 5 Coefficients of Pearson correlation among variables in the different erosion stages
SII Sle
(m)
Ri
(mm∙h-1)
Sg
(o)
Sl
(kg∙min-1∙m-2)
Fdr
(m3∙min-1)
Sc
(kg∙m-3)
Fvi
(m∙s-1)
Fvr
(m∙s-1)
Sle 1 -
Ri 0.000 1
Sg 0.031 0.017 1
Sl -0.203* 0.527** 0.436** 1
Fdr 0.908** 0.231* 0.121 0.025 1
Sc -0.205* 0.166 0.326** 0.653** -0.081 1
Fvi -0.295** 0.109 0.047 -0.083 0.266** -0.193** 1
SIII Sle Ri Sg Sl Fdr Sc Fvi Fvr
Sle 1
Ri 0.147* 1
Sg -0.02 -0.204** 1
Sl 0.172** 0.505** 0.452** 1
Fdr 0.937** 0.394** -0.097 0.252** 1
Sc 0.134* 0.319** 0.551** 0.953** 0.145* 1
Fvi 0.665** 0.184** 0.039 0.128 0.656** 0.064 1
Fvr 0.491** -0.089 -0.169** 00.228** 0.421** -0.243** 0.174** 1
SIV Sle Ri Sg Sl Fdr Sc Fvi Fvr
Sle 1
Ri 0.118* 1
Sg -0.017 -0.128* 1
Sl 0.101 0.619** 0.415** 1
Fdr 0.921** 0.339** -0.133** 0.191** 1
Sc 0.121* 0.585** 0.312** 0.845** 0.185** 1
Fvi 0.171** -0.259** 0.156** -0.159** 0.152** -0.140* 1
Fvr 0.131* 0.308** 0.108 0.249** 0.194** 0.390** 0.010 1
SV Sle Ri Sg Sl Fdr Sc Fvi Fvr
Sle 1
Ri -0.390** 1
Sg 0.147 -0.365** 1
Sl -0.196* 0.814** -0.155 1
Fdr 0.574** 0.345** -0.500** 0.393** 1
Sc -0.171* 0.471** 0.411** 0.752** -0.115 1
Fvi 0.120 -0.352** -0.086 -0.543** -0.190* -0.445** 1
Fvr 0.188* 0.191* -0.543** 0.148 0.538*8 -0.246** -0.054 1

Note:** Correlation is significant at 0.01 level (2-tailed); * Correlation is significant at 0.05 level (2-tailed). Sle is slope length, Ri is rainfall intensity, Sg is sloe gradient, Sl is sediment load, Fdr is flow discharge rate, Sc is sediment concentration, Fvi is surface flow velocity in interill flow, Fvr is surface flow velocity in rills.

4.1.2 Flow velocity difference
Hydraulic situations have significant impacts on erosive forces, and can even modify surface roughness (Bryan, 2000). Additionally, soil detachment, transport capacity and deposition processes are mainly impacted by flow velocity (Lei et al., 2002). The surface interrill flow velocity shows a significant (P < 0.05) difference in SII and SIII under 6 treatments, in SII and SIV under 9 treatments, in SIII and SIV under 5 out of 15 treatments. There are no significant differences among surface interrill flow velocities in SIV and SV. The average surface rill flow velocity shows a significant difference in SIII and SIV under 8 out of 15 treatments, and in SIV and SV under 4 out of 9 treatments. Inconsistent findings are reported for the hydraulic parameters under different experiments. For example, significant differences among hydraulic and sediment transport conditions were found during the transition from interrill to rill erosion by some previous experiments (Slattery and Bryan, 1992; Merritt 1984). Bryan (1990) suggested Froude Number as a critical hydraulic parameter for rill incisions. In contrast, Torri et al. (1987) reported that Froude Number could not be distinguished between interrill flow and rill flow. Slattery and Bryan (1992) also indicated that no single threshold value was identified between interrill and rill flows.
In this investigation, the average surface interrill flow velocity either does not change significantly or shows slight decreasing trend along erosion stages until SIV, and becomes stable in Sv. Sediment concentration shows a significantly negative linear relationship with surface interrill flow velocity in SII, SIV and SV (Table 5).
The average surface rill flow velocity fluctuates among erosion processes. Surface flow velocity in rills shows significant negative correlations with sediment concentration in SIII and SV, and significant positive linear correlations with sediment concentration in SIV (Table 6). Slattery and Bryan (1992) suggested non-linear relationships between sediment discharge and flow hydraulic conditions in rill channels (Froude number, shear velocity and stream power) in their experiments.
The surface interrill flow velocity is significantly different from surface rill flow velocity in SIII under 10 treatments, in SIV under 5 treatments out of 15 treatments, and in SV under 5 out of total 9 treatments. Surface rill flow velocity is slightly lower than that of surface interrrill flow velocity. Merritt (1984) indicated that flow velocity would decrease when flow is concentrated into small rills. Also, Bryan (2000) suggested that concentrated flow would decrease Froude Numbers by increasing flow depth. It is noticeable that both interrill flow and rill flow contribute to the changes of the outlet sediment load and sediment concentration, which cause the situation to become more complex in this study. Moreover, as surface flow velocity varies along slope length with rainfall duration (Lei et al., 2002; Wang et al., 2013), the selected surface flow velocity at one site (1 m above the outlet) may also affect the findings.

4.2 Impacts of rainfall on sediment load

It is well recognized that the rainfall energy has significant impacts on soil erosion, hence rainfall erosivity has been adopted as a dominant parameter in most soil erosion models (Bryan 2000; Sun et al., 2013). In this study, rainfall intensity could increase the sediment yield, ranging from 36.74-54.81 kg (5 m slope) and 26.90-181.08 kg (10 m slope) in 90 mm∙h-1 to 32.47-74.55 kg (5 m slope) and 147.73-253.41 kg (10 m slope) in 120 mm∙h-1 (Figure 3). Total sediment yield in 120 mm∙h-1 becomes 0.80-9.40 times of that in 90 mm∙h-1. Compared to 90 mm∙h-1 condition, sediment load and sediment concentration in 120 mm∙h-1 are 0.90-2.80 and 0.80-1.00 times in SII, 0.90-13.00 and 0.70-10.50 times in SIII, 1.10-16.30 and 0.70-12.00 times in SIV and 1.40-11.30 and 0.90-9.10 times in SV, respectively. These results are also consistent with those from Shen et al. (2016), who indicated that rill erosion rates increase by 56.30%-79.20% and 35.50%-65.10% on loess slopes when rainfall intensity increase from 50-75 mm∙h-1 and from 75-100 mm∙h-1, respectively. Soil erosivity is considered to be dependent on several rainfall characteristics, including total amount, rates of rainfall and rain drop velocity (Sun et al., 2013; Nearing et al., 2017). It is commonly accepted that both sediment detachment and transport are depending on energy consumption (Wang et al., 2014b; Shen et al., 2016). In this study, the total rainfall amount for all treatments is kept the same at 90 mm and raindrop radius is also controlled to be constant. Thus, a higher rainfall intensity would correspond to a higher rainfall energy, which would result in higher flow discharge rate (Table 5) and higher stream power to affect the sediment detachment and transport capacity with higher sediment concentration and sediment load (Wang 1998; Wang et al., 2014a).
Sediment load has a significant (p < 0.01) linear relationship with rainfall intensity in SII (Table 5). However, no significant linear relationship is observed between flow discharge rate and sediment load in this stage (Table 5). Sediment concentration has no significant linear correlations with rainfall intensity and flow discharge rate in SII. Sediment load and sediment concentration are lower in SII due to several reasons. Firstly, SII belongs to the raindrop-impact-induced erosion process and is mainly resulted from raindrop detachment (Kinnell, 2005). Secondly, little entrainment capacity is found in shallow interrill flow and discrete pondings would decrease splash entrainment in rianflow (Bryan, 2000). Lastly, water depth would also affect raindrop detachment, with the highest capacity when water depth is equal to the median raindrop diameter (Mutchler and Larson, 1971).
Previous investigations indicated that rill erosion is dominated by concentrated flow (Yang et al., 2006; Govers et al., 2007). Sediment loads in the processes SIII, SIV and SV have a significant (p < 0.01) relationship with both rainfall intensity and flow discharge rate in this investigation (Table 5), due to the consideration of both interrill and rill contributions when calculating the sediment loads in these processes. On most slopes, rain splash would interact with overland flow and has significant impacts on soil erosion processes by modifying flow hydraulics (Bryan, 2000). There are several ways for raindrops to affect runoff by inputting dynamics energy, disturbing flow pattern, and changing flow resistance (Sun et al., 2013). As shown in Table 5, flow discharge rate shows a significantly positive linear correlation with rainfall intensity in all erosion stages, with higher coefficients after rills. Both increase in the raindrop energy and concentrated flow energy would lead to a higher impacts of rainfall intensity on sediment load and sediment concentration during rill stages (SIII, SIV and SV).

4.3 Impacts of slope gradient on sediment load

As shown in Figure 5, sediment load and sediment concentration in all stages show less significant differences on shorter slope (5 m) and lower rainfall intensity (90 mm∙h-1). The ratios of both average sediment load and average sediment concentration on 10 m slopes to those on 5 m slopes (in all stages) show an increasing trend with slope gradient in 90 mm∙h-1 and a decreasing trend with slope gradient in 120 mm∙h-1. These results suggest that both slope length and rainfall intensity increase the impacts of slope gradient on soil erosion, which is consistent with Assouline and Ben-Hur (2006) who indicated that the slope effects are more obvious for higher rainfall intensity. Flow velocities (interrill/rill) at the site of 1 m above the outlet do not show much significant differences on slopes with different gradients. Runoff velocity is considered to be the determining factor without consideration of slope gradient, however, no obvious correlation between flow velocity and soil loss is found during rill erosion (Moss 1988; Govers, 1992; Fox and Bryan, 1999).
Loads of investigations have reported the increase of soil loss with rising slope gradient (Wang 1998; Berger et al., 2010). He et al. (2016) also indicated that rill morphology (rill depth, length and width-depth ratio) would change with slope gradient to increase sediment yield in rills. In this study, fluctuations are present for the sediment load and sediment concentration in response to slope gradient, with the lowest average sediment load and average sediment concentration being observed for treatments in 90 mm∙h-1 and a special slope of 26.80%. When rills occur (SIII, SIV and SV), there is a decreasing trend on 46.60% slopes (10 m) in 90 mm∙h-1 and on 36.40% slopes in 120 mm∙h-1 for both average sediment load and sediment concentration. On the mild slopes (26.80% and 36.40%), the sediment load (or sediment concentration) convex is mainly due to the influence of soil crust with rill developing (Fang et al., 2014). For steeper slopes (46.60%), the decreased sediment load and sediment concentration may be resulted from the threshold functions of slope gradient (McCool et al., 1987; Sun et al., 2013). From the current results, it can be concluded that soil erosion would be the lowest on slopes between 26.80% and 36.40%, which is consistent with previous results (Berger et al., 2010; He et al., 2016).
Slope gradient has significant impacts on soil erosion in different ways, including altering infiltration rate, runoff hydraulic conditions and surface roughness (Govers, 1991; Kinnell 2000; Berger et al., 2010; Fang et al., 2014). However, contradictory results have been reported, for example, with both positive and negative effects of slope gradient on splash detachment and infiltration rates (Fang et al., 2014; Fox and Bryan, 2000). These conflicting results may be due to the complexity of erosion processes being influenced by other factors, such as slope length, rainfall characteristics and soil properties.
As shown in Table 5, both sediment load and sediment concentration show a significant negative correlation with slope length and a significant positive correlation with slope gradient in SII and SV. Sediment load and sediment concentration show a positive linear correlation with slope length and slope gradient in SIII and SIV. Normally, power function models are used to predict soil loss with increasing slope gradient, such as Universal Soil Loss Equation (USLE), with a power index between 1 to 2 or even higher than 2 (Fox and Bryan, 2000; Sun et al., 2013). However, linear or less linear relationship between soil loss and slope gradient was also found on short slopes or slopes of low inclination, and this relationship is considered better to describe soil loss changing with slope gradient due to the reported over-prediction of interrill erosion by using the power function models (Meyer and Harmon, 1989; Huang and Bradford, 1993; Fox and Bryan, 2000).

5 Conclusions

The erosion processes are divided into five stages to quantify sediment load changes with erosion processes. The five erosion stages are infiltration excess runoff stage (SI), sheet erosion stage (SII), rill embryonic stage (SIII), rill development stage (SIV), and rill adjustment stage (SV). Sediment yield is mainly sourced from rill erosion and dominated in SIV. Both sediment load and sediment concentration show significant differences with erosion stages in most treatments. There is an increasing trend of sediment load and sediment concentration along stages SII to SIV, due to the higher detachment capacity by concentrated flow and contribution of both interrill flow and rill flow after rills. Detachment-limiting and transport-limiting regimes result in the slight decreasing trend of sediment load in stage SV. Moreover, both sediment load and sediment concentration fluctuate along the rising of slope gradients with an increasing trend, demonstrating the lowest values on slopes of 26.80% and 36.40%, respectively, among different treatments. Rainfall intensity also increases sediment load along erosion stages and enhances the influences of slope gradient. Maximum surface flow velocities (interrill and rill) show less significant differences along erosion stages and slope gradients, which may be attributed to the neglect of flow velocity changing along the slope length by calculating flow velocities at one site (1 m above the outlet). Hence, the flow hydraulic conditions changing with slope length and rainfall duration should be further investigated. Findings from this study are important for better understanding of hillslope erosion mechanisms and improving the soil erosion modeling, by considering the variations of parameters along erosion stages on hillslope.

The authors have declared that no competing interests exist.

[1]
Abderrezzak K E K, Moran A D, Mosselman Eet al., 2014. A physical, movable-bed model for non-uniform sediment transport, fluvial erosion and bank failure in rivers.Journal of Hydro-environment Research, 8: 95-114.

DOI

[2]
Assouline S, Ben-Hur M, 2006. Effects of rainfall intensity and slope gradient on the dynamics of interrill erosion during soil surface sealing.Catena, 66: 211-220.

DOI

[3]
Auerswald K, Fiener P, Dikau R, 2009. Rates of sheet and rill erosion in Germany: A meta-analysis.Geomorphology, 111: 182-193.

DOI

[4]
Bennett S J, 1999. Effect of slope on the growth and migration of headcuts in rills.Geomorphology, 30: 273-290.

DOI

[5]
Berger C, Schulze M, Rieke-Zapp Det al., 2010. Rill development and soil erosion: A laboratory study of slope and rainfall intensity.Earth Surface Processes and Landforms, 35: 1456-1467.

DOI

[6]
Beuselinck L, Govers G, Hairsine Pet al., 2002. The influence of rainfall on sediment transport by overland flow over areas of net deposition.Journal of Hydrology, 257: 145-163.

DOI

[7]
Brodie I, Rosewell C, 2007. Theoretical relationships between rainfall intensity and kinetic energy variants associated with stormwater particle washoff.Journal of Hydrology, 340(1/2): 40-47.

DOI

[8]
Bruno C, Di Stefano C, Ferro V, 2008. Field investigation on rilling in the experimental Sparacia area, South Italy.Earth Surface Processes and Landforms, 33: 263-279.

DOI

[9]
Bryan R B, 1990. Knickpoint evolution in rill wash.Catena, 17(Suppl.): 111-132.

DOI

[10]
Bryan R B, 2000. Soil erodibility and processes of water erosion on hillslope.Geomorphology, 32(3/4): 385-415.

DOI

[11]
Bryan R B, Poesen J, 1989. Laboratory experiments on the influence of slope length on runoff, percolation, and rill development,Earth Surface Processes and Landforms, 14: 211-231.

DOI

[12]
Cai Q G, 1998. Research of rill initiation condition on loess hillslopes. Journal of Sediment Research, (1): 52-59. (in Chinese)

[13]
Ellison W D, 1947. Soil erosion studies: Part I.Agricultural Engineering, 28: 145-146.

[14]
Fang H Y, Sun L Y, Tang Z H, 2014. Effects of rainfall and slope on runoff, soil erosion and rill development: An experimental study using two loess soils.Hydrological Processes, 29(11): 2649-2658.

[15]
Foster G R, Huggins L F, Meyer L D, 1984. A laboratory study of rill hydraulics: 1. Velocity relationships.Transactions of the ASAE, 27(3): 790-796.

DOI

[16]
Fox D M, Bryan R B, 2000. The relationship of soil loss by interrill erosion to slope gradient.Catena, 38: 211-222.

DOI

[17]
Garzon-Garcia A, Bunn S E, Olley J Met al., 2018. Labile carbon limits in-stream mineralization in a subtropical headwater catchment affected by gully and channel erosion.Journal of Soils and Sediments, 18: 648-659.

DOI

[18]
Govers G, Gimenez R, Van Oost K, 2007. Rill erosion: Exploring the relationship between experiments, modeling and field observations.Earth-Science Reviews, 84: 87-102.

DOI

[19]
Govers G, 1991. Time dependency of runoff velocity and erosion: The effect of the initial soil moisture profile.Earth Surface Process and Landforms, 16(8): 713-729.

DOI

[20]
Govers G, 1992. Relationship between discharge, velocity and flow area for rills eroding loose, non-layered materials.Earth Surface Processes and Landforms, 17: 515-528.

DOI

[21]
He J J, Li X J, Jia L Jet al., 2014. Experimental study of rill evolution processes and relationships between runoff and erosion on clay loam and loess.Soil Science Society of America Journal, 78: 1716-1725.

DOI

[22]
He J J, Sun L Y, Gong H Let al., 2016. The characteristics of rill development and their effects on runoff and sediment yield under different slope gradients.Journal of Mountain Science, 13(3): 397-404.

DOI

[23]
Huang C, Bradford J, 1993. Analyses of slope and runoff factors based on the WEPP erosion model.Soil Science Society of America Journal, 57: 1176-1183.

DOI

[24]
Kim K H, Miller W P, 1996. Effect of rainfall electrolyte concentration and slope infiltration and erosion.Soil Technology, 9: 173-185.

DOI

[25]
Kinnell P I A, 2000. The effect of slope length on sediment concentrations associated with side-slope erosion.Soil Science Society and American Journal, 64: 1004-1008.

DOI

[26]
Kinnell P I A, 2005. Raindrop-impact-induced erosion processes and prediction: A review.Hydrological Processes, 19: 2815-2844.

DOI

[27]
Lei T W, Zhang Q W, Yan L Jet al., 2008. A rational method for estimating erodibility and critical shear stress of an eroding rill.Geoderma, 144: 628-633.

DOI

[28]
Lei T W, Zhang Q W, Zhao Jet al., 2002. Soil detachment rates for sediment loaded flow in rills.Transactions of the ASAE, 45(6): 1897-1903.

[29]
Li M, Li Z B, Ding W Fet al., 2006. Using rare earth element tracers and neutron activation analysis to study rill erosion process.Applied Radiation and Isotopes, 64: 402-408.

DOI

[30]
Li P F, Mu X M, Holden Jet al., 2017. Comparison of soil erosion models used to study the Chinese Loess Plateau.Earth-Science Reviews, 170: 17-30.

DOI

[31]
Li Z W, Nie X D, He J Jet al., 2017. Zonal characteristics of sediment-bound organic carbon loss during water erosion: A case study of four typical loess soils in Shaanxi Province.Catena, 156: 393-400.

DOI

[32]
Liu B Y, Nearing M A, Rise L M, 1994. Slope gradient effects on soil loss for steep slopes.Transactions of the ASAE, 37(6): 1835-1840.

DOI

[33]
Lu J, Zheng F L, Li G Fet al., 2016. The effects of raindrop impact and runoff detachment on hillslope soil erosion and soil aggregate loss in the Mollisol region of Northeast China. Soil & Tillage Research, 161: 79-85.

[34]
Lu P, Xie X L, Wang L Het al., 2017. Effects of different spatial distributions of physical soil crusts on runoff and erosion on the Loess Plateau in China.Earth Surface Processes and Landforms, 42: 2082-2089.

DOI

[35]
Ma B, Ma F, Li Z Bet al., 2014. Effects of soil crust and crop on runoff and erosion in Loess Plateau. Acta Agriculturae Scandinavica Section B-Soil and Plant Science, 64(8): 645-656.

[36]
Martinez-Mena M, Castillo V, Albaladejo J, 2002. Relations between interrill erosion processes and sediment particle size distribution in a semiarid Mediterranean area of SE of Spain.Geomorphology, 45: 261-275.

DOI

[37]
McCool D K, Brown L C, Foster G Ret al., 1987. Revised slope steepness factor for the Universal Soil Loss Equation.Transactions of the ASAE, 30(5): 1387-1396.

DOI

[38]
Merritt E, 1984. The identification of four stages during micro-rill development.Earth Surface Processes and Landforms, 19: 493-496.

[39]
Merz B, Bryan R B, 1993. Critical conditions for rill initiation on sandy loam Brunisols: Laboratory and field experiments in southern Ontario, Canada.Geoderma, 57: 357-385.

DOI

[40]
Meyer L, Harmon W, 1989. How row-sideslope length and steepness affect sideslope erosion.Transctions of the ASAE, 32: 639-644.

DOI

[41]
Moss A J, 1988. The effects of flow-velocity variations on rain-driven transportation and the role of rain impact in the movement of solids.Australian Journal of Soil Research, 26(3): 443-450.

DOI

[42]
Moss A J, Green P, 1983. Movement of solids in air and water by raindrop impact: Effects of drop-size and water-depth variations.Australian Journal of Soil Research, 21: 257-269.

DOI

[43]
Mutchler C K, Larson C L, 1971. Splash amounts from waterdrop impact on a smooth surface.Water Resources Research. 7: 195-200.

[44]
Nearing M A, Foster G R, Lane L Jet al., 1989. Process-based soil erosion model for USDA-water erosion prediction project technology. Transactions of the ASAE, 32(5): 1587-1593.

DOI

[45]
Nearing M A, Yin S Q, Borrelli Pet al., 2017. Rainfall erosivity: An historical review. Catena, 157: 357-362.

DOI

[46]
Polyakov V O, Nearing M A, 2003. Sediment transport in rill flow under deposition and detachment conditions. Catena, 51: 33-43.

DOI

[47]
Romero C C, Stroosnijder L, Baigorria G A, 2007. Interrill and rill erodibility in the northern Andean Highlands.Catena, 70: 105-113.

DOI

[48]
Rose C W, Williams J R, Sander G Cet al., 1983. A mathematical model of soil erosion and deposition processes. 1. Theory for a plane land element.Soil Science Society of America Journal, 47: 991-995.

DOI

[49]
Shainberg I, Warrington D, Laflen J M, 1992. Soil dispersibility, rain properties and slope interaction in rill formation and erosion.Soil Science Society of America Journal, 56: 278-283.

DOI

[50]
Shen H O, Zheng F L, Wen L Let al., 2015. An experimental study of rill erosion and morphology.Geomorphology, 231: 193-201.

DOI

[51]
Shen H O, Zheng F L, Wen L Let al., 2016. Impacts of rainfall intensity and slope gradient on rill erosion processes at loessial hillslope.Soil & Tillage Research, 155: 429-436.

[52]
Sheng H W, Sun L Y, Cai Q G, 2017. Impact of rill morphology on hillslope erosion for loess soils.Journal of Basic Science and Engineering, 25(4): 679-688. (in Chinese)

[53]
Shi Z H, Fang N F, Wu F Zet al., 2012. Soil erosion processes and sediment sorting associated with transport mechanisms on steep slopes.Journal of Hydrology, 454: 123-130.

[54]
Slattery M C, Bryan R B, 1992. Hydraulic conditions for rill incision under simulated rainfall: A laboratory experiment.Earth Surface Processes and Land Forms, 17: 127-146.

DOI

[55]
Slimane A B, Raclot D, Evrard Oet al., 2016. Relative contribution of rill/interrill and gully/channel erosion to small reservoir siltation in Mediterranean environments. Land Degradation & Development, 27: 785-797.

[56]
Song J X, Zhang G T, Wang W Zet al., 2017. Variability in the vertical hyporheic water exchange affected by hydraulic conductivity and river morphology at a natural confluent meander bend.Hydrological Processes, 31: 3407-3420.

DOI

[57]
Sun L Y, Fang H Y, Qi D Let al., 2013. A review on rill erosion process and its influencing factors.Chinese Geographical Science, 23(4): 389-402.

DOI

[58]
Torri D, Poesen J, Borselli Let al., 2012. Spatial variation of bed roughness in eroding rills and gullies.Catena, 90: 76-86.

DOI

[59]
Torri D, Sfalanga M, Chisci G M, 1987. Threshold conditions for incipient rilling. In: Bryan R B (ed.). Rill Erosion. Catena (Suppl.), 8: 97-105.

[60]
Wang G P, 1998. Summary of rill erosion study.Soil and Water Conservation in China, (8): 23-26. (in Chinese)

[61]
Wang L, Shi Z H, 2015. Size selectivity of eroded sediment associated with soil texture on steep slopes.Soil Science Society of America Journal, 79: 917-929.

DOI

[62]
Wang L, Shi Z H, Wang Jet al., 2014b. Rainfall kinetic energy controlling erosion processes and sediment.Journal of Hydrology, 512: 168-176.

DOI

[63]
Wang L H, Dalabay N, Lu Pet al., 2017. Effects of tillage practices and slope on runoff and erosion of soil from the Loess Plateau, China, subjected to simulated rainfall.Soil & Tillage Research, 166: 147-156.

[64]
Wang L S, Cai Q G, Cai C Fet al., 2013. Study of hydrodynamic characteristics of rill and inter-rill flows on loess slopes.Journal of Sediment Research, 6: 45-52. (in Chinese)

[65]
Wang L S, Cai Q G, Cai C Fet al., 2014a. Hydrodynamic characteristics of stable growth-rill flow on loess slopes.Progress in Geography, 33(8): 1117-1124. (in Chinese)

[66]
Wang X Y, Zheng F L, 2008. Effects of slope length on detachment and transport processes on a loessial hillslope.Bulletin of Soil and Water Conservation, 28: 1-4. (in Chinese)

[67]
Wen L L, Zheng F L, Shen H Oet al., 2015. Rainfall intensity and inflow rate effects on hillslope soil erosion in the Mollisol region of Northeast China.Natural Hazards, 79: 381-395.

DOI

[68]
Wirtz S, Seeger M, Ries J B, 2012. Field experiments for understanding and quantification of rill erosion processes. Catena, 91: 21-34.

DOI

[69]
Wu B, Wang Z L, Zhang Q Wet al., 2017. Modelling sheet erosion on steep slopes in the loess region of China.Journal of Hydrology, 553: 549-558.

DOI

[70]
Wu B, Wang Z L, Zhang Q Wet al., 2018. Distinguishing transport-limited and detachment-limited processes of interrill erosion on steep slopes in the Chinese loessial region.Soil & Tillage Research, 177: 88-96.

[71]
Wu Q J, Wang L H, Wu F Q, 2016. Effects of structural and depositional crusts on soil erosion on the Loess Plateau of China. Arid Land Research and Management, 30: 432-444.

DOI

[72]
Yan L J, Yu X X, Lei T Wet al., 2008. Effects of transport capacity and erodibility on rill erosion processes: A model study using the Finite Element method.Geoderma, 146: 114-120.

DOI

[73]
Yang M Y, Walling D E, Tian J Let al., 2006. Partitioning the contributions of sheet and rill erosion using Berllium-7 and Cesium-137.Soil Science Society of America Journal, 70(5): 1579-1590.

DOI

[74]
Zhang G H, Shen R C, Luo R Tet al., 2010. Effects of sediment load on hydraulics of overland flow on steep slopes.Earth Surface Processes and Landforms, 35: 1811-1819.

DOI

[75]
Zhang X, Li Z B, Li Pet al., 2018. Influences of sand cover on erosion processes of loess slopes based on rainfall simulation experiments.Journal of Arid Land, 10(1): 39-52.

DOI

[76]
Zhang X C, Wang Z L, 2017. Interrill soil erosion processes on steep slopes. Journal of Hydrology, 548: 652-664.

DOI

[77]
Zhao L S, Huang C H, Wu F Q, 2016. Effect of microrelief on water erosion and their changes during rainfall.Earth Surface Processes and Landforms, 41: 579-586.

DOI

[78]
Zhao X N, Huang J, Gao X Det al., 2014. Runoff features of pasture and crop slopes at different rainfall intensities, antecedent moisture contents and gradients on the Chinese Loess Plateau: A solution of rainfall simulation experiments.Catena, 119: 90-96.

DOI

[79]
Zheng F L, Gao X T, 2004. Up-slope runoff and sediment and down-slope transport-deposition processes.Acta Pedologica Sinica, 41: 134-139. (in Chinese)

[80]
Zheng Z C, He S Q, Wu F Q, 2014. Changes of soil surface roughness under water erosion process.Hydrological Processes, 28: 3919-3929.

DOI

[81]
Zhou P H, Wang Z L, 1987. Soil erosion storm rainfall standard in the Loess Plateau.Bulletin of Soil and Water Conservation, 7: 38-44. (in Chinese)

Outlines

/