Orginal Article

Identifying multispecies dispersal corridor priorities based on circuit theory: A case study in Xishuangbanna, Southwest China

  • YIN Yijie ,
  • LIU Shiliang , * ,
  • SUN Yongxiu ,
  • ZHAO Shuang ,
  • AN Yi ,
  • DONG Shikui ,
  • Ana COXIXO
Expand
  • State Key Laboratory of Water Environment Simulation, School of Environment, Beijing Normal University, Beijing 100875, China

*Corresponding author: Liu Shiliang (1976-), PhD and Professor, E-mail:

Author: Yin Yijie, (1991-), Master Student, specialized in environmental sciences and landscape ecology. E-mail:

Received date: 2018-05-10

  Accepted date: 2019-01-22

  Online published: 2019-07-25

Supported by

National Natural Science Foundation of China, No.41571173

National Key Research and Development Project of China, No.2016YFC0502103

Copyright

Journal of Geographical Sciences, All Rights Reserved

Abstract

Ecological corridor networks can efficiently improve regional landscape connectivity. Corridors for multiple faunal species movements are receiving increasing attention and graph theory is considered a promising way to explore landscape connectivity. In Xishuangbanna, the circuit theory was applied to explore the corridor networks for biodiversity for the first time. In addition, disturbances caused by the road network and the protection efficiency of National Nature Reserves and planned area for corridors were evaluated. Results indicated that the regional corridor networks could be estimated using a modified circuit method and Zonation model. Spatially, the key corridors were concentrated in the central-western, southeastern and northern regions. We detected 66 main intersections between key corridors and the road buffer. Of these points, 65% are forest, 23% grassland and 12% farmland. More than half of the area of National Nature Reserves constituted the top 50% of the corridors, and the planned corridor areas could efficiently protect some key corridors. However, these reserves only protected about 17% of regional key corridors, and the corridor conservation area in the western and northern regions were absent. The issues addressed in our study aided in the elucidation of the importance of regional landscape connectivity assessments and operational approaches in conservation planning.

Cite this article

YIN Yijie , LIU Shiliang , SUN Yongxiu , ZHAO Shuang , AN Yi , DONG Shikui , Ana COXIXO . Identifying multispecies dispersal corridor priorities based on circuit theory: A case study in Xishuangbanna, Southwest China[J]. Journal of Geographical Sciences, 2019 , 29(7) : 1228 -1242 . DOI: 10.1007/s11442-019-1655-5

1 Introduction

Biodiversity protection should focus not only on the establishment of nature reserves, but also on the recognition of dispersal corridors which are crucial to maintaining the ecological processes of wildlife, especially in heterogeneous landscapes (Crooks and Sanjayan, 2006; Kindlmann and Burel, 2008). Dispersal corridors are movement paths for animals, which connect different habitat patches, and thus offer species practical connections that allow passage through the landscape; they play an indispensable role in functional connectivity of the landscape (Haddad, 1999; Bennett, 2003; Pascual-Hortal and Saura, 2006). For faunal species, corridor networks act as necessary natural pathways for seasonal migration, food acquisition, and daily movements (Bright, 1998, Gilbert-Norton et al., 2010; Shen et al., 2014). However, frequent human disturbance has resulted in the increased sensitivity and fragmentation of environments necessary for wildlife survival (Roever et al., 2013; Loro et al., 2015; Gray et al., 2016). For instance, the road construction can exert negative influences on the environment necessary for the survival of local species and affect landscape connectivity (Pan et al., 2009; Liu et al., 2014; Karlson and Mortberg 2015; Qu et al., 2015; Kang et al., 2016). Xishuangbanna in Southwest China is well known as one part of the Indo-Burma biodiversity hotspot (Myers and Mittermeier, 2000). However, during the latest 20 years, there have been remarkable changes in land use and land cover. The natural forests have declined continuously since 1988 (Qu et al., 2015). Compared with 1990, the proportion of forest cover decreased by 26%, whereas the proportions of cultivated land and garden area respectively increased by 3.02% and 21.25% in 2010 (Liu et al., 2014). For terrestrial animals, habitat loss and fragmentation due to land use change tend to be more and more serious in this region. For example, the potential corridors for Asian elephants declined because of the highway construction, farmland and artificial expansion which caused severe human-elephant conflict (Pan et al., 2009). In reality, the biodiversity conservation only by existing nature reserves is not enough to maintain the animal interaction as well as regional landscape connectivity in Xishuangbanna (Tewksbury et al., 2002; Li et al., 2009). In this case, the construction, function and efficiency of regional corridor networks deserve more attention.
Many methods have been used to identify corridor networks. Approaches, such as individual-based movement models (Grimm and Railsback, 2005), least-cost path (LCP) (Adriaensen et al., 2003; Li et al., 2010), probability of connectivity (PC) (Sauraand Pascual-Hortal, 2007), universal corridor network (Landguth et al., 2012), circuit theory (McRae et al., 2008), and other simulations (Pinto and Keitt, 2009; Carroll et al., 2012; Kool et al., 2013) have been widely used. To simulate and analyze corridors, many specialized software programs, in addition to GIS packages, have been developed as helpful tools, such as Linkage mapper (McRae and Kavanagh, 2011), Conefor Sensinode (Saura and Torné, 2009), UNICOR (Landguth et al., 2012), Circuitscape (McRae et al., 2013), and Graphab (Foltête et al., 2012). For faunal species movement, empirical field observations may be the most reliable method to identify pathways and to design connectivity/corridor networks (Stevens et al., 2004; Graves et al., 2007). However, such data are frequently difficult or impossible to obtain for most species and regions (Fagan and Calabrese, 2006). Therefore, the combinations of appropriate simulation models and field observations are more practical for current and future research (Kool et al., 2013; Jiang et al., 2015).
Although the cost-based corridors recognized by the LCP model represent cumulative costs between target patches and provide a valuable planning method for conservation, the application of LCP has some shortcomings, e.g. only one path can be predicted at a time between two habitats (LaRue and Nielsen, 2008; Sawyer et al., 2011). Circuit theory, which uses the principle of an electric circuit, is an effective alternative method that can also intuitively characterize the flow or structure of ecological processes, as well as having additional advantages (McRae and Beier, 2007; Howey, 2011).This modeling can identify all possible movement between any habitats without a certain direction (McRae, 2006; Koen et al., 2014). Because the animals cannot master the full knowledge of the landscape they pass through and may behave differently from different generations, they will not walk strictly along the single optimum route identified by LCP modeling (McRae et al., 2008; Sawyer et al., 2011). In comparison, Circuitscape (namely the circuit landscape) simultaneously presents all possible pathways, in addition to the minimum cost one. That is to say, although the total dispersal cost may not change, the number of potential migration routes can be various and increase (McRae et al., 2008). Moreover, the corridors generated by Circuitscape are insensitive to the cell size of grid data, meaning that the final distribution of the current density (indicating cells through which dispersal animals are likely to pass moving from one patch to another) will not be affected by the resolution of analyzed layers (McRae et al., 2008). Similar to other models, Circuitscape is typically used to estimate local connectivity for a single species (Dickson et al., 2013; Braaker et al., 2014).
The circuit theory is applied to model animal movement patterns (current flows through nodes) across a resistance surface (permeability of habitat types), and predict the vital corridors for random walkers which are shown as cumulative current density flows in Circuitscape software (McRae et al., 2008; McRae et al., 2013). In other words, species dispersal activity is assumed to be an electrical current, and the high current density represents easy movement of animals (McRae et al., 2008). Recently, Koen et al. (2014) developed a new modified approach, which is insensitive to the source (or patch) locations, to identify suitable areas in which multiple species rather than a focal species can move through efficiently. The minimum restriction of the number and the position of random nodes that can be used to predict the connectivity for multiple species were founded (Koen et al., 2014). By integrating the Koen et al. (2014) method, we applied the circuit theory to identify the unbiased current map which indicates regional corridors for multiple species in Xishuangbanna. Further, a ranking approach achieved by Zonation software (Moilanen et al., 2005) was used to determine the corridor priorities which could be more practical for conservation.
Most previous published studies evaluated local corridors for wild Asian elephant (Elephas maximus) (Lin et al., 2006; Lin et al., 2008; Pan et al., 2009) and Gaur (Bosgaurus) (Gan and Hu, 2008) with the aid of long-term field monitoring. However, these studies failed to address regional corridors for more species in Xishuangbanna as this area displays abundant biodiversity in China. Although the Asian Development Bank project in the Greater Mekong Subregion has already proposed some biodiversity corridors to connect existing national reserves and provide the wildlife sanctuaries in Xishuangbanna since 2005 (ADB, 2005), more integrated corridor system is supposed to be needed to cover more areas and more species. Because it is difficult to obtain sufficient observational data, identification of the regional corridor network for multiple species is vital for regional biodiversity conservation planning and management. And because of the road network expansion, human disturbance has become more extensive, which typically restricts large mammal species’ activities within narrow limits (Morrison et al., 2007; Liu et al., 2008). Elucidating the road network impacts on the functional connectivity is also critical for effective conservation strategies (Mimet et al., 2016).
To better understand the potential of corridors for improving regional landscape connectivity in this study area, the goals of our study are to 1) identify the potential corridors for multiple territorial species in Xishuangbanna using the modified circuit theory; 2) recognize the key corridors and discern the key bottleneck locations based on the priority ranking of the appropriate unbiased current density map as well as the road network; 3) evaluate the protection efficiency of existing National Nature Reserves and planned corridor areas for key corridors.

2 Materials and methods

2.1 Study area

Xishuangbanna (21°09′-22°36′N, 99°58′-101°50′E) Dai Autonomous Prefecture, located at the southernmost point of Yunnan Province, has an area of approximately 19,120 km2. It borders Laos and Myanmar, and the elevation is 474-2429 m above sea level with many hilly areas. The Lancang River flows through this region from north to south (Figure 1). Because of the tropical monsoon climate, Xishuangbanna covers the largest area of tropical forest in China and has numerous species and high biodiversity. In this area, five National Nature Reserves, namely, Mengyang, Mengla, Shangyong, Menglun, and Mangao, have been established to protect local animal and plant resources since the 1950s.
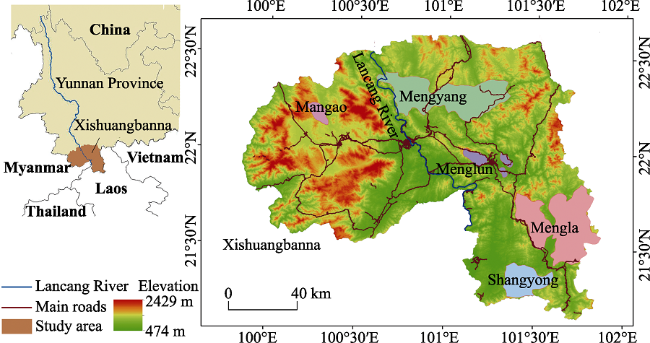
Figure 1 Location of the study area

2.2 Identifying the unbiased current density map

Circuit theory provides an effective method to identify environments for the survival of wildlife by considering all possible dispersal pathways (Howey, 2011). The potential corridors recognized by the unbiased current density map represent different opportunities for animals to move through heterogeneous landscapes. To predict the corridors through the application of circuit theory and reduce edge effects, the buffer zone of the study area and the resistance surface should be created first. Three factors are addressed in the process of developing the resistance surface.
Land cover. The land use layer analyzed in our study was downloaded from GlobeLand30 (2010) (GLC), which was launched by the National Geomatics Center of China (http://www.globallandcover.com/GLC30Download/index.aspx). The 30-m GLC data had 10 classes, seven of which were included in our study area, namely, cultivated land, forest, grassland, shrubland, wetland, water bodies, and artificial surfaces.
Roads. Roads data were obtained from the OpenStreetMap (http://www.openstreetmap.org/#map=5/12.361/113.247) and reclassified into three levels: first-level road (primary roads, motorways and service roads), second-level roads (secondary roads and trunks), and third-level road (trails, footways, paths and remaining unclassified roads).
Terrain features. The Terrain Ruggedness Index (TRI) was chosen to characterize the terrain features and was calculated with the help of QGIS software based on the DEM data obtained from Consortium for Spatial Information (http://srtm.csi.cgiar.org/SELECTION/inputCoord.asp).
According to the study of Koen et al., 2014, in order to acquire the unbiased current density map, a 35 km wide buffer zone, namely, the 20% width of the entire zone, was created around the study area. Furthermore, 15 random nodes that were assumed as habitat patches were selected at the edge of the buffer zone. To create resistance layers (the value of resistance is the reciprocal of permeability), the permeability of the above mentioned variable was assigned to be one of three degrees, 1000 (animals could freely pass), 100 (difficult for animals to pass but not impossible), and 10 (impossible for animals to pass), according to previous relevant studies (Eide et al., 2000; Feng et al., 2010; Koen et al., 2014; Ruiz-Gonzalez et al., 2014) (Table 1).
Table 1 The assignment of permeability values
Factors Variables Permeability
Land use Cultivated land 100
Forest 1000
Grassland 1000
Shrubland 1000
Wetland 1000
Water body 10
Artificial surface 10
Roads First level 10
Second level 100
Third level 1000
Terrain feature 0<TRI≤5 1000
5<TRI≤10 100
TRI>10 10
Layers of different factors were weighted equally and were added in ArcGIS 10.0 to create the buffered resistance surface, which was further resampled at 90 m × 90 m by choosing the NEAREST option (which performs a nearest neighbor assignment) in ArcGIS for the sake of facilitating the computation in the Circuitscape software 4.0. The cumulative current density was calculated using the pairwise mode with eight neighboring cells and used 1 ampere (1A) as the initial input. To focus on the study area, the buffer zone was then removed after the unbiased current density map was produced. We collected 303 points for Asian elephants and 24 points for green peacock (Pavomuticus) by digitizing the distribution maps in the range of permitted errors according to previous studies (Lin et al., 2011; He et al., 2014; Lin et al., 2014). Then, we compared the current density at random points to actual observations to assess whether animals are using areas that we identified as the movement corridor. The relationship between these two types of points was determined and their mean current densities were quantified using t-test analyses in SPSS 18.0.

2.3 Ranking corridor priorities and discerning key block points

The most common way to rank the grid data is directly classifying them based on the quantity order (Myers and Mittermeier, 2000; Anderson et al., 2009). However, Zonation model can consider the importance of all cells at the scale of the study area and offer a feature-specific representation loss curve (Lehtomäki and Moilanen, 2013). Software Zonation 4.0 was applied to rank the pixel-level current density map in our study. It iteratively removes a given number of cells from the landscape in accordance with the minimization of marginal loss. This method is widely used to recognize conservation priorities considering multiple features (Moilanen et al., 2011; Lehtomäki and Moilanen, 2013). Here, we considered only the current density and chose the additive benefit function removal rule to prioritize the potential corridors in Xishuangbanna. The top 20% of the ranking values were extracted and defined as the key corridors in our study.
In addition, key block points (i.e. the intersections of the key corridor and the road buffer) influenced by the road were discerned. The road buffer (100 m per side) was created and transformed into 100 m × 100 m grids using the Fishnet and Clip tools in ArcGIS. Key block points were determined with a pre-defined rule according to local conditions (Figure A1). These points would impede species from easy movement, and also played an important role in restoring regional landscape connectivity.

2.4 Assessing the protection of existing protected areas

The statuses of five National Nature Reserves and three planned corridor areas were further analyzed in terms of corridor protection based on the distribution of key corridors. Priority corridors in each reserve were extracted by the overlay method in ArcGIS to clearly and intuitively show the corridor distribution, and the proportions of different ranking levels of corridors within the reserves were also compared. Furthermore, we collected the planned corridor areas which are going to be constructed or in the construction period between the National Nature Reserves, and overlaid the zones of corridor areas with key corridors to assess the protection effectiveness of regional corridor network, identify the protection gaps, and propose some advices.

3 Results

3.1 Distribution of key corridors and key block points

Based on the resistance surface, unbiased current density maps were produced, which can appropriately represent the spatial distribution of potential corridors (Figure 2). Red sections are the potential corridors, whereas the blue areas are the unsuitable areas for species migration. The higher the current density, the greater the chances of species use. The cumulative current density ranged from 0.002 A to 0.342 A, and the average value was 0.041 A. Obviously, there were many potential corridors distributing throughout the study area and a majority of them were outside the established National Nature Reserves. The current map was validated by the actual location points for Asian elephants and Green peafowl via t-test (These distribution points were digitized in ArcGIS based on the previous studies of others, and the error was strictly controlled). The results showed that the current map was significantly correlated with actual location points for both Asian elephants and Green peafowls (elephants: t = 3.92, P < 0.001; peafowl: t = 3.68, P < 0.001). Furthermore, for Asian elephants, the mean current density for the random points and actual locations were respectively 0.040A, 0.049A; for Green peafowls, the corresponding average values were 0.041A and 0.065A (Figure 3).
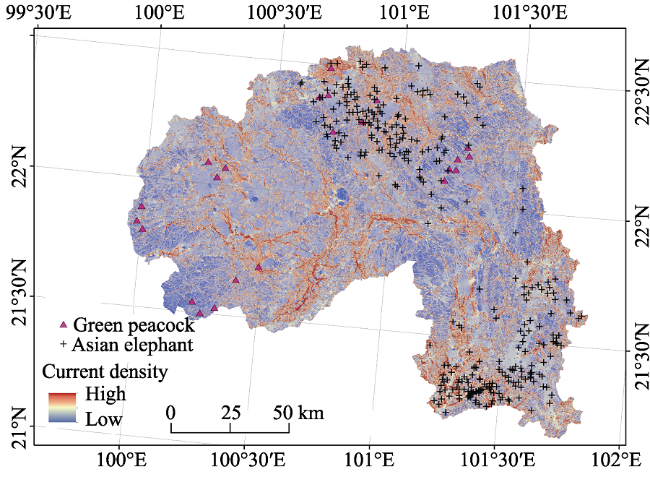
Figure 2 The appropriate current density map for multiple species in Xishuangbanna
Figure 3 Locations of local representative species
The Zonation offers a current-specific representation loss curve to help us understand the distribution change of current feature. Although the meaning of a single-feature performance curve is limited, we discover that the current distribute unevenly in the study area, and nearly 45% of the current density remains when 80% of the landscape is lost (Figure 4). The key corridor which was approximately 20% of the landscape accounted for nearly half of the overall current. Key corridors (top 20% based on the priority ranking) concentrated in the northern, the southeastern and the central-western regions (Figure 5); in addition, 66 block points were discerned (Figures 5b and A1). These block points were composed of 65% forest, 23% grassland and 12% farmland.
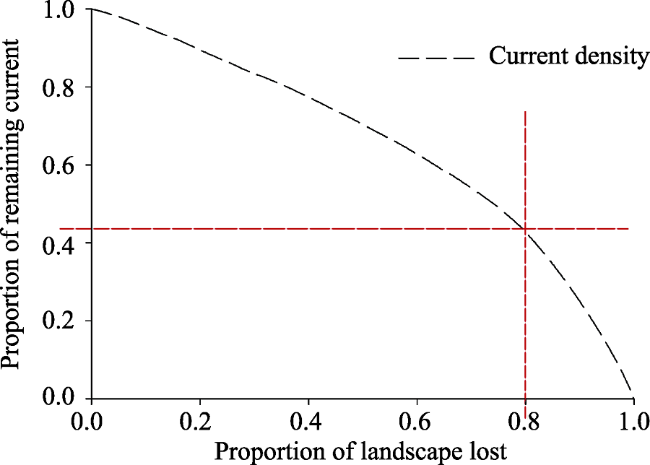
Figure 4 The current-specific curve derived from basic Zonation output
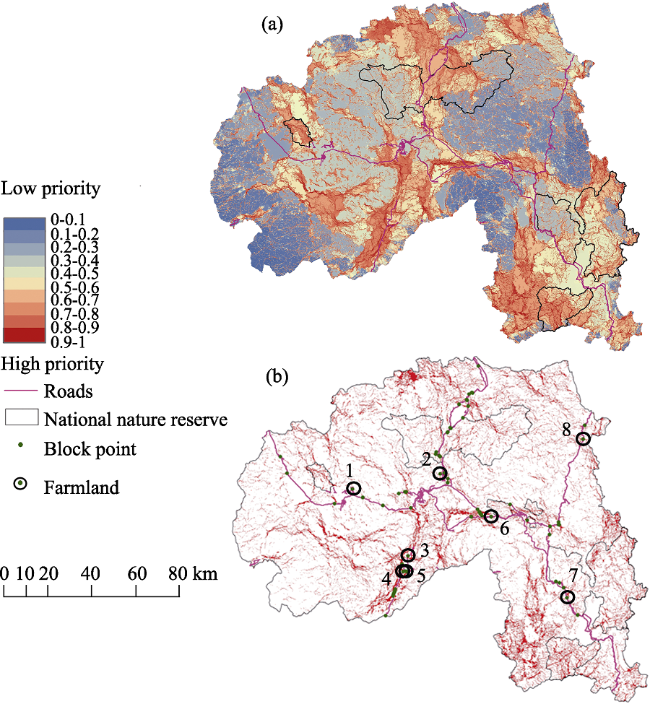
Figure 5 Ranking result of corridors derived from the Zonation analysis (a). The top 20% of the potential corridors which were viewed as key corridors and the block points were marked as green points (b). Those marked with numbers were farmland block points.

3.2 Evaluation of existing conservation projects

The percentage of the top 50% corridors in nature reserves in descending order was Mangao (98%), Shangyong (86%), Menglun (72%), Mengla (57%), and Mengyang (52%). Key corridors accounted for less than 30% of the nature reserves, expect for Mangao, where key corridors accounted for 47% of the local area (Table 2). The large images of the key corridors of different nature reserves were displayed in Figure A2. Although these reserves were established because of protection priorities, they protected only 17% of the key corridor areas in Xishuangbanna.
Table 2 Proportions of potential corridors for different ranking levels in each national nature reserve (%)
Corridor ranks Mengyang Mengla Shangyong Menglun Mangao
< 50% 48.3 43.5 13.8 28.3 2.3
> 50% 51.7 56.5 86.2 71.7 97.7
> 80% 21.3 (6.3) 19.6 (5.9) 29.3 (2.6) 23.1 (0.7) 46.6 (1.2)
Percentage of total key corridors 4.6 7.2 3.7 0.8 0.9

Note: Numbers in brackets are the proportions of the total key corridors of the whole study area. Other numbers only considered the corridors within each reserve. “> 80%” in this table means the same with “top 20%”.

The planned corridor areas performed well in the key corridor protection, some of them indeed protected the key corridors that have a special position (Figure 6). The Xiaoheijiang-Chawashuhe Area efficiently focused on the key corridors, of which the both sides are poor in providing potential corridors. Furthermore, Chawangshuhe-Mengla Area was too important to guarantee the concentrated key corridors away from being destroyed and improved the protection system of Mengla Nature Reserve. For Mengla-Shangyong Area, the inner corridor situation was worse than the other corridor areas; in other words, the alternative corridors inside Mengla-Shangyong Area were much more less and need more attentions.
Figure 6 The comparison of planned corridor areas and key corridors

4 Discussion

4.1 Advantages and challenges of the study methods

In the study of Koen et al., 2014, the current density maps with different buffer widths of the study area were compared to eliminate the bias of the node position, and the maps with different numbers of the random nodes located along the buffer edge were also compared. As a case study, we used 15 random nodes to produce the unbiased current density map when the buffer width of the study area is approximately 20% of the study area size which is also considered to be wide enough to remove border effects. Therefore, to verify the applicability of this method in our study area, we conducted scenario analyses (for each scenario, two trials were conducted), placing different random nodes (5, 10, 15, 20, 25, and 50 nodes) around the perimeter zone of the buffered resistance area, and compared the result of each case by the Pearson’s correlation coefficient that was calculated in the SPSS software (Figures 7 and A3). The correlation coefficients between two trials showed that the current map in the context of 15 nodes had a relatively stable performance. Furthermore, the coefficients between the results of 50 nodes and those with fewer nodes exhibited a significant increase since the scenario of 15 nodes, ranging from < 0.9 to > 0.9, obviously indicating that 15 random nodes were necessary to obtain the appropriate unbiased current density map.
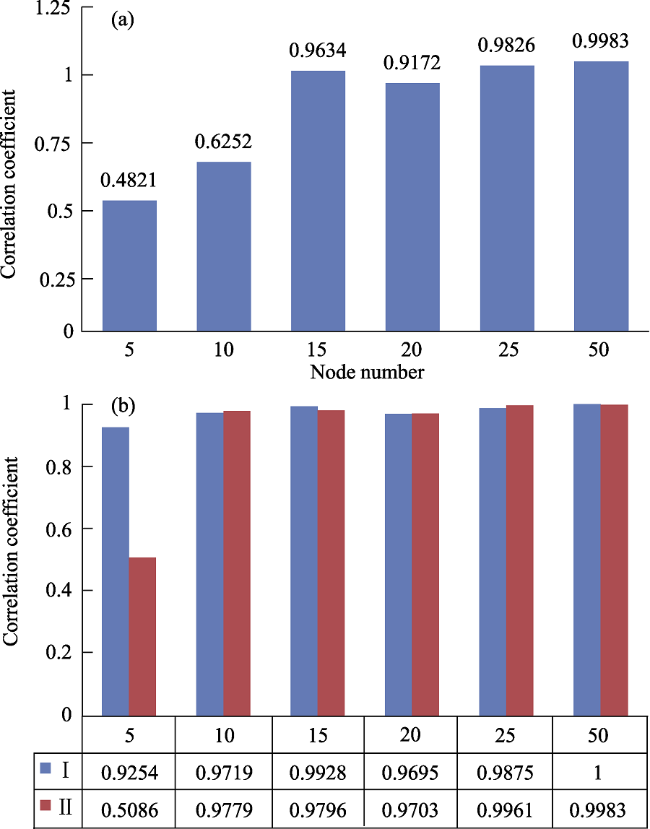
Figure 7 Comparisons of correlation coefficients between the first and second trials with the same number of nodes (a); correlation coefficients between 50 nodes and fewer nodes number (b)
Consequently, based on the improved approach of Koen et al., 2014, we achieved the appropriate current density map which indicated the potential pathways for the multispecies dispersal for the first time in Southwest China. Based on the unbiased current density map, it is necessary to identify the key corridors which need the priority conservation. Therefore, we ranked the corridor priorities using the Zonation software, and further identified the keyblock points as well as the corresponding land uses. Key corridors derived from ranking priorities in Zonation software represent the areas that could provide regional-scale landscape connectivity within the region of Xishuangbanna. These corridors could contribute substan tially to local biodiversity conservation and dispersal distribution prediction given the accel- erated changes in land uses (Breckheimer et al., 2014; Belote et al., 2016).
However, there are some challenges we face in discerning the corridor network for multispecies. The circuit theory is connected to random walk theory which assumes that the species movement belongs to the random choice according to the surrounding circumstances (McRae et al., 2008). This assumption may ignore some movement details: sometimes the species will select the migration or dispersal pathways which they are familiar
with based on past knowledge of the environment or some indicative plants. Another problem is that the current map identified by the Circuitscape software without incorporating maximum dispersal distance thresholds cannot distinguish the specific contribution of each pathway to currently dispersal (Lechner et al., 2015). Some species are sensitive to some specific impact factors and may need sensitivity analysis; for the construction of the specific corridor, the actual conditions of the focused region should also be considered. Nevertheless, the corridors for multispecies, though including some redundant ones, make more sense in maintaining the regional landscape connectivity and are useful for identifying areas for future conservation and restoration. And if the corridors of some targeted animals are planned to be constructed in local areas based on the regional multispecies dispersal corridors, more empirical researches will be needed to further improve the final results.

4.2 Impacts of human activities on key corridors

Given that there are large areas of forestland (including the artificial forest), key corridors are widely distributed in Xishuangbanna. From Figure 5 we can see that corridors with high priority levels are mainly distributed in the places where intensive human activities exist. These areas have low levels of terrain roughness, and are probably always preferred by both humans and wildlife. Although some of these areas are mainly occupied by artificial forests, they could still provide opportunities for species movement (Brockerhoff et al., 2008; Liu et al., 2014). In Xishuangbanna, Asian elephants might sometimes appear in the area (e.g. the farmland) that is not suitable for them to habitat, and studies have found that Asian elephants may invade the farmland from time to time, which aggravates the human-elephant conflict (He et al., 2014; Chen et al., 2016).
It is a known fact that corridors facilitate the exchange and interactions among the patches for the terrestrial animal (Tewksbury et al., 2002; Gilbert-Norton et al., 2010). Therefore, if roads cut the network of corridors, the corridors will not perform fully and impede animal from migrating further (Gurrutxaga and Saura, 2013; Loro et al., 2015). The identified block points should be given special attentions. Although these points could have a big chance to be used by animals to migrate, they cannot efficiently support this kind of activity as it is because of the road disturbance. Protection and rational utilization of these bottleneck areas would reduce the mortality of migratory species when they cross roads (Forman and Deblinger, 2000, Eigenbrod et al., 2009). Over-pass or under-pass tunnels built around the block points could greatly contribute to the permeability of the environment for wildlife (Mimet et al., 2016). The changes of farmland key points into forestland or grassland also facilitate the construction of movement areas and reduce human impacts. This type of restoration could contribute much to the improvement of regional landscape connectivity.

4.3 Implications of future conservation management

The established national nature reserves, representing positive protection measurements, protected only 16.6% of the key corridors and more than half of their internal potential corridors belonged to the top 50% based on priority ranking. Thus, the existing nature reserves play a limited role in the maintenance of regional key corridors. Details of the distribution of key corridors in each reserve provided a better understanding of their inner landscape connectivity. The conservation of key corridors in these reserves can maintain the integrity of the whole corridor network at regional scale. The maintenance of corridors within the national nature reserve not only offers species short-term opportunities for dispersal or foraging, but also guides the planning framework for land use and maintains landscape integrity in heterogeneous environments (Bennett, 2003; Shen et al., 2014). However, appropriate extensions of corridor outside the reserves in some cases would increase the conservation of regional landscape connectivity. The areas with intensive corridors outside of the natural nature reserves deserve more concern, as protection of these areas could establish a more efficient reserve network among existing reserves. Although the three planned corridor areas can protect some key corridors among National Nature Reserves, there are still many multispecies corridors remained to be protected. For instance, the key corridors between Mengla and Menglun reserves are abundant but without the efficient protection right now. Furthermore, key corridors in the northern and western regions could maintain the dispersal pattern of terrestrial animals and need more concerns though they are not directly related with the national nature reserves.
For some species, the cost-based corridors may not perform effectively compared to field camera tracking data (LaPoint et al., 2013). However, this problem exists in most corridor models, which could be improved by incorporating monitoring data in the future research. Because of the data limitation, only three factors were considered in our study to model the regional corridors. Future research on further refining the regional corridor network or focusing on one or two specific species should include more elements, such as water sources and human population density. Although our study focused on the broader corridor network, it was a successful beginning in the identification of key corridors for biodiversity in Xishuangbanna. Spatial distribution of unbiased regional corridors not only offers distinctive additions to further smaller-scale studies (like “reserve planning” or “corridors restoration among small patches”), but also aids in sustaining the regional biodiversity and landscape connectivity. In this study, we identified the land use percentage of block points. For each corridor block points, a very detailed condition could be derived and different parties could be involved. As such, further work on corridor planning may be accomplished by modeling and monitoring, in addition to the government policy and local farmer opinions. In summary, cooperation among research institutes, governments, and local farmers are needed to address the issues related to the conservation in Xishuangbanna.

5 Conclusion

We used circuit theory to predict multispecies corridors in Xishuangbanna, southwestern China following an improved method of Koen et al., 2014. The appropriate unbiased current density map identified by the Circuitscape model represents the potential corridors for multispecies movement. In addition, key corridors identified by pixel-based priority ranking reveal the regional landscape connectivity for multiple terrestrial animals more or less. The key crossing areas associated with road network disturbance are also recognized based on the structure of current flow, which are important in the restoration of landscape connectivity and can be the alternative sites of the construction of pass tunnels. Furthermore, the protection efficiency of the national nature reserves and planned corridor areas for key corridors cannot be ignored. The corridor conservation is taking shape in Xishuangbanna. However, it is still in the primary phase, and there are many remaining key corridors need to be protected appropriately.
In Xishuangbanna, the key corridor network will address the critical landscape element for restoring species movements and determine whether existing protected areas are effective for the functional connectivity. Approaches we used to recognize corridor priorities are universally applicable in county-level regions, and our results have wide applicability in regional landscape in Xishuangbanna and elsewhere in the world where planning and biodiversity conservation are needed.

Appendix

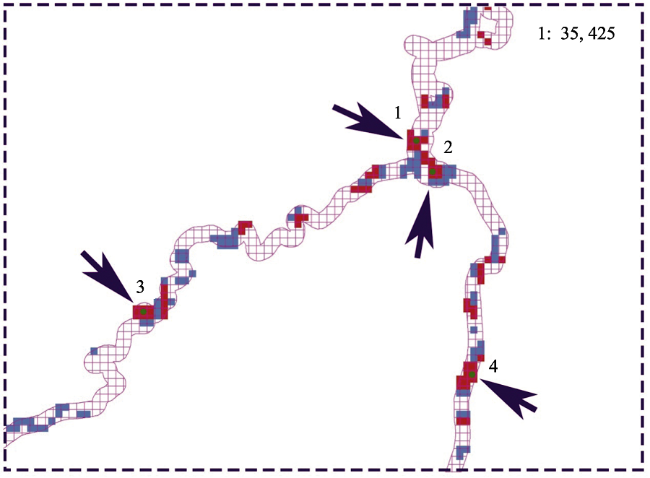
Figure A1 Top 20% of the potential corridors were extracted and classified into two levels (0.8-0.9 and 0.9-1). The block points were marked as the green points according to following standards (these standards must be satisfied at the same time):

All the intersections should locate at top 10% area (0.9-1).

There should be at least 5 top 10% grids in a 3 × 3 road grid which surrounds the target intersection.

Compared with the situation in the 3 × 3 road grid, it is supposed to increase at least 1 key corridor grid that belongs to top 20% in a 4 × 4 road grid which includes the compared 3 × 3 road grid.

Any two intersections are at least 400 m apart.

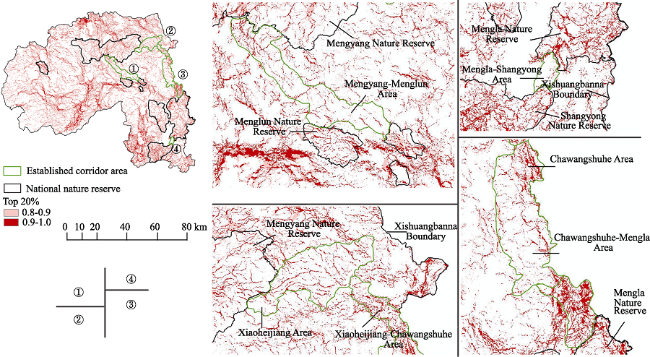
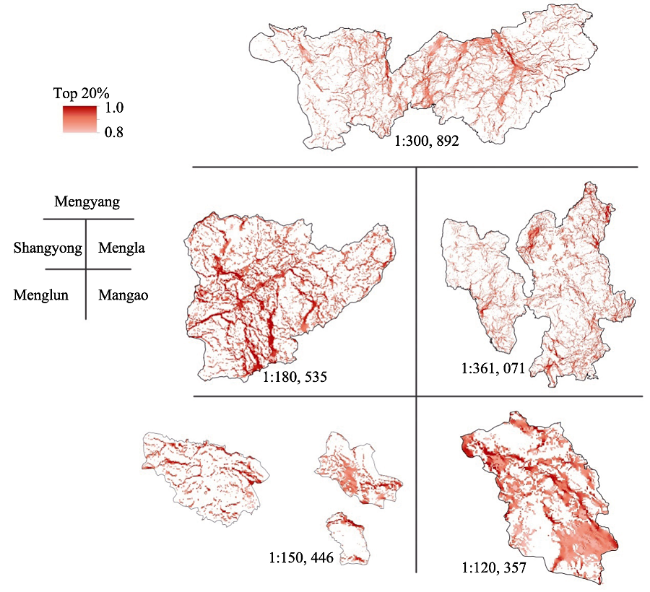
Figure A2 Details of the distribution of key corridors (top 20%) in each reserve (Mengyang, Mengla, Shangyong, Menglun, Mangao) were shown respectively. The key corridors distributed evenly within the scope of Mengyang and Mengla nature reserves, while the key corridors exhibited much more clear structures in the other three reserves. These areas recognized as key corridors at the scale of Xishuangbanna play a critical role in biodiversity protection for sub-reserve management.
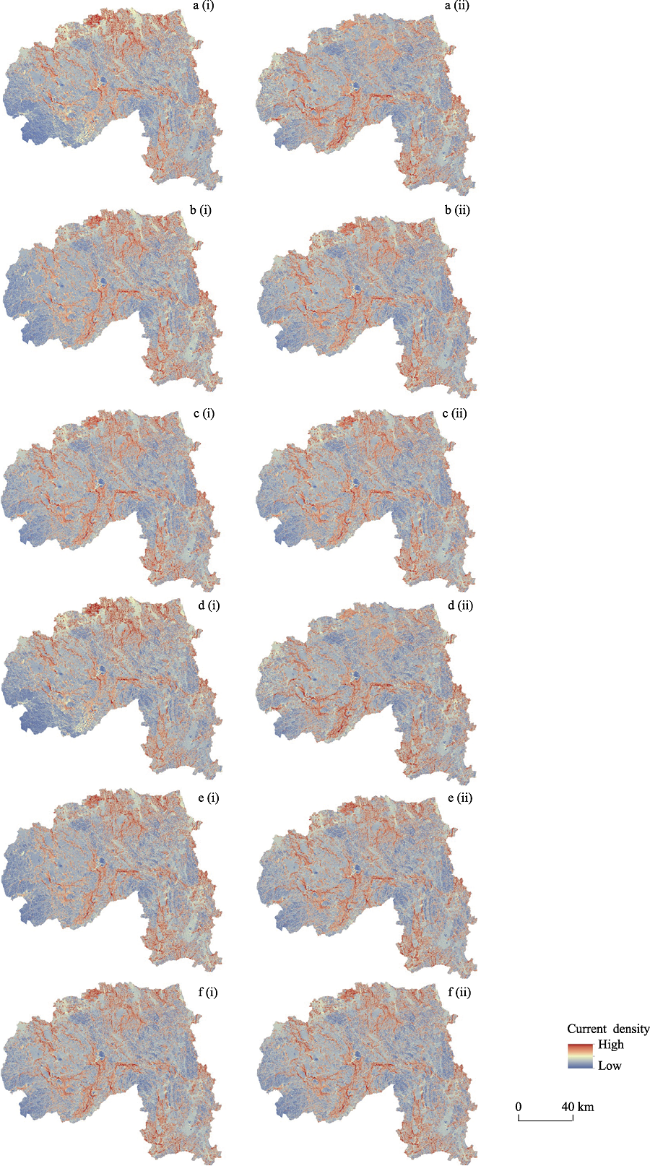
Figure A3 Different scenarios - 5 nodes, 10 nodes, 15 nodes, 20 nodes, 25 nodes and 50 nodes - were shown as the order alphabetic characters (from “a” to “f”). (i) and (ii) represent the first trial and the second trial respectively which were under the same nodes number. The differences among these current density maps can be intuitively compared.

The authors have declared that no competing interests exist.

1
Adriaensen F, Chardon J P, De Blust G et al., 2003. The application of ‘least-cost’ modelling as a functional landscape model. Landscape and Urban Planning, 64(4): 233-247.

DOI

2
Anderson B J, Armsworth P R, Eigenbrod F et al., 2009. Spatial covariance between biodiversity and other ecosystem service priorities. Journal of Applied Ecology, 46(6): 888-896.

DOI

3
Asian Development Bank, 2005. News Release: Mekong Leaders Endorse Biodiversity Conservation Corridors Initiative. (Accessed May, 2017 at: )

4
Belote R T, Dietz M S, McRae B H et al., 2016. Identifying corridors among large protected areas in the United States. Plos One, 11(4): e0154223.

DOI

5
Bennett A F, 2003. Linkages in the Landscape: The Role of Corridors and Connectivity in Wildlife Conservation. IUCN, Switzerland and Cambridge, UK.

6
Braaker S, Moretti M, BoeschR et al.BoeschR , 2014. Assessing habitat connectivity for ground-dwelling animals in an urban environment. Ecological Applications, 24(7): 1583-1595.

DOI

7
Breckheimer I, Haddad N M, Morris W F et al., 2014. Defining and evaluating the umbrella species concept for conserving and restoring landscape connectivity. Conservation Biology, 28(6): 1584-1593.

DOI

8
Bright P W, 1998. Behaviour of specialist species in habitat corridors: Arboreal dormice avoid corridor gaps. Animal Behaviour, 56(6): 1485-1490.

DOI

9
Brockerhoff E G, Jactel H, Parrotta J A et al., 2008. Plantation forests and biodiversity: Oxymoron or opportunity? Biodiversity and Conservation, 17(5): 925-951.

DOI

10
Carroll C, McRae B H, Brookes A, 2012. Use of linkage mapping and centrality analysis across habitat gradients to conserve connectivity of gray wolf populations in western North America. Conservation Biology, 26(1): 78-87.

DOI

11
Chen Y, Marino J, Chen Y et al., 2016. Predicting hotspots of human-elephant conflict to inform mitigation strategies in Xishuangbanna, Southwest China. Plos One, 11(9): e0162035.

DOI

12
Crooks K R, Sanjayan M A, 2006. Connectivity Conservation. Cambridge University Press.

13
Dickson B G, Roemer G W, McRae B H et al., 2013. Models of regional habitat quality and connectivity for pumas (Puma concolor) in the Southwestern United States. Plos One, 8(12): e81898.

DOI

14
Eide N E, Nelleman C, Prestrud P, 2000. Terrain structure and selection of denning areas by arctic foxes on Svalbard. Polar Biology, 24(2): 132-138.

15
Eigenbrod F, Hecnar S J, Fahrig L, 2009. Quantifying the road-effect zone: Threshold effects of a motorway on anuran populations in Ontario, Canada. Ecology & Society, 14: 24-[18pp].

16
Fagan W F, Calabrese J M, 2006. Quantifying Connectivity: Balancing Metric Performance with Data Requirements. New York: Cambridge University Press.

17
Feng L, Wang Z, Lin L et al., 2010. Habitat selection in dry season of Asian elephant (Elephas maximus) and conservation strategies in Nangunhe National Nature Reserve, Yunnan, China. Acta Theriologica Sinica, 30(1): 1-10. (in Chinese)

DOI

18
Foltête J-C, Clauzel C, Vuidel G, 2012. A software tool dedicated to the modelling of landscape networks. Environmental Modelling & Software, 38: 316-327.

19
Forman R T T, Deblinger R D, 2000. The ecological road-effect zone of a Massachusetts (U.S.A.) suburban highway. Conservation Biology, 14(1): 36-46.

DOI

20
Gan H X, Hu H B, 2008. Biodiversity conservation corridor design based on habitat selection of gaur (Bos gaurus): A case study from Xishuangbanna, China. Chinese Journal of Ecology, 27(12): 2153-2158. (in Chinese)

21
Gilbert-Norton L, Wilson R, Stevens J R et al., 2010. A meta-analytic review of corridor effectiveness. Conservation Biology, 24(3): 660-668.

DOI

22
Graves T A, Farley S, Goldstein M I et al., 2007. Identification of functional corridors with movement characteristics of brown bears on the Kenai Peninsula, Alaska. Landscape Ecology, 22(5): 765-772.

DOI

23
Gray M, Wilmers C C, Reed S E et al., 2016. Landscape feature-based permeability models relate to puma occurrence. Landscape and Urban Planning, 147: 50-58.

DOI

24
Gurrutxaga M, Saura S, 2013. Prioritizing highway defragmentation locations for restoring landscape connectivity. Environmental Conservation, 41(2): 157-164.

25
Haddad N M, 1999. Corridor and distance effects on interpatch movements: A landscape experiment with Butterflies. Ecological Applications, 9(2): 612-622.

DOI

26
He Q, Wu Z, Xu F et al., 2014. Human-elephant relations becoming crisis in Xishuangbanna, Southwest China. In: Hong S-K, Bogaert J, Min Q (eds.). Biocultural Landscapes: Diversity, Functions and Values. Dordrecht: Springer Netherlands, 69-80.

27
Howey M C L, 2011. Multiple pathways across past landscapes: Circuit theory as a complementary geospatial method to least cost path for modeling past movement. Journal of Archaeological Science, 38(10): 2523-2535.

DOI

28
Jiang G, Qi J, Wang G et al., 2015. New hope for the survival of the Amur leopard in China. Scientific Reports, 5: 15475.

DOI

29
Kang W M, Minor E S, Woo D et al., 2016. Forest mammal roadkills as related to habitat connectivity in protected areas. Biodiversity and Conservation, 25(13): 1-14.

DOI

30
Karlson M, Mortberg U, 2015. A spatial ecological assessment of fragmentation and disturbance effects of the Swedish road network. Landscape and Urban Planning, 134: 53-65.

DOI

31
Kindlmann P, Burel F, 2008. Connectivity measures: A review. Landscape Ecology, 23(8): 879-890.

32
Koen E L, Bowman J, Sadowski C et al., 2014. Landscape connectivity for wildlife: Development and validation of multispecies linkage maps. Methods in Ecology and Evolution, 5(7): 626-633.

33
Kool J T, Moilanen A, Treml E A, 2013. Population connectivity: Recent advances and new perspectives. Landscape Ecology, 28(2): 165-185.

DOI

34
Landguth E L, Hand B K, Glassy J et al., 2012. UNICOR: A species connectivity and corridor network simulator. ,Ecography, 35(1): 9-14.

35
LaPoint S, Gallery P, Wikelski M et al., 2013. Animal behavior, cost-based corridor models, and real corridors. Landscape Ecology, 28(8): 1615-1630.

DOI

36
LaRue M A, Nielsen C K, 2008. Modelling potential dispersal corridors for cougars in midwestern North America using least-cost path methods. Ecological Modelling, 212(3/4): 372-381.

DOI

37
Lechner A M, Harris R M S, Doerr V et al., 2015. From static connectivity modelling to scenario-based planning at local and regional scales. Journal for Nature Conservation, 28: 78-88.

DOI

38
Lehtomäki J, Moilanen A, 2013. Methods and workflow for spatial conservation prioritization using Zonation. Environmental Modelling & Software, 47: 128-137.

39
Li H, Li D, Li T et al., 2010. Application of least-cost path model to identify a giant panda dispersal corridor network after the Wenchuan earthquake: Case study of Wolong Nature Reserve in China. Ecological Modelling, 221(6): 944-952.

DOI

40
Li Z, Chen M, Wu Z, 2009. Research advances in biological conservation corridor. Chinese Journal of Ecology, 28(3): 523-528. (in Chinese)

41
Lin L, Feng L, Zhao J et al., 2006. A preliminary study on designing ecological corridors in Xishuangbanna National Nature Reserve with 3S techniques. Journal of Beijing Normal University (Natural Science), 42(4): 405-409. (in Chinese)

42
Lin L, Jin Y, Chen D et al., 2014. Population and habitat status of Asian elephants (Elephas maximus) in sub-reserve of Xishuangbanna National Nature Reserve, Yunnan of China. Acta Ecologica Sinica, 34(7): 1725-1735. (in Chinese)

43
Lin L, Zhang L, Luo A et al., 2011. Population dynamics, structure and seasonal distribution pattern of Asian elephant (Elephas maximus) in Shangyong Protected Area, Yunnan, China. Acta Theriologica Sinica, 31(3): 226-234. (in Chinese)

44
Lin L, Zhu W, Zhang L et al., 2008. The opening up and utilization of a new movement corridor by Asian elephants (Elephas maximus) in Shangong Nautre Reserve, Yunnan. Acta Theriologica Sinica, 28(4): 325-332. (in Chinese)

45
Liu S, Wen M, Cui B et al., 2008. Ecological effect of road based on network analysis: A case study in Lancang River Valley. Acta Ecologica Sinica, 28(4): 1672-1680. (in Chinese)

46
Liu X, Feng Z, Jiang L et al., 2014. Spatial-temporal pattern analysis of land use and land cover change in Xishuangbanna. Resources Science, 36(2): 233-244. (in Chinese)

47
Loro M, Ortega E, Arce R M et al., 2015. Ecological connectivity analysis to reduce the barrier effect of roads. An innovative graph-theory approach to define wildlife corridors with multiple paths and without bottlenecks. Landscape and Urban Planning, 139: 149-162.

DOI

48
McRae B H, 2006. Isolation by resistance. Evolution, 60(8): 1551-1561.

DOI

49
McRae B H, Beier P, 2007. Circuit theory predicts gene flow in plant and animal populations. PNAS, 104(50): 19885-19890.

DOI

50
McRae B H, Dickson B G, Keitt T H et al., 2008. Using circuit theory to model connectivity in ecology, evolution, and conservation. Ecology, 89(10): 2712-2724.

DOI

51
McRae B H, Kavanagh D M, 2011. Linkage mapper connectivity analysis software. The Nature Conservancy, Seattle WA.

52
McRae B H, Shah V B, Mohapatra T K, 2013. Circuitscape 4 User Guide. The Nautre Conservancy.

53
Mimet A, Clauzel C, Foltête J-C, 2016. Locating wildlife crossings for multispecies connectivity across linear infrastructures. Landscape Ecology, 31(9): 1-19.

DOI

54
Moilanen A, Anderson B J, Eigenbrod F et al., 2011. Balancing alternative land uses in conservation prioritization. Ecological Applications, 21(5): 1419-1426.

DOI

55
Moilanen A, Franco A M A, Early R I et al., 2005. Prioritizing multiple-use landscapes for conservation: Methods for large multi-species planning problems. Proceedings of the Royal Society B: Biological Sciences, 272(1575): 1885-1891.

56
Morrison J C, Sechrest W, Dinerstein E et al., 2007. Persistence of large mammal faunas as indicators of global human impacts. Journal of Mammalogy, 88(6): 1363-1380.

DOI

57
Myers N, Mittermeier R A, 2000. Biodiversity hotspots for conservation priorities. Nature, 403(6772): 853.

DOI

58
Pan W, Lin L, Luo A et al., 2009. Corridor use by Asian elephants. Integrative Zoology, 4(2): 220-231.

DOI

59
Pascual-Hortal L, Saura S, 2006. Comparison and development of new graph-based landscape connectivity indices: Towards the priorization of habitat patches and corridors for conservation. Landscape Ecology, 21(7): 959-967.

DOI

60
Pinto N, Keitt T H, 2009. Beyond the least-cost path: Evaluating corridor redundancy using a graph-theoretic approach. Landscape Ecology, 24(2): 253-266.

DOI

61
Qu D, Xu J, Dai Z, 2015. Forest transition in Xishuangbanna, Yunnan. Plant Diversity and Resources, 37(1): 93-98. (in Chinese)

62
Roever C L, van Aarde R J, Leggett K, 2013. Functional connectivity within conservation networks: Delineating corridors for African elephants. Biological Conservation, 157: 128-135.

DOI

63
Ruiz-Gonzalez A, Gurrutxaga M, Cushman S A et al., 2014. Landscape genetics for the empirical assessment of resistance surfaces: The European Pine Marten (Martesmartes) as a target-species of a regional ecological network. Plos One, 9(10): e110552.

DOI

64
Saura S, Pascual-Hortal L, 2007. A new habitat availability index to integrate connectivity in landscape conservation planning: Comparison with existing indices and application to a case study. Landscape and Urban Planning, 83(2/3): 91-103.

DOI

65
Saura S, Torné J, 2009. Conefor Sensinode 2.2: A software package for quantifying the importance of habitat patches for landscape connectivity. Environmental Modelling & Software, 24(1): 135-139.

66
Sawyer S C, Epps C W, Brashares J S, 2011. Placing linkages among fragmented habitats: Do least-cost models reflect how animals use landscapes? Journal of Applied Ecology, 48(3): 668-678.

DOI

67
Shen Z, Wang Y, Fu B, 2014. Corridors and networks in landscape: Structure, functions and ecological effects. Chinese Geographical Science, 24(1): 1-4.

DOI

68
Stevens V M, Polus E, Wesselingh R et al., 2004. Quantifying functional connectivity: Experimental evidence for patch-specific resistance in the Natterjack toad (Bufocalamita). Landscape Ecology, 19(8): 829-842.

DOI

69
Tewksbury J J, Levey D J, Haddad N M et al., 2002. Corridors affect plants, animals, and their interactions in fragmented landscapes. PNAS, 99(20): 12923-12926.

DOI

Outlines

/